Fig. 1
Biocontinuum. Clinicopathalogic course: the blood and marrow (total-body-irradiation). The elements of the blood and bone marrow follow a response pattern of decreased number after irradiation owing to their cell kinetics after destruction of primitive radiosensitive precurser cells. The neutropenia seen in the first week is due to a cessation of production and rapid turnover of these cells. This is followed in two to three weeks by thrombocytopenia and into two to three months by anemia. Recovery is related to the degree of initial response and generally begins with a regeneration of the depleted stem cells. If large volumes of bone marrow have been irradiated, a hypoplastic marrow can persist and occasionally become aplastic. This latter event may be due to cancer infiltrating to the marrow and should be suspected if the depression in blood count does not occur at a predictable time and only if a limited volume of bone marrow has been irradiated. The upper heavy lines represent the course after exposure of large volumes of bone marrow; the lower heavy lines, after localized bone marrow irradiation (Rubin and Casarett 1968)
Studies of radiation effects on marrow were stimulated during the era of atomic bomb development as it was felt important to discover acute and chronic effects of radiation on blood forming elements since this was recognized as one of the crucial determinants of ultimate toxicity. Such studies contributed much to understanding mechanisms of hematopoeisis, the presence of clonal hematopoietic progenitors and stem cells, and provided much of the basic and pre-clinical work which made possible the field of human stem cell transplantation (Hewitt 1973; Walker 1994; Moeller 1978). Biocontinuum of adverse early and late effects are shown in Fig. 1.
2 Anatomy and Histology
2.1 Anatomy
The geographical distribution of the bone marrow (BM) is relevant to understanding radiation effects on the bone marrow compartment (Fig. 2a, b, c). A schematic of bone marrow architecture (redrawn from M. Brooke’s classic work, the blood supply of bone, London: Butterworths; 1971). The nutrient artery penetrates the cortex of bone in an angulated fashion and in the marrow bifurcates into ascending and descending medullary arteries from which radial arteries arise. The radial arteries enter the canalicular system of cortex through the endosteum and become cortical capillaries at which point blood from periosteal and endosteal capillaries can communicate. The cortical capillaries enter the marrow sinuses. The sinuses eventually collect and enter and central sinus from which blood leaves the marrow and enters the systemic venous circulation via emissary veins. Hematopoiesis occurs in the interstitial spaces.
Fig. 2
a A schematic diagram of bone marrow architecture (redrawn from M. Brooke’s classic work, the blood supply of bone, London: Butterworths; 1971). The nutrient artery penetrates the cortex of bone in an angulated fashion and in the marrow bifurcates into ascending and descending medullary arteries from which radial arteries arise. The radial arteries enter the canalicular system of cortex through the endosteum and become cortical capillaries at which point blood from periosteal and endosteal capillaries can communicate. The cortical capillaries enter the marrow sinuses. The sinuses eventually collect and enter and central sinus from which blood leaves the marrow and enters the systemic venous circulation via emissary veins. Hemopoiesis occurs in the interstitial spaces (Reprinted with permission from Lichtman 1981). b The relative amount of red and yellow bone marrow in different anatomic sites as a function of age (based on cortex) (Reprinted with permission from Kricun 1985). c bone marrow distribution in adult humans as determined by autopsy finding: active regions are shaded (Reprinted with permission from Hashimoto 1960)
2.1.1 Geographic Child Distribution
In childhood, bone marrow fills all cancellanous marrow spaces including long bones (Fig. 2b). The transition to adult begins at adolescence when there is accelerated skeletal growth and the involution occurs with recession in long bones except for proximal portions of humerus and femur. The adult marrow tends to be more central in the skull, vertebrae, pelvis, ribs, clavicle, and sternum. Although variations occur, the major functional sites are the pelvis and vertebrae that make up approximately 60 % of the total body marrow. The ribs, sternum, skull, scapulae, and proximal portions of the femur and humerus also contain functioning marrow (Atkinson 1962). In children, the humerus, femur, and other long bones are active, but marrow retraction from the peripheral (appendicular) toward central (axial) skeleton, and from diaphyseal to metaphyseal in individual long bones gradually occurs, so that by age 20 years the mature adult distribution pattern is present (Fig. 2b, c).
2.1.2 Marrow Distribution in Adults
The geographic distribution of the bone marrow is particularly relevant to understanding radiation effects (Fig. 2b, c). Although variations occur, the major functional sites are the pelvis and vertebrae. In the past, this was determined based upon semiquantitative histopathologic studies, but recently, FLT-PET imaging has been utilized to determine marrow distribution (Hayman et al. 2011). In addition to the pelvis and vertebrae, the ribs, sternum, skull, scapulae, and proximal portions of the femur and humerus contain virtually all of the functioning marrow (Hayman et al. 2011). In children, the humerus, femur and other long bones are active, but marrow retraction from the peripheral (appendicular) toward central (axial) skeleton, and from diaphyseal to metaphyseal in individual long bones occurs. By age 20 years, the mature adult distribution pattern is present (Custer and Ahlfedt 1932).
2.2 Histology
Hematopoietic stem cells replicate and differentiate along lymphoid or myeloid lineages regulated by a network of hematopoietic growth factors and cellular interactions (Clark and Kamen 1987; Sieff 1987) (Fig. 3). Families of colony stimulating factors (CSFs) have been identified that control the process of replication and differentiation. Understanding the specific mechanisms of the action and interaction of the different cytokines is only beginning. The hematopoietic system is also dependent on the microenvironment (ME) that consists of endothelial cells, adventitial cells, fibroblasts, macrophages, and fat cells. This ME maintains hematopoietic function in part through the secretion of CSFs and in maintaining cell–cell contact.
Fig. 3
a bone marrow. b: Blood smear. c Formation of blood cells (hemopoiesis) human bone marrow, high magnification (Reprinted with permission from Zhang 1999)
The ME is heterogenous both in its function and anatomic structure. Hematopoiesis takes place in the extravascular spaces between marrow sinuses, which are the channels through which blood flows in the bone marrow (Fig. 3a). These sinuses are the finer branches of a complex vascular network. The arterial blood supply of marrow comes predominantly from the nutrient artery that penetrates the cortex of bone, enters the marrow, and bifurcates into ascending and descending medullary arteries. These give rise to radial arteries that enter the canalicular system of cortex through the endosteum and become cortical capillaries at which point blood from periosteal and endosteal capillaries can communicate. The cortical capillaries enter the marrow sinuses, which eventually leaves the marrow and enters the systemic venous circulation via emissary veins. The resulting interstitial spaces, which are composed of the various stromal cells, make up the hematopoietic ME (Lichtman 1981).
2.2.1 Hemopoietic Tissue and Blood Cells
In the adult body, there are two kinds of hemopoietic tissues: red bone marrow and lymphatic tissue (Fig. 3b, c). The former produces erythrocytes, leukocytes, and platelets, and the latter is the source of lymphocytes. The red bone marrow is composed chiefly of sinusoids and three cell types: reticular cells, adipose cells, and hemopoietic cells (blood-forming cells). Along with reticular fibers (not shown in Fig. 3), the reticular cells, which have ovoid nuclei and several processes, form a framework of reticular tissue in which the hemopoietic cells are contained. Adipose cells are the largest cells in the bone marrow, occupying more and more of the bone marrow cavity with age. Hemopoietic cells differentiate into erythrocytes and leukocytes. They are in different developmental stages, and some of them are seen undergoing mitotic division (in mitosis). In a marrow section, stages of hemopoietic differentiation are difficult to see, but they can be recognized in the bone marrow smear (Zhang 1999).
3 Physiology and Biology
3.1 Physiology
Table 1
Hematopoietic growth factors approved for use by the US Food and Drug Administration with applications in cancer therapy
Hematopoietic growth factor | Generic name | Brand names | Molecular description | Hematopoietic effects | Applications in cancer |
|---|---|---|---|---|---|
EPO | Epoetin alfa | Epogen, Procrit | rHu EPO | Red cell lineage | Chemotherapy-induced anemia in nonmyeloid malignancies |
Darbepoetin | Aranesp | rHu EPO with altered glycosylation | Red cell lineage | Chemotherapy-induced anemia in nonmyeloid malignancies | |
G-CSF | Filgrastim | Neupogen | rHu G-CSF | Neutrophil lineage | Reduce febrile neutropenia in patients receiving myelosuppressive chemotherapy; reduce duration of neutropenia after bone marrow transplantation, mobilize progenitor cells |
Pegfilgrastim | Neulasta | Pegylated rHu G-CSF | Neutrophil lineage | Reduce febrile neutropenia in patients receiving myelosuppressive chemotherapy | |
GM-CSF | Sargramostim | Leukine | rHu GM-CSF | Myeloid lineage | Reduce duration of neutropenia after bone marrow transplantation; mobilize progenitor cells |
IL-11 | Oprelvekin | Neumega | rHu IL-11 | Megakaryocytes | Treatment of chemotherapy-associated thrombocytopenia |
3.1.1 Stages of Development
The formation of the hematopoietic cells of bone marrow are in different stages of development from both the erythrocytic series and the granulocytic series. The erythrocytic series contains the proerythroblast, basophilic erythroblast, polychromatophilic erythroblast, orthochromatophilic erythroblast, and reticulocyte; the granulocytic series contains the myelocytes and metamyelocytes. These cells are drawn from a human bone marrow smear stained by the Wright method. The characteristic features of these cell types are briefly described (Zhang 1999) (Fig. 3c).
3.1.2 Erythrocytic Series
Proerythroblast is the earliest cell recognizable in the development of the erythrocyte (20 μm).
Basophilic erythroblast shows a reduction in size (15–17 μm in diameter).
Polychromatophilic erythroblast is formed by mitotic division of a basophilic erythroblast. It becomes smaller (12–15 μm in diameter) than the basophilic erythroblast, and the chromatin of the nucleus becomes more condensed.
Orthochromatophilic erythroblast (normoblast) continues to decrease in size, measuring 8–10 μm in diameter.
Reticulocyte, an immature erythrocyte, is an anuclear round cell with a diameter of 9 μm.
3.1.3 Granulocytic Series
Myeloblast is the earliest cell recognizable in the granulocytic series.
Promyelocyte, the largest cell in the granulocytic series, measures 19–24 μm in diameter.
Myelocytes are smaller than promyelocytes, 16–20 μm in diameter.
Metamyelocytes continue to decrease in size (about 8–12 μm in diameter).
3.2 Biology of Hematopoiesis (Family of Growth Factors)
The pluripotent stem cell replicates and differentiates along lymphoid or myeloid lineages through a complicated process regulated by a network of hematopoietic growth factors and cellular interactions (Clark and Kamen 1987; Sieff 1987; Abboud and Lichtman (2006). (Fig. 4 and Table 1). The cascade through myeloid differentiation leads to erythrocytes, platelets, granulocytes, and macrophages, and the lymphoid cascade to T and B cells (Fig. 4 and Table 1). Families of growth factors (or cytokines) that control these processes of replication and differentiation have been identified. The hematopoietic progenitor cells and their offspring are cradled on a stroma of endothelial cells, adventitial cells, fibroblasts, macrophages, and fat cells within the bone marrow. This ME is both supportive and directive in the developmental and replicative processes and is also affected by radiation. Not only do the stromal elements respond to and secrete growth factors, but the geometric niches formed by the stroma maintain cell-to-cell contact of progenitors and their offspring. Mesenchymal stem cells are able to constitute the marrow stromal elements (Bonnet 2002) including osteoblast, smooth muscle, chondrocyte, and adipocyte lineages (Wolf et al. 2003). Recently, interleukin-6 has been found to be important in regulation of stromal function. In murine models, the percentage of Lin-SCA-1+ hematopoietic progenitors undergoing DNA synthesis is diminished in IL-6 deficient bone marrow. This defect is also observed in long-term bone marrow cultures (Rodriguez et al. 2003). How growth factor production by stromal layers changes during periods of chemotherapy and radiation—induced toxicity is only beginning to be defined.
Fig. 4
Growth factors: schematic representation of hematopoiesis with surface antigen markers displayed. CD90, Thy-1; CD123, IL3Ralpha; CD117, c-kit; CD135, FLK2/FLT2; CD80, B7-1; CD86, B7-2; CD64, FcR1; CD16, FcRIII; CFU, colony-forming unit; GEMM, granulocyte/erythroid/macrophage/megakaryocyte; GM, granulocyte/macrophage; HLA, human leukocyte antigen; LAP, leukocyte alkaline phosphatase (Reprinted with permission from Devita 2008)
3.2.1 Composition of Microenvironment (Niches)
Recently, both vascular and osteoblastic niches have been described in the murine marrow microenvironment. Whether such distinct niches are operative in human marrow is uncertain as direct studies of microenvironmental function are more difficult in humans. Hematopoietic stem cells are found in close proximity to osteoblasts which are affected by parathyroid/parathyroid receptor interactions. When murine stroma is treated with parathyroid hormone, it secretes increased stem cell factor (SCF, c-kit ligand), stroma derived factor (SDF)-1 alpha/CXCL12, and IL-6. Long-term culture initiating cells and hematopoietic stem cells are also increased (Calvi et al. 2003). C-terminal PTH also increases vascular endothelial growth factor expression in osteoblastic cells (Esbrit et al. 2000), which could also impact hematopoiesis. These effects can be blocked with gamma-secretase inhibitors, suggesting that Notch and its ligands, Delta and Jagged, play a role in PTH effects (Weber et al. 2006). An interesting laboratory study that supports stromal contribution was the observation of past radiation of the lower extremity that iron uptake increased at 3 months, however, the bone marrow was ablated histologically. A radioautograph of the tibia revealed the iron was concentrated in the bone cortex in 3 months. Over the next 3 months the bone marrow regenerated as a sleeve juxta-opposed to the cortex before following the entire bone marrow cortex (Rubin et al. 1997).
Human marrow stroma contains pluripotent mesenchymal progenitor cells that give rise to many mesenchymal lineages, including chondroblasts, adipocytes, myoblasts, ligament, tendon, or osteoblasts. The differentiation of these cells toward a specific lineage is dependent on humoral and local factors activating specific transcription factors. The family of transforming growth factors, for example, may promote osteoblast differentiation and inhibit adipocyte conversion of rat marrow stromal cells in vivo (Ahdjoudj et al. 2004). The role that angiogenesis plays in marrow toxicity from chemotherapy and radiation is just beginning to be understood. Increased microvessel density in marrow of multiple myeloma, acute lymphoblastic leukemia, acute myeloid leukemia, myelodysplasia, and myeloproliferative disorders is well-described. Targeting these vessels with anti-angiogenesis agents will influence the nutrient and oxygen supply of tumors and may also reduce the growth stimuli provided by the endothelial cells. How angiogenesis protects or sensitizes to chemotherapy and radiation toxicity and effectiveness remains an area of active investigation (DeRaeve et al. 2004).
4 Pathophysiology
4.1 Histopathologic Sequence
Bone marrow dysfunction in the setting of cancer therapy has several possible etiologies (Gale 1985) (Fig. 5a, b, c, d, e and Table 2).
Fig. 5
a Normal state: note ratio of hematopoietic cells to fat cell (adipose). b Hemopoietic system: Diagrammatic representation of key events of early injury of bone marrow after a single dose in the midlethal range. A Normal state; note the ratio of fat to hemopoietic elements. B Period of marked necrosis; the marrow is hypocellular, and many residual cells are nonviable. The macrophages have phagocytized remnants of necrotic cells. C Marked hypocellularity; the marrow is markedly hypocellular, with few if any identifiable hematopoietic elements. D Early regeneration; numerous mitoses are apparent, and most hematopoietic cells are immature (White 1975). Normal human bone marrow aged individual. Note the ratios of fat cells to hematopoietic precursors. High power, H&E, ×480. (Reprinted from Bonnet 2002 with permission form the American Journal of Neurogical pathology)c Vertebral bone marrow 24 days after initiation of local radiotherapy for mediastinal neoplasm. The total fractionated dose received up to the day of death was 26.9 Gy. Note the almost complete absence of normal hematopoietic elements. Residual cells consist primarily of plasma cells, macrophages, stromal cells, and neutrophils. Also note the large, dilated sinus occupying most of the upper field. H&E, ×480. d Hypoplastic bone marrow more than 12 months after local radiotherapy with fractionated dose >50 Gy. Note small foci of hematopoiesis. H&E, ×80. e Aplastic bone marrow more than 12 months after local radiotherapy with a fractionated dose >50 Gy. Bone marrow consists of adipose tissue with complete absence of hematopoietic activity. H&E ×120
Table 2
Histologic alterations at indicated times after initiation of fractionated local radiotherapy in humans
Fractionated exposures | ||
|---|---|---|
Total dose (R) | Time | Morphologic alterations |
400 | 3 days | Moderate decrement in precursor cells |
1000 | 8 days | Absence of precursor cells, dilated sinusoids, acute hemorrhage |
2000 | 16 days | Marked decrement of all hematopoietic precursors, dilated sinusoids |
5000+ | 35 days | Nearly complete absence of hematopoietic precursors, sinusoids less dilated |
5000+ | 3–12 months | Continued nearly complete hypoplasia; abortive recovery followed by progressive hypoplasia may occur |
1.
Direct injury to hematopoietic stem cells or their depletion.
2.
Structural or functional damage to the stroma or microcirculation.
3.
Injury to other accessory cells which have regulatory (cytokine-secreting) functions.
4.
Perturbation of bone marrow functions by the underlying disease (e.g., leukemia).
5.
An inherent defect in bone marrow stem cells associated with the underlying disease.
These various injuries translate into a disturbance in the production and release of growth factors, and in the finely tuned cell-to-cell interactions important for marrow functioning. Thus, the regulation or process of hematopoiesis is disrupted. The precise mechanism of radiation damage to marrow is not yet clear; both apoptosis and necrosis can occur in different settings (Peng et al. 1999). Radiation results in increased macrophage activation with increased lysosomal and nitric oxide synthase enzyme activities. This results in increased respiratory burst activities and a neutrophil infiltration which results in clearance of radiation-induced apoptotic cells. These infiltrative and apoptotic cells may damage other cells by bystander effects, thus contributing to induced genomic instability. That mitochondrial generation of toxic radical oxygen species is important in radioresistance, and radiotoxicity has been demonstrated in nitric oxide deficient mice in which radioresistance and improved hematopoiesis in continuous marrow cultures was noted as compared to that in wild type mice (Epperly et al. 2007). Levels of certain cytokines may also influence response to radiation. For example, TGF-β1 transgenic mice are more sensitive to radiation than controls in terms of marrow suppression (Vodovotz et al. 2000). This has relevance in that TGF-β is elevated in some tumor states. After radiation to marrow, the alkaline phosphatase network increases in advance of hematopoietic recovery and then recedes once blood production is restored from a given marrow site (Almohamad et al. 2003).
Morphologic appearance of bone marrow after radiation is dependent on a variety of radiation dose, time, fractionation and volume, but generally follows this sequence: (Fig. 5a, b, c, d, e)
Figure 5a: Normal State: note ratio of hematopoietic cells to fat cell (adipose)
Figure 5b: Marked necrosis
Figure 5c: Marked hypocellularity
Figure 5d: Early regeneration
Figure 5e: Fatty replacement although occasional deposition of reticulin, fibrosis does not occur in bone marrow after radiation.
The only exception relates to irradiated metastasis which replaced marrow or pre-existing myeloproliferative disease, in both of which reticular collagen deposition can occur.
4.2 Histologic Alternations as a Function of Dose/Time
The histopathology during a fractionated course of radiation treatment with a standard schedule of 200 cGy daily fraction, 1000 cGy/wk to 5000 cGy is noted in Table 2.
5 Clinical Syndromes (Endpoints)
Depression of each hematopoietic cell lineage translates into potential or observed difficulties for the patient (Table 3). The definitions of granulocytopenia, thrombocytopenia, and anemia are all somewhat arbitrary and appropriately operational in nature. LENT/SOMA1995 tables define grade of radiotoxicity (Table 3) (LENT SOMA 1995).
Grade 1 | Grade 2 | Grade 3 | Grade 4 | |
|---|---|---|---|---|
Subjective | ||||
Anemia symptoms Leukopenia symptoms Thrombocytopenia symptoms | Fatigue | Exhaustion Fever Easy bruisability | Spontaneous bleeding | |
Objective | ||||
Anemia Leukopenia Thrombocytopenia | Abnormal aspirate/biopsy | Abnormal Hgb/Hd <10 / <30 Abnormal WBC <2000 Platelets >20–I00 K | Pallor Infection Platelets >5–20 K, petechia | Tachypnea Sepsis Platelets <5 K. hemorrhage |
Management | ||||
Anemia Leukopenia Thrombocytopenia | Occasional use of red blood products Antibiotics/cytokines Platelets/red blood cells | Frequent use of red blood products bone marrow transplant | ||
Analytic | ||||
Assays | Assessment of bone marrow reserves with: Hematopoietic progenitor cell assays in common use (CFU-GM, BFU-E1, CFU-GEMM, CFU-blast etc.) Stromal cell assays (CRU-F, support of long-term bone marrow cultures) Growth factor production Primitive stem cell assays (HPP-CFC, CFU-Dexter, LTC-1C, somatic mutation analysis/DNA analysis) | |||
Chimerism, clonality | In setting of bone marrow transplant (studies of mixed (donor/host) chimerism, studies of clonality (donor vs. host)) Future consideration: challenge with growth factors to assay stem cell reserve | |||
5.1 Detection
5.1.1 Complete Blood Counts: Local Field, Standard Fractionation
Although the alterations in Complete Blood Counts (CBCs) occur with most regionally localized cancers (brain tumors, head and neck cancers, lung and breast cancer, digestive tract, gland cancers, pelvic malignancies such as prostate and cervix), multiple factors including combined modality treatment, associated bleeding, and suppression of CBC elements occur (Fig. 6a). Figure 6a illustrates the classic figure of peripheral blood elements being depressed from time of total body irradiation (TBI) with variations depending on the dose and volume of bone marrow irradiated.
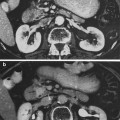
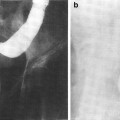
Fig. 6
a Expected hematologic response in a human following a single total body dose of 4.5 Gy (with permission from Andrews 1967). b Bone marrow distribution in adult humans as determined by 18F-flurodeoxythymidine (FDT), PET in adult cancer patients. (with permission from Hayman et al. 2011; Hashimoto 1960)
5.1.2 Severely Granulocytopenic
Severely granulocytopenic (or neutropenic) patients are generally considered to be those with an absolute granulocyte count (consisting of poly-morphonuclear cells and band forms) of 500/μL or less. These patients are at substantial risk for infection (David 2003). Counts between 500 and 1000/μL and declining due to antineoplastic therapy are considered by most oncologists to represent moderately severe neutropenia. Most patients clinically tolerate granulocyte counts between 1000 and 1500/μL.
5.1.3 Thrombocytopenia
Thrombocytopenia has been strictly defined as a platelet count below 140000/μL, but the manifestations of bruising, petechiae, and mucosal bleeding rarely occur with counts of 100000/μL or above, and in fact are infrequent unless counts fall below 20000/μL (Beutler 1993). Intracranial hemorrhage is particularly rare, and most episodes occur at counts less than 10000/μL.
5.1.4 Anemia
Anemia prompting red blood cell transfusion is even more difficult to define because various clinical judgments are used. In practice, hematocrits as low as 23–25 % are tolerated by most patients. Those with cardiorespiratory difficulties may not tolerate hematocrits below 30 %.
As noted above, chronic marrow injury following cytotoxic therapy is poorly understood. The hematopoietic system appears to recover promptly after sub-ablative doses of chemotherapy and radiotherapy. However, heavily treated patients are known to have a reduced tolerance to additional therapy, showing lower nadirs of peripheral counts, particularly platelets. Decreased marrow functioning as reflected by marrow scanning after radiotherapy (Rubin et al. 1988; Rubin et al. 1973), or the CFU-GM pool after chemotherapy (Lohrmann and Schremi 1988) has been demonstrated up to 5 years following therapy. Hypoplastic and myelodysplastic syndromes have been observed at late intervals, but may represent a mutagenic or carcinogenic event.
5.2 Diagnosis
5.2.1 Bone marrow Assessments
The acute and chronic consequences of bone marrow injury by cytotoxic therapy can be considered in the context of these mechanisms. However, dissecting out the most relevant variables can be difficult due to limitations in the assessment of structure and function. Peripheral blood counts fail to demonstrate the true extent of marrow suppression or its likelihood of tolerating additional cytotoxic therapy because of the ability for the bone marrow to transiently compensate for injury. Progenitor cell cultures (Table 4) such as colony-forming units for granulocytes, macrophages (CFU-GM), burst-forming units for erythrocytes (BFU-E), colony-forming units for granulocytes, erythrocytes, macrophages, megakaryocytes (CFU-GEMM); histopathology (bone marrow aspirate and biopsy), radioisotopic scanning (111In 52Fe, 99mTc-sulfur colloid reflecting the myeloid, erythroid, and reticuloendothelial compartments respectively); and stromal cell cultures such as colony-forming units for fibroblasts (CFU-F), are all used to evaluate various quantitative or functional aspects of the bone marrow but are all limited in scope. The long-term culture initiating cell assay and the NOD-SCID reconstituting cell assay can measure early multipotential progenitor cells (Bonnet 2003). Most of these assays are not helpful in real time as most except for peripheral blood counts take weeks to conduct and analyze. Levels of Flt3 ligand in plasma have been postulated to serve as a bio-indicator for radiation-induced aplasia (Bertho et al. 2001). There are some reports that nuclear magnetic resonance imaging may be useful to assess marrow damage from chemotherapy and radiation (Ollivier et al. 2006), and some of these changes may mimic metastases, so caution is advised in their interpretation in settings of malignancy since paratrabecular fibrosis and inflammatory cell infiltration after radiation can generate a T1 hypointense/T2 hyperintense signal on MRI (Kanberoglu et al. 2001). Studies of the use of positron emission tomography are also being evaluated as means to assess marrow function and health (Table 4) (Hayman et al. 2011).
Primitive stem cell assays | |
1 | HPP-CFC or high proliferative potential colony-forming unit culture assay |
2 | CFU-Dexter culture assay |
3 | LTC-IC, long-term culture initiating cell assay |
4 | Somatic mutation analysis/DNA analysis (strand breaks, translocation) |
5 | Stem cells in SCID mice |
6 | Challenge with growth factors to assay stem cell reserve (in vivo) |
Stromal cell assays | |
7 | Fibroblast colony-forming unit (CFU-F) |
8 | Support of long-term bone marrow cultures |
9 | Growth factor production |
Furthermore, the ability of all these assays to demonstrate irradiation effects is particularly marginal because of volume and dose considerations. Small segments or large compartments of previously active marrow may become aplastic, hypoplastic, or hyperplastic, and previously quiescent areas may become active (Rubin and Scarantino 1978). Finally, chronic marrow damage from cytotoxic therapy depends on stromal or stem cell defects resulting from the underlying malignancy (e.g., leukemia) or the specific cytotoxic agents used. Normal numbers of mature hematopoietic cells probably result from an increase in stem cell cycling with amplification, and the long-term capacity for normal marrow to function or to respond to stress is not immediately apparent (Testa et al. 1985). Nevertheless, our current understanding of bone marrow damage following cytotoxic therapy is based on the aforementioned evaluations.
Another consideration in ultimate marrow damage from radiation is that as stem cells replicate through life, their telomere length is shortened. It has been noted that elevated telomerase activity and minimal telomere loss occur in cord blood during long-term cultures, but adult CD34+ cells show SCID reconstitution capacity for only 3–4 weeks with telomere shortening and low levels of telomerase (Weisel KC et al. 2004). Therefore, age at which stem cells are exposed to radiation or chemotherapy may determine extent of effect on long-term proliferation potential (Goytisolo et al. 2000). There is also interest in understanding how the timing of radiation and chemotherapy treatments relates to host circadian rhythmicity and how this might affect the toxic/therapeutic ratio (Haus 2002). Circadian variation exits in the proliferative activity of acute-reacting normal tissues like the gut and bone marrow, and a potential therapeutic gain can be realized by the chronomodulated administration of S-phase chemotherapeutic agents at a time when normal tissues are in a different cell cycle phase and may be spared (Rich et al. 2002).
Historically, it was thought that high doses of chemotherapy or radiation were required to create space for donor hematopoietic cells in allogeneic transplant situations. Recently, it has been shown that with non-myeloablative regimens, complete donor engraftment may occur. This would suggest that in cases where sufficient immune suppression allows ongoing presence of the graft, the emergence of stem cells may be based on cell cycle or other proliferative advantage as compared to a true hierarchical system (Giralt 2003).
It is not yet certain how acute versus low-dose chronic exposures differentially affect human marrow. Chromosomal painting studies in radiation workers exposed to plutonium had high frequencies or structural aberrancies with high exposures which correlated with marrow dose but not external dose. These aberrations could remain stable for decades after intake suggesting that chronic irradiation of hematopoietic precursors in marrow induced cytogenetically altered cells that persisted in blood (Livingston et al. 2006). There is also some evidence that a single exposure to a low dose of radiation might induce long-term damage with more apoptotic cells in marrow compartments 6 months after exposure than in control mice and in mice irradiated with higher doses. Marrow from mice with exposure to low doses was also more sensitive to extra in vitro irradiation (Giovanetti et al. 2003).
In humans, late effects of radiation on the hematopoietic system have been incompletely studied. Wong et al. reported long-term effects of radiation exposure on hemoglobin levels in Japanese atomic bomb survivors over a 40-year period for 1958–1998 who were estimated to have a 1 Gy marrow dose. These individuals had lower hemoglobin levels than controls at age 40 and age 80 (Wong et al. 2005). In children who were less than 6 years of age at the time of the Chernobyl accident and were followed from 1986 to 2000, a significant increase in leukemia risk was seen but all had <10 mGy to bone and most lived in the Ukraine away from the epicenter suggesting that prolonged exposure to very low radiation doses may increase leukemia risk as much as or even more than acute exposure (David 2003).
5.3 Imaging
5.3.1 Radioisotope Scans
Radioisotope Scans (RIS) provide a means of dynamically assessing bone anatomically as well as functionally; and with serial RIS the status of HBM can be reassessed over time longitudinally from initial suppression to eventual regeneration and compensatory expansion to ablation. Invivo/invitro allows labeling of different compartments i.e., myeloid (111In) erythroid (Fe52) and reticuloendothelial (99MTc) (Fig. 6b). Bone marrow distribution is often determined utilizing 18F-flurodeoxythymidine (FDT), PET scans.
5.3.2 MRI Versus CT
MRI is preferable to CT for visualized bone marrow and the reverse is true for imaging cortical and cancellous bone. MRI can assess replacement of fat for radiation or chemotoxic ablation of HBM which is normal in bone architecture. The MRI appearance of the acute response of bone marrow to radiation injury is very similar to the changes seen after chemotherapy. Within a few days, tissue edema leads to a drop in signal intensity of T1-weighted images. The edema is then replaced by fatty transformation, which is seen as an increase in T1 signal intensity. Unlike the changes after radiation injury, however, bone marrow changes after chemotherapy are temporary. After 3–4 weeks, with reseeding of the hematopoietic red marrow, the MRI appearance of bone marrow returns to its normal low signal intensity on T1-weighted images (Husband and Reznek 1998). Unlike other normal tissue postradiation which undergoes late fibrosis, bone marrow is the only tissue to be replaced by fat, adipose cells.
6 Radiation Tolerance and Radiation Toxicity to Marrow
The bone marrow is extremely radiosensitive to the degree that some injury is produced by any fractional dose. Peripheral blood cell counts acutely and progressively decrease in number due to the destruction of both mature and progenitor cells.
6.1 Dose-Time Fractionation
The pathophysiology of HBM response to fractionated radiation has been addressed in the pathophysiology Sect. 4, and serves as a basis to understand the radiation factors that determine the sequence of clinical events which again reflects the kinetics of bone marrow cell production, maturation, egress, and longevity, as well as the bone marrow reserve (Fig. 7a and Table 5). Lymphopenia occurs almost immediately after even modest radiation doses because these cells are exquisitely sensitive and die in interphase. After 3000–4000 cGy to large bone marrow volumes, neutropenia occurs in the first week, followed by thrombocytopenia in 2–3 weeks and anemia in 2–3 months (Table 5). Early recognition of this sensitivity prompted investigations to characterize the morphologic and functional consequences of marrow irradiation. Knopse et al. performed animal studies with single irradiation doses and demonstrated a rapid loss of cellularity with sinusoidal dilatation (1–4 days), immediately followed by an increasing deposition of fat and collagen (by 14 days). By 3 months, fibrosis and fatty replacement obliterated the marrow cavity. Hematopoietic and sinusoidal regeneration occurred between 6 and 12 months only at the lower doses (Knopse et al. 1966). Rubin demonstrated that, within 2 weeks following irradiation of rabbit marrow, there is a dose-related depletion of bone marrow cells (Rubin 1973). Studies in humans performed by Sykes et al. actually preceded much of the animal experimentation, and revealed consistent data (Sykes et al. 1964). A sequence of histologic alterations occurred due to the accumulation of radiation doses administered in successive fractions:
Fig. 7
a Dose-time fractionation: effects on likelihood of bone marrow regeneration. Variable factors in response and recovery; bone marrow. Effects of varying doses of radiation upon sternel-marrow regeneration. (From Sykes et al. 1964). b Pattern of bone marrow regeneration and extension in Hodgkin’s disease patients (after total nodal irradiation) as determined by 99mTc-S colloid. Reprinted with permission from Epperly et al. (2003). c Dose-volume histogram for in-field bone marrow hypoplasia, illustrating the relationship between volume and tolerance and doses. A different dose-volume histogram would be required for other end points, for example, peripheral cell counts suppression. d Survival of hematopoietic and stromal progenitor cells after doses of low LET radiation (usually gamma rays): (——) mouse; (- – -) human; (…) dog. CFU–F colony-forming units for fibroblasts; GM–CFC colony-forming units for granulocytes-macrophages; CFU–S spleen colony-forming units; BFU–E burst-forming units for erythrocytes; CFU–M colony-forming units for macrophages; CFU–E colony-forming units for erythrocytes from (Hendry 1985). e Radiosensitivity of the marrow stroma using different assays. A loss of sinusoids at 1 year; Loria et al. 2000: CFU-F after in vivo irradiation (420 cGy/min.); B2 CFU-F after in vitro irradiation, B3 CFU-F after in vivo low-dose rate (1.4 cGy/min.) irradiation, C1 and C2: CFU-S in kidney implants using 400 and 160 cGy/min, respectively; D CFU-S and GM-CFC and CFU-F content in subcutaneous femur implants; El nonadherent CFU-S in type I long-term bone marrow cultures after 7 weeks; E2 and E3 nonadherent and adherent CFU-S in type II long-term bone marrow cultures after 5 weeks. From Bierkens et al. (1989), Pergamon Press Ltd
Table 5
Radiation Tolerance
Histologic alterations at indicated times after initiation of fractionated local radiotherapy in humans | ||
|---|---|---|
Fractionated Exposures | ||
Total dose (R) | Time | Morphologic alterations |
400 | 3 days | Moderate decrement in precursor cells |
1000 | 8 days | Absence of precursor cells, dilated sinusoids, acute hemorrhage |
2000 | 16 days | Marked decrement of all hematopoietic precursors, dilated sinusoids |
5000+ | 35 days | Nearly complete absence of hematopoietic precursors, sinusoids less dilated |
5000+ | 3–12 months | Continued nearly complete hypoplasia; abortive recovery followed by progressive hypoplasia may occur |
Sykes data were obtained and presented using the original irradiation unit of R or roentgen, and not in centigray (cGy) as indicated (Fig. 7a).
1.
At 3 days (400 cGy), there was a moderate decrease in nucleated cells, especially red cell and granulocyte precursors.
2.
At 8 days (1000 cGy), there was dilatation of sinusoids with hemorrhage, and an absence of young hematopoietic precursors.
3.
At 16 days (2000 cGy), the cellularity (nucleated) had decreased to 20 %.
4.
At 35 days (5000 cGy-end of therapy), hypoplasia is extreme and fat has accumulated, but sinusoids are less dilated.
5.
At 3 months, 50 % of patients show a reappearance of the young hematopoietic cells but cellularity is still reduced.
6.
At 5–12 months, recovery continues in some patients, but others show a second irreversible picture of marrow depression with limited cellularity and/or fibrosis.
6.2 Dose-Volume Histogram
The radiation dose, dose rate, and treatment volume all affect the acute response of the bone marrow to therapy (Fig. 7b, c, d, e). Although the complex compensatory mechanisms of the marrow are primarily relevant to understanding chronic radiation effects (discussed in the next section), some come into play acutely. When small fields comprising only 10–15 % of the bone marrow are irradiated, the unexposed bone marrow responds by increasing its population of progenitor cells (Rubin et al. 1984; Scarantino et al. 1984; Croizat et al. 1976; Bierkens et al. 1989; Gualtieri et al. 1984; Song and Quesenberry 1984; Naparstek et al. 1985; Alberico et al. 1987; Gualtieri 1987; Greenberger et al. 1984; Naparstek et al. 1986a; Naparstek et al. 1986b; Naparstek et al. 1986c; Knopse 1988; Parmentier et al. 1988). Often the bone marrow organ fails to regenerate the small irradiated portion of marrow because the compensatory process is able to meet the demands for hematopoiesis. Thus, acute effects are not seen. Conversely, exposures to larger but less than total body fields are associated with peripheral blood count depressions in the sequence previously noted. Figure 7b shows the pattern of bone marrow regeneration and extension in a patient irradiated for Hodgkin Lymphoma with total nodal fields. Figure 7c shows a dose-volume histogram depiction of the percentage bone marrow hypoplasia as a function of the dose and volume that were irradiated.
Greater understanding of these phenomena is provided by studies of the effects of irradiation on the release of growth factors from the marrow stroma (Fig. 7d, e). In mice, the CFU-Ss decrease in the shielded areas of bone marrow soon after irradiation, probably due to stem cell differentiation and cell migration to other regions of the body. Within a few more hours, the unirradiated stem cells are triggered into proliferation. Humoral (growth) factors probably mediate these events (Scarantino et al. 1984; Croizat et al. 1976). Most frequently, the measurable growth factor concentration is positively correlated with radiation dose and negatively correlated with the relative number of mature hematopoietic cells. Other explanations for the appearance of these factors include radiation-induced elimination of an inhibitory cell population of hematopoietic cells that would otherwise internalize such factors. Conflicting data on the identification of such growth factors induced by irradiation probably relate to the different cell targets and assay systems tested. The autocrine, paracrine, and endocrine effects of the release of growth factors remain under investigation.
6.2.1 Compensatory Hematopoietic Bone Marrow Response to Volume Loss Due to Radiation Treatment (Chronic Toxicity From Radiation Therapy)
If the appropriate assay is used, residual effects of all but the lowest doses of radiation therapy can be detected; their clinical importance, however, varies according to the fascinating capacity of the bone marrow to sense and compensate for such injury (Fig. 7d, e and Table 6). An appreciation of the extensive communication network that apparently exists in this organ is necessary to understand the patterns of bone marrow function following radiation therapy:
Table 6
Bone marrow regeneration (BMR) patterns and compensatory mechanisms
Regeneration | Doses (cGy) | |||||
|---|---|---|---|---|---|---|
Techniques (irradiation) | Exposed | Unexposed | Extension | Non-exposed marrow activity | Daily | Total |
Bone Marrow | Bone Marrow | |||||
Small field | N | Local-regional BMR | N | □ | 200 | >4000 |
Large field | N | N | □ | 200 | >3000 | |
Subtotal body | Suppressed BMR which then recovers | Generalized BMR | □□ | □ | 200 | 4000 |
Total body | Active | Generalized BMR | N | 5–10 | > 100 | |
1.
Regeneration within the irradiated field
2.
Hyperactivity in non-irradiated regions
3.
Extension of function into previously quiescent regions
4.
Extramedullary hematopoiesis.
The contrasting radiosensitivities of the bone marrow stroma and hematopoietic stem cells, and the elaboration of growth factors following irradiation, underlie the mechanisms for compensation of damage. Early investigations in mice by Fried et al. demonstrated that the stromal cells supporting hematopoietic regeneration were more radioresistant than the CFU-S; single whole-body doses of 500 cGy or less did not consistently affect the ME but destroyed more than 99 % of CFU-S (Fried et al. 1976). The stroma both proliferates and supports hematopoiesis, and these capacities are diverse in their radiosensitivity. Low single doses of less than 600 cGy can prevent the establishment of a stromal layer in long-term culture systems (Laver et al. 1986) and prevent stromal cell proliferation (Zuckerman et al. 1985). Conversely, greater than 10000 cGy to an established stroma are tolerated in terms of the ability to produce growth factors (Zuckerman et al. 1985; Gualtieri and McGraw 1985), or support hematopoietic progenitor cell proliferation and adherence (Zuckerman et al. 1985). The influence of dose fractionation and rate is also relevant because of the contrasting ability of the stromal and hematopoietic precursors to repair damage. In vitro studies by Laver provide Do values of 130 and 115 cGy for CFU-F and CFU-GM respectively; however, the CFU-F survival curve exhibits a shoulder (n = 1.3), whereas the CFU-GM curve does not (n = 1.0) (Laver et al. 1986).* Similar DO values for CFU-S and other progenitors have been demonstrated by Hendry (Fig. 7d) (Hendry 1985). Various survival curves have been demonstrated for the stroma, apparently dependent on the assay used (Fig. 7e) (Bierkens et al. 1989). Greenberger et al. have shown the relevance of low (5 cGy/min) and high (120 cGy/min) dose rates to several parameters of marrow stromal cell support function for engrafted hematopoietic stem cells (Greenberger et al. 1988). Conversely, the radiosensitivity of multipotential stem cells is independent of dose rate (Hendry). The understanding of these data must await further investigate because of the demonstrated differences between the ability for marrow stroma to regenerate and repair damage when assayed in vitro versus in vivo (Chertkov et al. 1983; Knopse and Husseini 1986).
A cascade of direct and indirect responses of both irradiated and unirradiated bone marrow regions underlies the patterns of marrow activity observed after therapy. On the most basic level, the individual radiosensitivities of the ME and hematopoietic stem cells determine the potential for any locally irradiated region to maintain function. On a higher level, the interactive capabilities of treated and untreated bone marrow volumes determine the potential for the organism to sustain radiation injury. Table 6 is an attempt to categorize what must be a continuum of events in this regard.
1.
When a small field with less than 10–15 % of the bone marrow organ is irradiated beyond (fractionated) total doses of 3000 cGy or single doses of 2000 cGy, permanent ablation or hypoplasia occurs. The capacity of the unexposed bone marrow to compensate by accelerating its rate of hematopoiesis is sufficient, obviating the need for in-field regeneration.