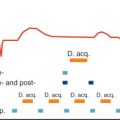
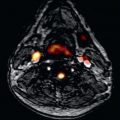
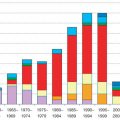
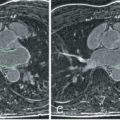
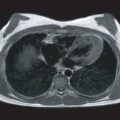
Cardiovascular magnetic resonance (CMR) exploits the inherent difference between tissues in their configuration of atoms by generating differing signals—the fundamental tissue properties T1, T2, and T2*. Whereas differences in these parameters had to be previously visualized by weighted sequences, they can now be measured in a single breath-hold with T1, T2, or T2* displayed as pixel maps where each color-coded pixel carries the absolute value. Furthermore, if T1 is measured before and after contrast, the myocardial extracellular volume (ECV) is mapped, representing the percentage of tissue that is extracellular water, a surrogate for the process holding water, be it fibrosis, amyloid, or edema. In turn, T2 mapping is a highly attractive technique for characterization of myocardial tissue in the disease state accompanied by inflammation. T1, T2, and ECV change in disease, each being differentially sensitive to pathologic processes ( Fig. 32.1 ). The technique potential is best considered in rare (infiltrations), common (edema), and ubiquitous (diffuse fibrosis) disease processes.

Tissue Characterization: Moving Beyond Late Gadolinium Enhancement
The key single technique that stimulated the greater adoption of CMR into routine clinical practice was scar imaging. The late gadolinium enhancement (LGE) technique was first used in infarction, but it has proved to be reproducible and robust enough for use in a multicenter clinical trial, and it has established itself as the gold standard method in both ischemic and nonischemic heart diseases, including cardiomyopathy, myocarditis, aortic stenosis-induced pressure-overload hypertrophy, and infiltrative diseases. However, LGE is a difference test between normal and abnormal myocardium, and therefore is not able to characterize and quantify diffuse myocardial disease or inform on how nonscarred areas are adapting to the increased workload or whether they are at risk of generating new scar. There are many pathways active in normal myocardium, and these change with different pathologic processes. Each parameter may be differently sensitive to these. Multiparametric tissue characterization is therefore an attractive strategy for noninvasive “biopsy” and “whole heart” sampling, avoiding potential morbidity and mortality of actual biopsy.
Histologic Validation of T1, T2, and Extracellular Volume
Extracellular tracers for measuring the interstitium were first described in the 1960s. In the 1970s, Poole-Wilson et al. used 51 Cr-EDTA in an ex vivo heart model with photographic paper to measure the myocardial extracellular volume. Early in vitro work by Kehr et al. on human myocardium obtained postmortem compared T1 values, calculated from the inversion recovery signal curves, with collagen volume fraction, determined by the picrosirius red method, and showed a significant correlation between the two methods. In 2010, Flett et al. developed an at equilibrium extracellular volume technique and validated it in patients with severe aortic stenosis and hypertrophic cardiomyopathy (HCM). The ECV showed a high correlation with the collagen volume fraction of biopsies obtained intraoperatively in this cohort. This work has been replicated in transplant hearts, shorter protocols, and with newer, faster T1 mapping sequences ( Tables 32.1 and 32.2 ).
| Reference | Year | Population | N | Parameter | Sequence |
|---|---|---|---|---|---|
| Iles et al. | 2008 | DCM | 25 | Postcontrast T1 | 1.5 T; IR VAST |
| Flett et al. | 2010 | AS/HCM | 26 | ECV | 1.5 T; EQ-CMR; multibreath-hold FLASH IR |
| Sibley et al. | 2012 | DCM/IHD/HCM/amyloid | 47 | Postcontrast T1 | 1.5 T, IR Look-Locker |
| Mascherbauer et al. | 2013 | HFpEF | 9 | Postcontrast T1 | 1.5 T, IR FLASH |
| White et al. | 2013 | AS | 18 | ECV | 1.5 T; EQ-CMR; ShMOLLI |
| Miller et al. | 2013 | DCM/IHD (transplant) | 6 | ECV | 1.5 T, MOLLI |
| Bull et al. | 2013 | AS | 19 | Native T1 | 1.5 T; ShMOLLI |
| Lee et al. | 2015 | AS | 20 | Native T1 | 3 T, MOLLI |
| De Meester et al. | 2015 | AS/AR/MR | 31 | T1 and ECV | 3 T, MOLLI |
| Kammerlander et al. | 2016 | Mixed HF | 36 | ECV | 1.5 T, MOLLI |
| Lurz et al. | 2016 | Myocarditis | 129 | T1/T2/ECV | 1.5 T and 3 T, MOLLI |
Native T1, Postcontrast T1, and Extracellular Volume
Native T1
Native T1 measures the intrinsic signal from the combined cellular and interstitial compartments of the myocardium. The advantages are that it does not require an exogenous gadolinium-based contrast agent. Native T1 relaxation time is prolonged with collagen (fibrosis), edema, and amyloid and is shortened with reduced fibrosis, iron, fat, and hemorrhage. Given that native T1 measures both interstitium and myocyte T1, a signal from the interstitium alone is somewhat diluted by the myocyte signal, so subtle differences (diffuse fibrosis) are harder to detect. Moreover, capillary density, capillary vasodilatation, and “partial voluming” between blood pool and myocardium are also measured, potential biases if the signal sought is the matrix or myocyte compartments alone. Native T1 time is different with field strength and sequence design and varies between scanners, making comparison of native and postcontrast values between centers challenging. Currently, several groups have developed T1 phantoms to facilitate multicenter trials (Hypertrophic CardioMyopathy Registry [HCMR] ) or develop reference standards (T1 mapping and ECV standardization in CMR [T1MES] program ).
Postcontrast T1
After administration of gadolinium, T1 is dominated by, and inversely proportional to, the concentration of tissue gadolinium. Measuring T1 after contrast provides a value linked to the interstitium and has been applied to patients with heart failure. Postcontrast T1 also varies with gadolinium dose, time post bolus, and importantly, patient-specific factors such as heart rate, clearance rate, body composition, and hematocrit.
Extracellular Volume Fraction
If the change in T1 precontrast and postcontrast is measured in both blood and myocardium after sufficient equilibration of the contrast distribution, the partition coefficient can be calculated. By adding in the blood compartment contrast volume of distribution (1 − hematocrit), the myocardial ECV is derived ( Fig. 32.2 ). ECV is a more stable and biologically significant biomarker, as well as a more robust parameter than T1.

Extracellular Volume Fraction Dichotomizing the Myocardium Into Cell and Matrix Components
ECV divides the myocardium into two compartments (extracellular and cellular) and, therefore allows noninvasive quantification of the myocardial matrix volume and its counter-part, cell volume ( Fig. 32.3 ). The cell volume represents intact myocardial cellular components, proving a way to measure the myocyte volume (note that this also includes fibroblasts, blood cells, macrophages, etc.). How these change in disease (e.g., left ventricular hypertrophy [LVH]) is important. For example, in transthyretin-related (TTR) hereditary amyloidosis and light-chain amyloidosis, both have a massive matrix increase, but TTR has more matrix and 20% higher cell volume suggesting compensatory hypertrophy, which may permit more tolerance of the amyloid burden. By modeling water exchange, there is also some evidence that the contrast kinetics could be used to obtain cell size-dependent parameters, particularly if very high doses of gadolinium contrast are used.

T1 Mapping Evolution
The T1 mapping field is rapidly advancing to the point of widespread clinical utility. The first to T1 mapping was Messroghli in 2004 with a pulse-sampling scheme known as MOLLI (modified Look-Locker inversion recovery), replacing previous multibreath-hold approaches. This was refined, including new MOLLI variants, shortened modified Look-Locker inversion recovery (ShMOLLI; a shortened variation with long T1 advantages ), saturation recovery variants such as saturation recovery single-shot acquisition (SASHA; offering complete heart rate insensitivity ) or hybrid approaches (accelerated and navigator-gated Look-Locker imaging for cardiac T1 estimation [ANGIE], quantification using an interleaved Look-Locker acquisition sequence with T2 preparation pulse [QALAS], SAturation Pulse Prepared Heart rate independent Inversion-REcovery sequence [SAPPHIRE] ). Incremental developments such as respiratory motion correction gradually increased accuracy and precision. For ECV, contrast regimes were simplified from bolus followed by infusion or multi-timepoint sampling to a single precontrast and single postcontrast T1 map. Split contrast dose protocols suitable for stress perfusion imaging have been validated. ECV maps are now routine in some centers. ECV quantification is less field and sequence sensitive than native T1 mapping but ECV standardization is ongoing. Most recently, it was a found that a synthetic ECV can be automatically generated during scanning, in which the hematocrit of blood is inferred from the T1 of the blood pool (as the relationship between hematocrit and R1 [1/Blood T1] is linear), removing the need for a blood test. Finally, magnetic resonance fingerprinting may offer more rapid multiparametric tissue characterization in the future by providing myocardial T1, T2, and proton spin density in a single breath-hold.
For clinical use, these developments need to transition to standardized methodologies to diagnose disease; define mechanistic pathways of disease affecting the interstitium, the myocyte, or both; change therapy; and employ ECV as a surrogate endpoint in trials of drug development. This is the aim underpinning the first T1 mapping consensus statement. Our conceptual models are simple, but there is more going on; effects such as magnetization transfer, diffusion distance and time, contrast mechanisms, transcytolemmal water exchange rate, flow, T2 or T2* relaxation will require further investigation. Part of this development requires global approaches. Quality control systems, commercial sequences, megaregistries (e.g., Global CMR Registry, HCM Registry, UK Biobank) are in progress, and will provide high volumes of new insights in what is now the most active CMR research area.
Continuous Improvement Versus Stability
For a “feel” for the potential of mapping in different pathologic processes compared with health, transform the absolute difference into the maximum possible signal-to-noise ratio (SNR) in standard deviation (SD) units in severe but not extreme disease (a measure of effect size). Provided minimal systematic bias by disease-tracking confounders, such as heart rate or anemia, an SD change of 2 suggests the technique can detect between-group differences for biologic insights, >4 and it could determine the choice of therapy in individuals, and >6 said therapy could be monitored during treatment. A measured value consists of combined biologic and measurement variability. Considerable ongoing work is reducing the measurement variability, so the above SD changes are increasing with technical development.
T2 Mapping and Myocardial Edema
Cardiovascular magnetic resonance can assess myocardial edema by early gadolinium enhancement (EGE), T2-weighted imaging, LGE, multiparametric mapping (T1 precontrast, T1 postcontrast, T2 mapping), and the hybrid novel positron emission tomography/magnetic resonance imaging (PET/MRI) technique for myocardial inflammation. T2-weighted CMR has become established for the detection of myocardial edema, has been a particularly valuable tool for the discrimination of acute from chronic myocardial infarction, and has been investigated in health and disease. But as for T1, T2-weighted sequences are prone artifacts, have low sensitivity, and require either reference signal intensities in skeletal muscle (assuming that is normal) or are sensitive only to regional changes. As a result of different hardware or sequence parameters, reference values differ considerably. Furthermore, local myocardial wall motion and heart rate influence local myocardial T2 values. Although T2 acquisition at 3 T has the potential benefit of increased signal, it offered the same diagnostic accuracy as 1.5 T in the MyoRacer study. Using a turbo gradient spin echo sequence at 1.5 T, Bönner et al. showed that T2 mapping was highly reproducible, and that female sex and aging were accompanied by increased myocardial T2 values, but found no influence of heart rate or regional strain. T2 mapping is therefore good for the characterization of myocardial tissue in ischemia or inflammation, as described later.
T1 Mapping in Health and Disease
T1 mapping appears robust in detecting disease characterized by high T1 and ECV ( Figs. 32.4, 32.5, and 32.6 ), such as amyloidosis, or marked native T1 contrast diseases such as Fabry disease ([FD]; where fat storage makes native T1 fall) ; little biopsy histologic correlation is available in these diseases, however. For smaller expansions, reference ranges are needed. It is not exactly clear yet what these need to be. Gender appears to make a difference, but age has a much smaller or possibly no contribution once partial volume issues are accounted for. Here, the ratio of pathophysiologic signal-to-measurement error is a key determinant of test performance. Liu et al. reported on T1 and ECV data using older T1 techniques from 1231 participants aged 54 to 93 years of the Multi Ethnic Study of Atherosclerosis (MESA) study, where women had significantly higher native T1 and partition coefficient as well as lower postcontrast T1 times than men. When hematocrit was available, ECV was higher in women than in men (28.1 ± 2.8% vs. 25.8 ± 2.9%; P < .001). ECV correlated with age, however, with an R of 0.021 ( P = .012); that is, 98% of the variability of T1 was attributable to factors other than age.


A recent study investigating physiologic hypertrophy in an athlete’s heart using T1 mapping showed that hypertrophy was caused by an expansion of the cellular compartment while the extracellular volume becomes relatively smaller, hinting that ECV quantification may have a future role in differentiating physiologic from pathologic left ventricular hypertrophy (LVH), which is a major result if confirmed.
Infiltrative Cardiopathies: Amyloid, Iron Overload, Fabry Disease
Infiltrations (iron, FD, amyloid) are important because although rare, expensive therapies are available that need noninvasive targeting and/or development. Furthermore, they provide insights into more complex and more common polygenic diseases because these diseases have very high signal changes on multiparametric mapping. The only pathology that causes T2* to fall is iron (−7 SD), although cobalt and chromium have been described in the liver ; T1 only falls substantially in two currently known diseases (see Fig. 32.4B and C ), FD (−6 SD) and iron (−15 SD), with one study suggesting a small fall in athletic adaption (−1 SD). Amyloid native T1 elevation is marked (+8 SD; see Fig. 32.4D and E ), and ECV elevation in amyloidosis (amyloidosis―where the amyloid is the cause of disease rather than a bystander) is always above 45%, a level seemingly impossible in other diffuse diseases (although more needs to be known about global myocarditis). Mapping in these diseases has important benefits: it may offer superior reproducibility (T1 in iron ), earlier disease detection (T1 is low in 50% of FD subjects without LVH ), or tracking change with therapy (amyloid ).
Amyloidosis
Cardiac amyloidosis is a rare condition characterized by a progressive infiltrative cardiomyopathy in which deposits of amyloid accumulate in the ventricular myocardium, almost always of either immunoglobulin light-chain (amyloid light-chain [AL]) or transthyretin (amyloid transthyretin-related [ATTR]) type, the latter being wild type or mutant. Advances in echocardiography, bone tracer scintigraphy, and CMR mean the noninvasive diagnosis of cardiac amyloidosis is maturing and biopsy is no longer needed in many circumstances. Prognosis is often poor, and treatments are substantially influenced by cardiac involvement. CMR with phase-sensitive LGE has characteristic findings in cardiac amyloidosis and provides incremental information on the outcome even after adjustment for known prognostic factors; transmural involvement represents advanced cardiac amyloidosis with poor prognosis. The marked interstitial expansion is also reflected on T1 and ECV mapping: Native T1 is significantly elevated in both AL and ATTR amyloidosis —useful in a population with a high prevalence of renal failure. Karamitsos et al. studied 53 patients with AL amyloidosis and compared native T1 and LGE to biomarker and echocardiographic criteria. They found that native T1 yielded a 92% accuracy for cardiac amyloidosis with possible or definite involvement and that it appeared more sensitive than LGE. Similarly, Fontana et al. found that native T1 has a similar diagnostic accuracy in TTR amyloidosis but with a lower maximal T1, which has led to the (as yet unproven) hypothesis that the rapid deposition of amyloid fibrils in AL may be associated with myocardial edema. T2 mapping data is currently awaited in cardiac amyloid, although results from T2-weighted imaging have been conflicting, with one study showing no difference in T2 and another study showed a lower T2 ratio in cardiac amyloid, related to poorer survival (although no differentiation between AL and ATTR was made).
ECV is a more direct marker of extracellular expansion, has high diagnostic accuracy for the diagnosis of cardiac amyloidosis, and predicts survival. ECV has therefore been incorporated as a surrogate endpoint in clinical trials in amyloidosis ( ClinicalTrials.org : NCT01777243/ NCT01981837). When confronted with a patient with LVH, a very elevated T1 or ECV helps distinguish amyloidosis from hypertension or HCM.
Fabry Disease
FD is a rare but treatable X-linked disorder resulting in sphingolipid deposition in a number of different organs. Cardiac manifestations include LVH, arrhythmias, and valvular disease, and cardiovascular disease is now the primary cause of death in FD. Early treatment with enzyme replacement therapy (ERT) may reverse or slow disease progression. Native T1 mapping can identify patients early, potentially helping target costly enzyme therapy. Two groups independently demonstrated lower myocardial T1 values in FD. Furthermore, T1 mapping can discriminate against other diseases with hypertrophy, with no overlap in T1 values, and has excellent reproducibility. Pseudo-normalization in T1 values (mixed extracellular fibrosis and lipid) and subsequent prolongation in T1 (burnt-out fibrosis) may provide an insight into disease progression. Furthermore, recent data by Nordin et al. comparing T1 and T2 mapping, LGE as well as high-sensitivity troponin T (hs-TnT) and N-terminal pro b-type natriuretic peptide in FD with HCM, chronic myocardial infarction and healthy control, showed elevated T2 values in areas of LGE in FD. This highly correlated with hs-TnT, suggesting that FD with LGE is a chronic inflammatory cardiomyopathy.
Cardiac Siderosis
The impact of T2* measurement is discussed in Chapter 33 . CMR linked to therapy has had a dramatic impact in reducing morbidity and mortality in cardiac iron loading, Cardiac iron loading has largely been the domain of T2* measurement sequences, which are histologically validated, and can track iron levels with chelation. Cardiac siderosis, however, prolongs all three CMR parameters: T1, T2, and T2*. Sado et al. showed in 88 patients that T1 mapping correlates well with T2* and was more reproducible than T2*. T2* mapping appears robust and simplifies analysis, but performance in difficult cases remains undefined. Abdel-Gadir et al. performed 126 scans in two 12-hour days in Thailand, with an average scan time of 8.3 minutes for combined T1 and T2* mapping that could be analyzed within 1 minute. Although the combined T1 and T2* acquisition is similar in duration to a T2* scan alone, further work is needed to establish the clinical value of such an approach. An ultrafast mapping approach is being pursued in 18 countries and 28 sites globally.
Stay updated, free articles. Join our Telegram channel

Full access? Get Clinical Tree


