T2* mapping techniques has evolved significantly since their introduction in the early 2000s and a significant amount of evidence has been gathered to support their clinical routine use for iron overload assessment. This article focuses on the most important aspects of how to perform T2* imaging, from acquisition, to postprocessing, to analyzing the data with clinical concentration. Newer techniques have made T2* mapping more robust and accurate, allowing a broader use of this technique for noncontrast ischemia imaging based on blood oxygen levels, in addition to evaluation of intramyocardial hemorrhage and microvascular obstruction.
Key points
- •
T2* mapping sequences are widely accessible in most commercial scanners and multiple tools to quantify it are available.
- •
New technical developments have made possible automated and free-breathing acquisition of T2* maps with no major limitations on age.
- •
Routine T2* assessment of iron overload is recommended in patients with chronic transfusions and has significantly changed prognosis and treatment strategies.
- •
T1 and T2 maps can be used for iron overload assessment and evidence is rapidly increasing for these alternative methods in this scenario.
- •
Intramyocardial hemorrhage, microvascular obstruction, and blood oxygen level ischemia assessment are important variables in acute and chronic coronary artery disease that can be evaluated with T2* maps.
Multiparametric mapping of the myocardium has become an area of great interest in the recent year with multiple review articles and recommendation statements. Despite most of the focus initially on T1 mapping and then on T2/edema imaging, T2* mapping was the first clinically useful parametric mapping technique for the heart. Before the introduction of T2* as a diagnostic tool, iron-induced cardiomyopathy was the most common cause of death in transfusion-dependent thalassemic patients. It has been now more than 18 years since the initial applications of T2* images in iron overload assessment began to be performed and the accumulated knowledge gained from that has led to important practical changes in the diagnosis and treatment with chelation. T2* is the current method of choice for the assessment of cardiac iron deposition, with proven evidence in reduction of overall mortality (improvement on life expectancy and fewer cardiovascular complications in transfusion-dependent patients). Moreover, faster protocols can make this technology available in developing countries. This article summarizes the most important aspects of T2* mapping when applied in clinical practice, with an additional look into other applications in which T2* maps might also provide unique important data beyond traditional clinical and imaging markers.
T2* techniques: from acquisition to postprocessing
Physical Parameter: T2* Imaging
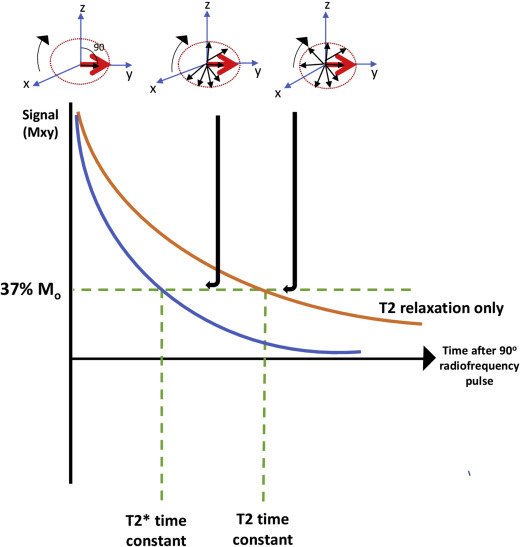
T2* represents the decay of transverse magnetization caused by a loss of coherence between spins and magnetic field inhomogeneity. This relaxation is measured using gradient-echo (GRE) imaging. This transverse relaxation is eliminated when a 180 ° pulse is applied using a spin echo sequence (true T2 relaxation), which removes the magnetic field inhomogeneity, as illustrated in Fig. 1 . The principle of T2* relaxation is involved in numerous magnetic resonance (MR) applications with GRE sequences, such as perfusion techniques and functional imaging sequences.
T2* Imaging to Assess Iron Loading
A fundamental principle to generate images for iron quantification is to apply a strong magnetic field and radiofrequency signals through GRE sequences, with time of decay controlled by the MR imaging scanner. The longer the echo time (TE), the darker the resultant image; iron-mediated darkening can be characterized by a half-time constant and is nonlinearly proportional to the level of iron concentrations. Often, this darkening is described as a rate principle (R2*) rather than a time constant. The relaxation rate is just the reciprocal of the time constant, R2* = 1000/T2*. The factor of 1000 is included because T2* is expressed in milliseconds and relation rates in expressed in Hertz (sec −1 ). To calculate T2*, an application of multiple radiofrequency pulses leads to the generation of a series of images with different TEs.
Traditional Sequences to Measure Cardiac Iron Overload
The most updated international expert consensus suggests that, for T2* cardiac iron loading assessment, a multiecho GRE, with 8 equally echo times, ranging from 2 to 18 milliseconds, may be used on a 1.5 T imaging scanner. Fat saturation is needed for the liver but is not essential for heart images. Good shimming of the heart is a requirement for accurate measurements and manual volume shimming may be required in order to reduce potential artifacts. Once adjusting these factors, both bright-blood and dark-blood techniques are validated and widely used clinically.
- •
Bright-blood technique: images are acquired immediately after the R wave to reduce artifacts caused by blood flow and myocardial wall motion.
- •
Dark-blood technique: a double inversion recovery pulse is used to null the signal from blood; multiecho T2* acquisition is extended to late diastole with minimal cardiac motions technique.
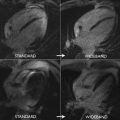
Compared with bright-blood technique, dark blood has been shown to have superior reproducibility, less artifact susceptibility and it is the preferred method to use clinically ( Fig. 2 ).

Postprocessing and Myocardial T2* Calculation
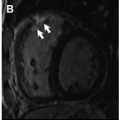
The measurement of myocardium iron is typically performed in a midventricular short-axis image. The septal iron concentration largely reflects the global iron content as shown in biopsy studies, so analysis can be restricted to this segment to avoid artifacts caused by susceptibility effects ( Fig. 3 ).

One of the most important limitations for postprocessing is the signal plateau, which complicates the approach to the curve fitting method for evaluation of the T2*. Different approaches have been designed to tackle this. The truncation model discards the late plateau points and then the remaining signal is fitted with a monoexponential equation. The other common method is the offset model, in which an exponential equation plus a constant offset is used to tackle this problem. As a general perspective, the use of offset models may produce underestimation of T2* values on bright-blood data, making it less reproducible compared with the truncation method ( Fig. 4 ).

Several approaches have been used to try to improve truncation model accuracy, especially in severe iron stages, in which artifact produces major limitations. Nonlocal means (NLM) providing more accurate pixel-by-pixel MR imaging relaxometry may improve tissue characterization. Moreover, a noise-corrected model has been created, limiting analysis to the region of interest (ROI; base curve fitting) and consistently producing accurate and precise R2* values by correctly assessing the noncentral chi noise. Most clinical vendors and dedicated cardiovascular software have validated methods of interpreting T2* data with both US Food and Drug Administration and Conformité Européene approval. Open-source software is also available and validated against commercial tools, resulting in a large number of options for sites to choose from in order to quantify T2* with high accuracy.
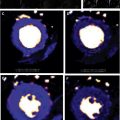
Breath-hold Versus Free-breathing Techniques
The pixel-wise mapping technique involves curve fitting on individual pixels; it offers a more spatial context than ROI-based methods for the delineation of adjacent tissues with different tissue values and therefore provides a surrogate measure of the iron distribution. This technique covers the entire field of view and provides important information to identify artifacts that may be less apparent. Moreover, pixel-wise mapping is automatic, reduces time of analysis, and the median values calculated from the partial interventricular septum region provide lower intraobserver and interobserver variabilities compared with conventional techniques. However, the main limitation with breath-held mapping is noise and the possibility of artifacts caused by the long breath-hold times. As an alternative, a free-breathing T2* mapping method was developed with full automation, truncation of long TE, and low signal/noise ratio (SNR) images after motion correction with highly accelerated multi-GRE acquisition and multiple averages to improve SNR. This method resulted in consistently good-quality maps, especially when respiratory motion and arrhythmias are present and with the same time of acquisition as breath-hold techniques. Other free-breathing methods also showed accurate results in the heart, with improved temporal resolution using single-shot GRE echo-planar imaging (EPI) enabling accurate myocardial measurement and being insensitive to respiratory motion. Fig. 5 shows examples of different imaging techniques, including breath-hold and free-breathing approaches.

Clinical Application of Iron Overload Assessment with T2*
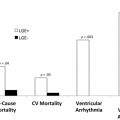
Since its introduction in early 2001, the use of T2* imaging to guide therapy in patients with iron overload, coupled with improvement in chelator options and advances in other coadjuvant management strategies, resulted in significant reduction in cardiovascular death and disability in patients with thalassemia major. T2* Cardiac Magnetic Resonance (CMR) is a recommended examination in practically all clinical guidelines relating to iron overload treatment and its use has been summarized in specific recommendation statements as well.
From a practical standpoint, transfusion-dependent patients should start monitoring myocardial T2* at the age of 10 years if they are routinely followed and have a history of being well chelated. However, patients in whom the treatment follow-up is unclear, or who have irregular chelation or very high liver iron concentrations (LICs), may perform their first MR imaging scan at ages as early as 7 years because significant myocardial iron concentrations (MICs) have been described at this early age. Although initial T2* techniques performed poorly in very young children because of lack of breath holding or movement, the newer free-breathing technique copes with these difficulties fairly easily and provides good-quality images, making age restrictions no longer a limitation to when to begin scanning patients, as shown in Fig. 6 .

Once started, routine follow-up of MICs should be performed yearly in most patients, with this interval varying from 6 months to 2 years depending on specific clinical conditions and service availability. Note that removal of cardiac iron in the heart is a slow process and, especially in acute settings (ie, acute heart failure), the clinical condition sometimes improves significantly, whereas T2* changes will not be proportional. The main reason for this disparity is that T2* measures mostly chronically stored iron in lysosomes, whereas the iron being mobilized by intensive chelation is in labile form, with limited T2* effects. Nevertheless, monitoring the effects of iron chelation or accumulation is a primary target of routine MR imaging scans in these patients and any changes greater than the coefficient of variation of 4% for black-blood images and 8% for bright-blood images should be considered significant changes.
Another important clinical aspect of using T2* for iron overload assessment involves the correlation of T2* values and MIC. Although, T2* values and LIC correlations were established for the liver at a very early stage in the development of the technique, , T2* was the main variable used for the heart for quantification until Carpenter and colleagues performed the comparison of this MR imaging value with MIC-measured biopsied hearts. Because T2* and MIC are not linearly related, this must be taken into account when assessing longitudinal changes in T2* values because significant changes in MIC occur when small variations are seen at low T2* values. The correlation of T2* and MIC can be seen in Fig. 7 using the equation MIC = 45 × T2* −1.21 , as published by Carpenter and colleagues.

When reporting the iron concentrations obtained with various T2* techniques, the value of 20 milliseconds has been traditionally associated with the normal cutoff for non–iron-overloaded myocardial tissue based on the initial Anderson and colleagues data, which showed that almost all patients with T2* greater than these levels did not develop reductions in left ventricular ejection fraction. However, despite the popularity of this number, other investigators have shown that iron deposition is frequently found in patients with septal T2* greater than these levels. Therefore, it would be more appropriate to consider the normal myocardial T2* levels according to measurements performed in normal volunteers, in whom normality was established at 36.1 ± 4.5 milliseconds. Nevertheless, traditional reporting tables for iron overload using T2* have used cutoffs based on clinical management strategies and prognostic data. Table 1 lists the values of myocardial T2*, MIC, and the reporting levels for iron overload in the heart. Note that although T2* levels less than 10 milliseconds are considered severe, risk increases dramatically as T2* decreases further from 10 to 8 to 6 and even 4 milliseconds. As for normal values, correlations with T1 suggest that 26 milliseconds would be a more appropriate cut point for T2*, and several centers worldwide report potential early iron in the range of 20 to 26 milliseconds. Although not the focus of this article, the authors have also included the corresponding liver reference values because usually both measurements are performed in the same patient with the corresponding calibration curves. A more thorough review of liver iron concentration measurements can be found elsewhere. Despite the main recommendations being for iron overload assessment to be performed at 1.5 T, many studies have now also performed correlations of iron overload at 3 T, and these values are reported in Table 1 as well using one of the reference studies with this field strength.
Related posts:
 Applications of Cardiac MR Imaging in Electrophysiology
 The Role of Contrast-Enhanced Cardiac Magnetic Resonance in the Assessment of Patients with Malignant Ventricular Arrhythmias
 State-of-the-Art Quantitative Assessment of Myocardial Ischemia by Stress Perfusion Cardiac Magnetic Resonance
 Automated Quantitative Stress Perfusion in a Clinical Routine
 The Prognostic Value of Late Gadolinium Enhancement in Nonischemic Heart Disease
 The Value of T1 Mapping Techniques in the Assessment of Myocardial Interstitial Fibrosis
Stay updated, free articles. Join our Telegram channel

Full access? Get Clinical Tree


