Technical Basics of Diagnostic and Interventional Imaging


Technical Basics of Diagnostic and Interventional Imaging


3.1 Echocardiography

Hashim Abdul-Khaliq

Matthias Gutberlet


3.1.1 Introduction

Echocardiography, which was introduced in the 1950s, leverages the physical characteristics of ultrasound. Echocardiography1 uses special transducers whose design allows intercostal views by using frequencies between 2 and 7 MHz to achieve the necessary penetration depth (▶Fig. 3.1). Due to the prevalence of these devices and the universal applicability of the method (including in intensive care units), echocardiography is the method of choice for noninvasive imaging diagnostics, in that it depicts cardiac morphology and function, even in children and infants with congenital or acquired heart diseases.2,3 In most cases, the entire cardiac structure and possible malformations in the heart and adjacent vessels can be depicted even prenatally by using specifically adjusted probes. Echocardiography has established itself as the method of choice for diagnosing functional and structural heart diseases in both children and adults. In addition to universal applicability and real-time image acquisition, the large variety of functional parameters that can be measured via echocardiography constitute a decisive benefit to this method as compared to other imaging modalities. Over the past 10 years, traditional 2-D echocardiography has been supplemented by 3-D and even 4-D echocardiography and tissue Doppler, which have been introduced as new procedures in all modern echo devices.


Fig. 3.1 Echocardiography transducer. Schematic depiction. The transducer permits intercostal views.


3.1.2 Standard Techniques

The following techniques are considered standard:


  • 1-D (M-mode) echocardiography,


  • 2-D echocardiography,


  • 3-D echocardiography, and


  • Doppler echocardiography.

The exam is usually performed in a left lateral position with a slightly elevated upper body.4 The examiner faces the patient and performs the exam from the left or right side.


One-Dimensional (M-mode) Echocardiography

The sonic waves emitted by the transducer at a certain frequency are reflected by interfaces and converted into electronic signals based on the interfaces’ depths. For Amode echocardiography, echogenicity corresponds to the height of the amplitude, and for B-mode, the brightness (also known as intensity; ▶Fig. 3.2). If the B-mode image is recorded over time, it is considered to be “M-mode” (motion). 1-D echocardiography only retains practical importance in the form of M-mode (▶Fig. 3.3), which can be used to determine ventricular diameter and valve level in a standardized manner.1


Two-Dimensional Echocardiography

The echocardiographic window to the heart and major vessels is better in children than in adults. Both in terms of transthoracic imaging (by means of standard sectional planes) and subcostal/subxiphoidal or suprasternal imaging (▶Fig. 3.4), additional views of the heart and the major vessels are easier to achieve in pediatric patients. A 2-D image is achieved by taking scans of the organ in multiple layers and depicting the images in B-mode. In general, two standard views—left parasternal and left apical (▶Fig. 3.4)—are used. These views are oriented to the anatomical long axes of the heart with its three distinct angulations. These standard sectional planes, well-known in echocardiography, can also be used for other imaging modalities (for MRI, by means of the corresponding angulation during data acquisition, and for MDCT, by means of corresponding multiplanar reconstructions of the 3-D data sets).5


Fig. 3.2 Principles of 1-D echocardiography. Schematic depiction. Parasternal view with recordings in A-mode, B-mode, and M-mode.

Ao = aorta

AoV = aortic valve

LA = left atrium

LV = left ventricle

RV = right ventricle


Fig. 3.3 1-D echocardiography in M-mode. Schematic depiction. M-mode sweep along the parasternal long axis with a recording of typical movement patterns of the left and right ventricles and the mitral and aortic valves during the cardiac cycle. Fractional shortening can be determined as a measure of left ventricular global function based on the LV-EDD and LV-ESD parameters.

A = A-wave (mitral valve movement during atrial contraction)

AoV = aortic valve

E = E-wave (mitral valve movement during diastole, known as early filling)

ECG = electrocardiogram

LV = left ventricle

LV-EDD = left ventricular end diastolic diameter

LV-ESD = left ventricular end systolic diameter

LV-PW = left ventricular posterior wall

MV = mitral valve

RV = right ventricle

RV-AW = right ventricular anterior wall

RVOT = right ventricular outflow tract


Fig. 3.4 Typical transducer positions during TTE. Schematic depiction. By using the depicted views, the heart and adjacent vessels can generally be depicted well in pediatric patients during a TTE. For children, even the suprasternal view often allows an aortic isthmus to be visualized.

The left-parasternal view allows the following sectional planes to be examined, based on transducer rotation and angulation4:


  • Parasternal long axis of the left ventricle (▶Fig. 3.5): This view primarily allows left ventricular size and function to be evaluated. In addition, this view allows 2-D and color Doppler visualization of the presence of a VSD in the perimembranous and muscular portion of the septum.


  • Parasternal short axis of the left ventricle (after rotating the transducer 90° and shifting it accordingly)


    • with a depiction of the aortic and pulmonary valves (▶Fig. 3.6), the pulmonary arterial stem, possible abnormal vascular connections such as a coronary fistula, abnormal connection of the coronaries to the pulmonary arterial stem (Bland-White-Garland syndrome), and, above all, PDA.


    • with a depiction of the mitral valve, the papillary muscles, or the apex (▶Fig. 3.7). This sectional plane allows the size and function of the left ventricle and the mitral valve opening to be assessed.


The following standard planes can be acquired from an apical view:


  • Apical 4-chamber and 5-chamber views: These views can depict the LVOT and aortic valve (▶Fig. 3.8). Abnormal structures and functional abnormalities, such as turbulences or regurgitation via the aortic valve, can be visualized using color Doppler.


  • Apical left 2-chamber view and apical long axis (by rotating the transducer 90° and angulating it appropriately): These views can depict the LVOT (▶Fig. 3.9).


Fig. 3.5 2-D echocardiographyparasternal long axis of the heart. Schematic depiction.

Ao = aorta

AoV = aortic valve

LA = left atrium

LV = left ventricle

RV = right ventricle


Fig. 3.6 2-D echocardiographyparasternal short axis of the heart. Schematic depiction. This sectional plane allows the aortic and pulmonary valve views to be depicted.

AoV = aortic valve

LA = left atrium

PA = pulmonary artery

PV = pulmonary valve

RA = right atrium

RVOT = right ventricular outflow tract

TV = tricuspid valve


Fig. 3.7 2-D echocardiographyparasternal short axis of the heart. Schematic depiction. The parasternal long axis (a) is depicted with the corresponding short-axis slices (b) that occur when the transducer is rotated 90°. The red lines indicate the corresponding transducer position.

Ao = aorta

AML = anterior mitral leaflet

LA = left atrium

LV = left ventricle

MV = mitral valve

PML = posterior mitral leaflet

a Parasternal long axis.

b Short axis slices.


Fig. 3.8 Apical 4-chamber and 5-chamber view. Schematic depiction.

Ao = aorta

AoV = aortic valve

LA = left atrium

LV = left ventricle

MV = mitral valve

RA = right atrium

RV = right ventricle

TV = tricuspid valve.

a Four-chamber view.

b Five-chamber view.


Fig. 3.9 Apical 2-chamber view and LVOT cross-section. Schematic depiction. From an apical view, by rotating the transducer 90° in the 4-chamber view (a, red line), the apical 2-chamber view (b) and the apical long axis or LVOT cross-section (c) can be acquired by rotating the transducer appropriately.

Ao = aorta

AoV = aortic valve

LA = left atrium

LV = left ventricle

MV= mitral valve

a Four-chamber view.

b Apical 2-chamber view.

c Apical long axis or LVOT cross-section.

A suprasternal view (▶Fig. 3.4) is used to depict the aortic arch and the vessels branching off from it, whereas subcostal or subxiphoidal access is often also selected to depict a 4-chamber view.

Using the named sectional planes, the morphology and function of various different regions of the heart, including the valves, can be evaluated visually and quantitatively in real time. This is of great significance for heart defects that correlate to abnormal positioning of the atrioventricular valve.

M-mode is generally used to determine cardiac diameter (e.g., left-ventricular end diastolic diameter) in the parasternal long and short axes in a standardized manner (▶Fig. 3.2 and ▶Fig. 3.3). Segmental fiber shortening can be determined using these diameters from M-mode. This shortening represents the shortening fraction percentage of the left ventricle and is determined using the following formula1:


where

FS = segmental fiber shortening in %

LV−EDD = left ventricular end diastolic diameter

LV−ESD = left ventricular end systolic diameter.


Three-Dimensional Echocardiography

This newer development is based either on data sets acquired using multiplanar reconstruction with 2-D echocardiography in regular intervals of the transducer held in a parallel, rotated, or fanlike fashion4,6,7 or using data acquired via real-time 3-D echocardiography.8 The latter requires recording only a single cardiac cycle. Modern echo devices make it easier and faster to acquire 3-D volumes. Most high-performing echo devices possess digital 3-D volume transducers. In particular, acquiring 3-D volume data from a single cardiac cycle appears to be of particular importance (▶Fig. 3.10 and ▶Fig. 3.11).

For younger children who cannot hold their breath or patients with frequent extrasystole, this new technique has made it possible to collect 3-D data sets for reconstructing intracardiac structures or measuring ventricular volume. Most importantly, however, the new software can help record and calculate the volumes of the left and, increasingly, the right ventricle in real time, and thus very rapidly (▶Fig. 3.12). The end systolic volume (ESV), end diastolic volume (EDV), and ejection fraction of the left ventricle can be calculated easily using this data.


Fig. 3.10 3-D echocardiography. 3-D reconstruction of the tricuspid valve (before surgical reconstruction) for an 11-year-old girl with Ebstein’s anomaly, a free-floating leaflet (blue arrow), and chordal rupture.

By dividing left ventricular volume into 17 segments, changes can be calculated in the respective segments of the left ventricle during a single cardiac cycle. Heterogeneous changes can be identified in cases of dyssynchrony. An index known as the SDI (Systolic Dyssynchrony Index) can be determined using the changes calculated in the left ventricle’s individual volume segments (▶Fig. 3.13).9


Doppler Echocardiography


Doppler Principle

Compared to purely imaging 2-D echocardiography, Doppler echocardiography technology also provides the opportunity to acquire information about flow direction, velocity, and flow quality (laminar or turbulent flow). Noninvasive determination of blood flow velocity3,10 is based on the application of the Doppler effect. This means that sonic waves reflected by moving objects perceive a change in frequency directly proportional to the object’s velocity. Velocity v is calculated using the Doppler equation:


where

fd = change in frequency (Doppler frequency or shift)

f0 = emitted frequency (e.g., 3.5 MHz)

v = blood flow velocity

α= angle between ultrasound waves and blood flow

c = sonic velocity in human tissue (approx. 1,530 m/s).


Fig. 3.11 3-D echocardiography.

Ao = aorta

AoV = aortic valve

a LVOT reconstructed from a 3-D data set with a thickened aortic valve.

b 5-chamber view with a central ascending aorta.

c 3-D reconstruction of a unicuspid aortic valve (before surgical valve reconstruction) in a 15-year-old girl with a combined aortic vitium.


Fig. 3.12 3-D echocardiography. 3-D volume reconstruction of the right ventricle in a patient with surgically treated tetralogy of Fallot and a significantly enlarged right ventricle.

a Long-axis planimetry of the right ventricle (2-chamber view).

b Total volume of the enlarged right ventricle determined using planimetry.

c Long-axis planimetry of the right ventricle (4-chamber view).

d Short-axis planimetry of the right ventricle.


Fig. 3.13 3-D echocardiography.

EDV = end diastolic volume

EF = ejection fraction

ESV = end systolic volume

SDI = systolic dyssynchrony index

SV = stroke volume

a Real-time 3-D reconstruction of a male patient’s left ventricle after correcting his pulmonary atresia correction. The left ventricular volume is subdivided into 17 segments according to the AHA, and the decrease in volume is measured and recorded in the individual segments during systole within a single cardiac cycle. At 29.64%, the patient’s left ventricular ejection fraction is reduced significantly.

b Segmental curves of a test subject’s homogeneous volume change. All of the curves demonstrate a largely synchronous course.

c Dyssynchronous volume changes in a male patient a from which an SDI can be calculated, which appears to be closely associated with left ventricular function. In particular, septal segments 1, 6, 7, and 12 demonstrate significant asynchrony after correcting the patient’s pulmonary atresia.

The three systems of Doppler echocardiography10 are as follows:


  • Continuous-wave Doppler (CW Doppler): CW Doppler records all flow velocities along the sonic ray. It possesses a large penetration depth and allows high flow velocities to be recorded and quantified. Unlike a PW Doppler, however, it cannot precisely localize the site with the highest flow velocity.


  • Pulsed-wave (PW) Doppler: PW Doppler allows flow velocities to be recorded only within a “measuring range,” in a sample volume (measured volume). It possesses less penetration depth than a CW Doppler. Unlike the CW Doppler, however, PW Doppler allows precise localization of the recorded flow velocity.


  • Color Doppler: This type of Doppler is represented primarily by color Doppler, and constitutes the most
    common type of Doppler echocardiography. The median flow velocities determined using many measurement volumes (sample volumes) are depicted in a color-coded 2-D image. Color Doppler echocardiography delivers not just information about blood flow velocity, flow turbulence, and flow volume, but also information about the direction and quality of blood flow in real time. Thus, it can be used for orientation, qualitative assessment of the extent of valve insufficiency or stenosis, or assessment of shunt size in cases of ASD or VSD.


Fig. 3.14 Flow ratios in vascular or valvular stenoses. Schematic depiction. Application of the Bernoulli equation to assess pressure gradients based on maximum flow velocity using Doppler sonography.


Table 3.1 Graduation of the aortic valve stenosis in Doppler ultrasound.4


Parameter


Degree of severity of aortic valve stenosis


Low


Moderate


Significant


Severe


Δpmax (mmHg)


<30


30-60


61-90


> 90


Δpmean (mmHg)


<20


20-30


31-50


> 50


AVOA (cm2)


> 1.00


1.00-0.75


0.74-0.50


< 0.5


AVOA, aortic valve orifice area; Δpmax, maximum pressure gradient over the aortic valve, determined using CW Doppler; Δpmean, mean pressure gradient over the aortic valve, determined using PW Doppler.


Stenosis Quantification

If an obstruction (stenosis) is present in a vessel or valve, this leads to increased blood flow velocity in this area. When blood flow velocity is measured immediately before and immediately after the stenosis (▶Fig. 3.14), the Bernoulli equation is applicable. This means that maximum velocity (velocity behind the stenosis) and the pressure gradients measured at the site of the stenosis are directly proportional to one another. Since velocity before the stenosis is generally relatively low (less than 1 m/s), it can often be disregarded.11 This results in a simplified formula for calculation, which can also be used to evaluate gradients in MRI flow measurements5,12:


where

p1 = pressure before the stenosis

p2 = pressure after the stenosis

v2 = maximum flow velocity immediately after the stenosis.

In addition to assessing pressure gradients for valvular and vascular stenoses, Doppler echocardiography also collects data for a number of additional parameters to assess valve function.1,3,4,10 Calculating aortic valve orifice area via the continuity equation from aortic diameter caudal to the aortic valve and maximum flow velocity in LVOT and distal to the aortic valve is of particular practical significance.


where

AVOA = aortic valve orifice area

d = diameter of LVOT caudal to the aortic valve

vLVOT = maximum flow velocity in the LVOT

vmax = maximum flow velocity distal to the aortic valve.

The graduation of the aortic valve stenosis should be recorded via Doppler as an example (Table 3.1). The mean gradient above the aortic valve correlates best to aortic valve gradients measured invasively.


Unlike in MRI, valve incompetence grading in Doppler echocardiography (in contrast to stenoses grading) can usually be only assessed only semiquantitatively due to the jet length and width in color Doppler or by using signal intensity or signal gradient in CW Doppler (Table 3.2).3,4 In addition, the influence of the insufficiency on peripheral flow in the ascending aorta can also be assessed using Doppler. The volume and duration of diastolic regurgitation in the aorta provide additional qualitative information regarding the degree of aortic valve insufficiency.


3.1.3 Special and Newer Techniques


Transesophageal Echocardiography

For respirated patients or for patients who cannot be imaged easily from a transthoracic view, the heart can be assessed using echocardiography and Doppler echocardiography via a transesophageal probe with an integrated transducer. This improves the depiction of cardiac structures and vessels adjacent to the esophagus, since it leads to less sonic absorption compared to TTE.4 For these reasons, highfrequency transducers (5-9 MHz) can also be used, which improves spatial resolution significantly. A distinction is made between monoplanar (only allows transverse imaging), biplanar, and multiplanar probes.


Table 3.2 Graduation of aortic valve insufficiency measured via Doppler.4


Parameter


Aortic valve insufficiency


Low


Moderate


Severe


Jet width in color Doppler/LVOT width


<1/3


<2/3


>2/3


Signal gradient in CW Doppler (m/s2)


< 2.5


> 2.5-4.0


> 4.0


CW, continuous wave; LVOT, left ventricular outflow tract.


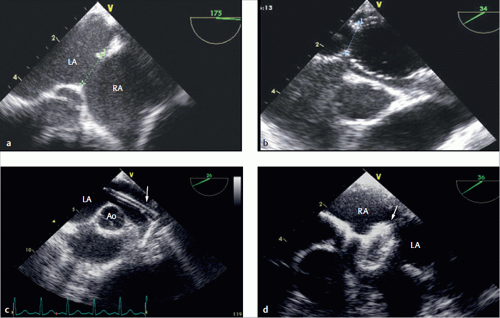
Fig. 3.15 TEE. Depiction of an ASD.

LA = left atrium

RA = right atrium

RV = right ventricle

a Schematic depiction of a TEE being performed and the most clearly visualized cardiac structures.

b Large ASD depicted using TEE, with a significant left-right shunt (arrow) in a male patient with a limited transthoracic acoustic window.

Main areas of application for transesophageal echocardiography (TEE) include the following:


  • Assessing atrial structures (e.g., clots, tumors, intraatrial septal defects, valve morphology and function, changes in valves in the sense of endocarditis vegetation)


  • Assessing LVOT morphology


  • Assessing the aortic valves (unicuspid, bicuspid, or tricuspid aortic valves) and their function


  • Assessing the morphology and size of the ascending aorta (e.g., aortic dissection)


Fig. 3.16 TEE. Depiction of an ASD. The interatrial septum can be clearly depicted via TEE. Multiplanar depiction of the septal defect (ac, arrows) from various angles (0-180°; three angles are shown as an example [angular display listed top right in green]) allowing the size, extent, and shape of a defect to be visualized with precision before an interventional closure.

LA = left atrium

RA = right atrium

a 37° angle.

b 75° angle.

c 168° angle.

In principle, interventional treatments (such as closure of intraatrial communication) can also be performed during TEE exams. Since atrial structures can be depicted so well via TEE, any atrial maneuvers—from probing the defect and pulmonary veins up to placement of an AmplatzerTM septal occluder—can be performed without X-ray exposure (▶Fig. 3.17).


Stress Echocardiography

Stress echocardiography became widely used in clinical routines for detecting coronary heart disease, particularly as a noninvasive imaging procedure,13 in the 1990s. Since then, it is used only rarely to diagnose disorders during preinterventional and postinterventional diagnostic procedures for patients with congenital heart defects—and even then, mostly to diagnose ischemia. This is particularly true for patients with limitations in performing, assessing, or interpreting stress ECG tests, or with positive clinical pictures but negative stress ECG results.4 Stress can be induced via bicycle ergometry or, more commonly, using pharmacological means. The latter has been tried and tested particularly in patients with limited exercise capacity or physical compliance due to age or illness. The main principle of stress echocardiography is based on proving the presence of wall motion abnormalities in the left ventricle after stress-induced ischemia (▶Fig. 3.18). For this reason, the stressor dobutamine13,14 is often preferred over vasodilators (dipyridamole, adenosine)15 in stress echocardiography. Recently, there have been promising trials using echo contrast agents16 to examine myocardial perfusion under stress conditions. Thus, vasodilators are becoming more prominent.

The known methods of wall motion analysis in stress echocardiography have also been applied to MRI in recent years. This has led to significant improvement in image quality, particularly for patients with limited feasibility for echocardiography due to a poor acoustic window. Overall, these improvements have expressed themselves via higher sensitivity and specificity in detecting coronary heart disease.17

Stress echocardiography is used not just for diagnosing ischemia, but also for myocardial viability diagnostic purposes in the form of low-dose dobutamine stress (5-20 µg/[kg x min]). The examiner takes advantage of the positive inotropic effects of the sympathomimetic, in that improved contractility in areas previously afflicted with disrupted contractions under low-dose dobutamine stress13,14 is seen as an indication of a viable myocardium.


Atropine Administration

In cases of inadequate increase in frequency (target frequency = 220 – age in years × 0.85) under pharmacological stress, a fractional dose of a total of 1 mg of atropine can be administered intravenously (▶Fig. 3.20).4


Termination of Stress ECG Exams

The same termination criteria apply as with stress ECG exams. In addition, a stress ECG exam is terminated if new wall motion abnormalities or side effects to medications occur.


Fig 3.17 (Continued) Therapeutic closure of intraatrial communication during a TEE exam.

Ao = aorta

LA = left atrium

RA = right atrium

e The left atrial disk is then adapted carefully to the intraatrial septum or defect.

f The right atrial disc is carefully released by slowly withdrawing the wire, thereby closing the defect.

g During TEE monitoring, a stress test is performed by pulling and pushing on the probe before the occluder is detached from the wire.

h The placement and position of the occluder are examined and monitored from different angles while the occluder is still attached to the wire.


Fig. 3.18 Echocardiographic wall motion analysis. Schematic depiction. The blue contour indicates the end diastolic and the red contour, the end systolic border of the left ventricle in a 4-chamber view in a healthy patient and in the presence of various pathologies.


Fig. 3.19 American Society of Echocardiographys modified 18-segment model. Schematic depiction. The numbers indicate the 18 segments.


Fig. 3.20 Atropine administration. Schematic depiction. Stress protocols with dipyridamole and dobutamine. The highlighted minute labels indicate the point of recording.

BW = body weight


Stress ECG in Cases of Congenital Heart Defects

To date, only limited experience exists for stress ECG in the field of congenital heart defects. In addition to malformed semilunar valves or seemingly insignificant morphological narrowing near the isthmus, latent structures can be identified and visualized under pharmacological stress conditions. Increases in heart frequency can likewise be identified by administering Alupent. This could become more important in the future; to date, it has only been possible to perform many invasive and noninvasive exams on children with congenital heart defects while the patients were sleeping or sedated. The German Competence Network for Congenital Heart Defects, among others, has performed the first patient trials under low-dose dobutamine stress conditions after surgical correction of tetralogy of Fallot. The initial results indicate that it may be possible, in the future, to diagnose right ventricular failure at an earlier stage, and thus to provide better treatment management options.19

Furthermore, it is to be expected that quantitative analyses of regional myocardial velocities and deformations under stress conditions will also permit important and interesting conclusions to be drawn regarding abnormal
regional myocardial function or dyssynchronous contractile behavior in the left and right ventricles. In the example case of a boy with aortic valve stenosis and myocardial hypertrophy of the interventricular septum, a significant change in the deformation was visible before and after being subjected to pharmacological stress conditions (▶Fig. 3.21). The new methods of 2-D strain or speckle tracking should also be considered when assessing myocardial function under stress conditions.


Fig. 3.21 Quantitative analyses of regional myocardial velocity and deformation under stress conditions.

a Deformation (strain) in the interventricular septum of a boy with pressure overload in the left ventricle due to an aortic valve stenosis.

b Clear visibility of post-systolic contraction as an expression of possible myocardial fibrosis after a pharmacological stress test using Alupent.


Second-Harmonic Imaging

The image quality in native 2-D echocardiography was improved significantly by implementing tissue-harmonic imaging. Nowadays, this technology is a standard option. When using echo contrast agents (known as micro bubbles),20 the use of second-harmonic oscillation allows the contours of the endocardium to be depicted more clearly and artifacts to be suppressed more consistently.21,22 Special transducers that emit with a single ultrasound frequency and receive with a double ultrasound frequency are used. This approach is recommended for patients who are difficult to image.23 Image quality is not, however, improved immediately adjacent to the transducer (within 3 cm).4 This echo contrast agent also makes it possible to visualize myocardial perfusion.16


Tissue Doppler Echocardiography and Strain Analysis

The Doppler principle is used by these relatively new examination methods in order to quantify myocardial motion (myocardial velocity) by applying special velocity and amplitude filters. Low-velocity (under 20 cm/s),24,25
high-amplitude myocardial signals are recorded, while high-velocity, low-amplitude blood flow signals are filtered out. Both PW and color Doppler are used. Myocardial tissue Doppler has not yet established itself in routine diagnostics. A combined approach using color Doppler to assess myocardial wall motion during stress, however, appears useful. Earlier approaches hope for improved characterization of diastolic wall motion abnormalities,26 meaning also in cases of complex congenital heart defects.27


Tissue Velocity

Tissue velocity is the velocity with which the myocardium moves during the cardiac cycle. Velocity is defined as displacement over time:


where

v = velocity

x = distance

t = time.

Tissue velocity is listed in cm/s. Movement toward the ultrasound probe is considered positive velocity, while movement in the opposite direction is considered negative velocity. The velocity curve is a direct result of the Doppler data (▶Fig. 3.22 and ▶Fig. 3.23).28


Deformation (Strain)

An object’s deformation with respect to its original size is called “strain.” The myocardium is a 3-D body that can deform in any direction during contraction. If we simplify matters and only consider deformation in a single spatial dimension, then average deformation can be expressed mathematically as follows (▶Fig. 3.24)28,29:


where

deformation = strain

L = length at the end of deformation

L0 = length at time t0

The deformation is a non-dimensional size indicated in percent (%). Increased object length compared to the initial length is indicated as a positive value, and a decreased length, as a negative value. Linear dimensions are necessary for calculating deformation (strain). Since no changes in length can be recorded during echocardiographical measurements, the size of the strain must be calculated using velocity gradients. These gradients can be recorded via tissue Doppler—or, more recently, via B-mode images—by dividing the distance in myocardial velocity between two points
(along the ultrasonic beam) at a defined distance from one another by the original distance between those two points. This allows us to calculate the deformation rate (strain rate):


Fig. 3.22 Tissue Doppler ECG. Schematic depiction. Recording of wall velocities and deformations at defined points. Special filters are applied in order to suppress signals from the blood and record only signals from the myocardial wall.


Fig. 3.23 Tissue Doppler ECG. Example schematic depiction of wall velocities and time intervals derived from a tissue Doppler during a cardiac cycle. In addition to determining systolic, early diastolic, and late diastolic velocity, it is also possible to calculate important time intervals, such as isovolumetric contraction and relaxation time. This allows the Tei index to be calculated as a parameter of the global function using the following formula: Tei index = (A – B)/B.

AoV = aortic valve

AT = late diastolic velocity

ET = early diastolic velocity

ICT = isovolumetric contraction time

IRT = isovolumetric relaxation time

SystT = systolic velocity


Fig. 3.24 Myocardial strain or deformation. Schematic depiction. The longitudinal, radial, and circumferential myocardial wall deformations can be determined using special software and a more precise configuration for data acquisition.


where

SR = strain rate = deformation rate

v1, v2 = velocities between two different points separated by distance L.

If an integral forms over any time interval of the strainrate curve, the change in length during this interval is calculated as follows:


where

L(t) = length of object at time t

L0 = length of object at time t0

SR = strain rate = deformation rate

t = time

The equation can be further adapted to reflect the relationship between strain and strain rate, as follows30:

deformation = exp(∫ SR × dt) – 1

where

deformation = strain

SR = strain rate

t = time


Deformation Rate (Strain Rate)

The strain rate is the deformation rate of the myocardial tissue. It is considered to be the deformation of the myocardium within a specific time interval, and uses the unit s-1. Average strain rate can be calculated mathematically as a quotient of deformation and time:


where

SR = strain rate

t = time

Strain represents the degree of myocardial deformation between end diastole and end systole, whereas strain rate represents the velocity of the deformation. Thus, a strain rate of 0.2 describes a 20% reduction in length per second. The maximum systolic strain rate represents maximum deformation during systole.


Speckle Tracking (2-D Strain)

This method of measuring wall velocity is based on a different physical principle than the common Doppler method. Estimated velocity can be determined for any point on the myocardial wall, regardless of angle. In doing so, a search pattern is selected around this point in the first image (frame 1). In the following image (frame 2), the analysis program searches for the new position of the previously recorded point (▶Fig. 3.25). Then the program determines the route over which the
point travelled during this time. Thus, velocity can be calculated using displacement within the sequence of images relative to time. Strain and strain rate can both be determined based on velocity (▶Fig. 3.26).


Fig. 3.25 Speckle tracking or 2-D strain. Schematic depiction. Speckle tracking does not use the Doppler principle to calculate myocardial velocity.


Fig. 3.26 Speckle tracking. The myocardial walls can be recorded semi-automatically using this new method. Wall velocities, deformations, and deformation rates can be calculated in the recorded region using special software.

A = atrial peak

AVC = aortic valve closure

E = early filling peak

S = systolic peak

a Determining wall velocity.

b Determining deformations.

c Determining deformation rates.


3.2 Computed Tomography and Radiation Protection

Willi A. Kalender


3.2.1 Introduction

X-ray CT has been in clinical use since 1972, though it made only minor contributions to cardiac imaging during its first two decades of existence. The scan times were too long to deliver reliable results that could be incorporated into clinical routines. The same was true of MRI, the other tomographic imaging procedure available at that time.

The 1990s, however, brought rapid technological development that continues to this day. The fact that the newest modern technologies can depict the entire heart in less than 1 second with an effective slice scan time of under 100 ms can be attributed to the early development of electron beam CT. This technique of electron beam CT allowed cardiac imaging with a temporal resolution of 50 ms, albeit with limited spatial resolution. In particular, the development of helical CT with the subsequent significant increase in rotational velocity, the development of
multiple-row detector systems, and DSCT (dual source CT) were the primary contributors to cardiac CT as it is performed today.

Accordingly, cardiac CT possesses great potential, especially for the noninvasive visualization of the coronary arteries. To date, it has rarely been used on children with congenital heart defects due to high radiation exposure. The different sections in this chapter will depict and discuss the following subjects: modern CT technology, special technological solutions for CT images of the heart and the resultant image quality, aspects of patient dose and radiation protection, and, finally, recommendations for scan techniques and dose optimization during pediatric cardiac exams.


3.2.2 Modern Computed Tomography Technology

The development of the CT technique and the underlying principles has already been discussed in many publications, including those by Kalender.31 Therefore, this section will provide only a brief discussion of the newest developments relevant to cardiac CT in cases of congenital heart defects. Since 1989, the basis of modern CT has been the spiral scan procedure.32 It is based on modern slip ring technology—whereby the detector and tubes continually rotate around the patient—and has been implemented in all modern CT scanners for more than a decade. Helical CT allows very rapid, continual scanning of the patient with no gaps along the body’s longitudinal axis and, depending on patient compliance, virtually no respiratory artifacts.


Fig. 3.27 DSCT. CT with two complete measurement systems.31

a Schematic depiction of the principle of the scanner.

b Photo of a clinical installation.

The development of multiple-row detectors was another extremely significant step in the development of helical CT: this technology, which allowed four slices to be acquired at once, was made available simultaneously by virtually all manufacturers in 1998. Rapid further development has been noted since then, such as the 16-slice scanner in 2001, the 64-slice scanner in 2004, and numerous other detectors that have been placed on the market since then. At times, this was referred to as the “slice race,” since development seemed to continue more or less independently of clinical requirements.


A further technological development meant specifically to support cardiac imaging was DSCT, namely scanners that use two complete measurement systems, meaning two X-ray tubes and two detectors (▶Fig. 3.27).31,33 Both measurement systems are placed at the same level and attached rigidly to one another so that the data from both systems can be combined and contribute jointly to image generation. Devices designed in this fashion offer decisive advantages: the combination of data measured by both
systems allows the effective scan time to be cut in half. At minimum, a scan range of 180° plus fan angle is needed for image reconstruction. DSCT scans can provide this information after only a 90° rotation. Furthermore, double X-ray power is available. This is of great importance particularly to images with short effective scan times, since this exposes the patient to the required radiation dosage for the shortest possible period of time.

The most important scanner and image quality parameters are summarized in ▶Table 3.3. Nowadays, modern scanners offer rotation times of 0.27-0.35 seconds for a full 360° rotation. This means that for partial scans, the minimum acquisition time per image is 140-200 ms for simple scanners, but only 75-85 ms for DSCT. The minimum slice thickness is 0.500-0.625 mm, which also yields high 3-D resolution (meaning along the body’s longitudinal axis) in all multiplanar and 3-D views. This ensures high, isotropic local resolution; in this context, isotropic means that local resolution is approximately the same in all three spatial dimensions, and thus that the examined volume can be viewed and evaluated 3-dimensionally from any orientation. This is of particular importance when examining the coronary arteries, for example. Resolution may be less than 1 mm, but isotropic resolutions of 0.5 mm can be achieved routinely.


Table 3.3 Features of modern high-performance CT scanners.


Parameter


Value


360° rotation time


0.27-0.35 s


Minimum effective scan time


0.75 s


Slice thickness


0.5-0.6 mm


Slices acquired simultaneously


64 (-320)


Z coverage per rotation


40-160 mm


Scan time for full body exams


2-20 s


Scan range


> 1000 mm


Isotropic local resolution


0.4-0.6 mm


Effective dose E


1-10 mSv


Fig. 3.28 DSCT image of a heart. One-year-old child. Measurement parameter: 75 ms effective slice scan time, 0.26 s overall scan time, 1.1 mSv effective dose.

a Axial reconstruction.

b Coronal reconstruction.

c Sagittal reconstruction.

(Courtesy of Prof. Dr. M. Lell, Erlangen.)


Image quality is generally good (▶Fig. 3.28), and increased acquisition speed does not generally correlate with reduced image quality.34 Another positive effect of increased acquisition speed is that the patient dosage is reduced significantly due to increased table shift. This will be discussed in greater detail later in this chapter.


3.2.3 Technical Approaches to Cardiac Imaging

The main goal of cardiac imaging is to depict the anatomy without blurring or imaging artifacts caused by movement. Thus, the effective scan time must be significantly shorter than the length of a cardiac cycle. Furthermore, it is desirable that the scan time, typically indicated in % of the contraction cycle, can be predetermined and selected freely based on cardiac phase. Precise assignment to a cardiac phase is important for diagnostic purposes, e.g., if it is necessary to depict the heart over the entire cardiac cycle as a 4-D data set for functional analysis, or if the data needs to be collected for the phase of the cardiac cycle involving the least movement—namely end diastole. For this reason, it is generally necessary to record an ECG simultaneously with all image acquisitions of the heart in order to achieve a depiction with few movement artifacts. Two different procedures—prospective ECG triggering and retrospective ECG gating—are implemented in order to ensure assignment to a cardiac phase. In the former, measurements generally begin during diastole, based on the desired ECG time. In the latter, continually acquired CT data is assigned retrospectively to the ECG data collected in parallel in order to reconstruct images.

In principle, prospective ECG triggering is easier to perform and also generally means a lower dose for the patient, since the patient is only exposed to radiation during the desired cardiac phase. Prospective triggering, however, can fundamentally only be performed in cases of low heart rate, and thus frequently cannot be used in children with high heart rates. When taking contraindications into account, it is occasionally possible to administer a beta blocker to reduce heart rate. The movement of the heart or valves cannot, however, be evaluated via prospective triggering.

Retrospective ECG gating procedures, on the other hand, still allow imaging data to be acquired after reconstruction, and thus at the optimal time, thereby increasing the likelihood of good image quality. Furthermore, retrospective procedures allow the reconstruction of temporally resolved 4-D exams—such as exams of the heart’s valves or the ventricles over the entire cardiac cycle—which can then be observed in motion. Dynamic exams of this type have been performed successfully for years via spiral CT with retrospective gating, though this is associated with a higher radiation exposure than prospective triggering. Only a very low table shift or pitch is possible for retrospective gating, since data must be collected for every cardiac phase.31


Fig. 3.29 DSCT image of a heart. 3-D dose distributions calculated using the Monte Carlo approach for the CT exam shown in ▶Fig. 3.28.

a Axial.

b Coronal.

c Sagittal.


For retrospective gating, scans are performed with a pitch of 0.2-0.4, which means overlapping data acquisition and thus generally a higher patient dose. In order to reduce dose, prospectively triggered single scans have been performed sequentially (“step and shoot”) over the past few years, corresponding to a pitch of 1 and thus a lower dose. These scans cannot, however, depict any motion over time, which is necessary for functional analysis.

Broad detector scanners can depict a child’s entire heart in a single rotation and are thus especially attractive, particularly for dynamic exams. For example, a device that offers 320 slices at 0.5 mm each can image approximately 12 cm during a single rotation. While this is not always adequate to depict a full adult heart, it generally suffices for small children. One current drawback of these scanners is their somewhat lower temporal resolution.

DSCT can be implemented with a pitch greater than 3 and/or in conjunction with prospective triggering (▶Fig. 3.28). If high-pitch mode can be implemented, this results in a very high temporal resolution of circa 75 ms, a very short overall scan time of approximately 0.25 seconds (meaning acquisition during a single heartbeat), and a low dose of circa 1 mSv (▶Fig. 3.29). Though high-pitch mode can only be used with a low heart rate, image quality corresponds to that during normal operation.34


3.2.4 Patient Dose and Radiation Protection

We cannot and should not go into great detail in this book regarding the technical and physical aspects of dosimetry in CT. This information is discussed in depth in the literature in this field.31,35,36

The most significant variables are the CT dose index and the dose-length product, which nowadays are displayed on the operation console of every modern CT scanner and, according to the German X-Ray ordinance, must also be documented. The CT dose index is a value specific to each device and scan mode (independent of tube voltage and slice thickness) that is specified by the manufacturer and must be recorded during quality inspection. Constancy tests for the CT dose index performed regularly by technical personnel and/or a medical physicist (generally at least twice per year) ensure that the patient dose does not change. The CT dose index is determined using 10-cm-long ionization chambers in Acrylic Glass phantoms (cylinders made of polymethyl methacrylate with diameters of 16 and 32 cm for skull or thoracic exams, respectively). The CT dose index measured on the phantoms without table shift must then be corrected by the pitch value p for the respective patient exam. The volume CT dose index is calculated by division:


whereby

CTDIvol = volume CT dose index

CTDI = CT dose index

p = pitch.


The volume CT dose index, which is indicated using a dose unit of Gy or mGy, is not used to estimate the patient’s radiation exposure. Rather, this index is only used to document that the device is functioning properly and that the correct exam parameters were chosen for the respective patient exam. The volume CT dose index does, however, allow an initial estimate of local dose (e.g., organ doses in the examined area), provided that the patient data is interpreted correctly (patient thickness compared to the Acrylic Glass phantom).
The doselength product, on the other hand, provides values that allow an initial, preliminary estimate of the patient’s radiation exposure (effective dose). An automatic recording is created for each CT exam specifically for the implemented CT protocol and the selected scan parameters. This recording is then displayed on the CT scanner’s operating panel. The following formula is used:

where

DLP = dose-length product

CTDI = CT dose index

C = tube current-time product

N = number of rotations

M = number of slices

S = slice thickness.

100 = measured over a 100 mm long ionization chamber

w = weighted

i = tissue weighting factor

In essence, this formula means that to calculate the dose-length product, the standardized CTDI value must be multiplied by the mAs value for the tube current-time product of the respective exam scan and the length of the examined area (slice thickness multiplied by the number of slices and rotations). For repeated exams, the product must be added up for all exam indices (index i). This results in values using the unit mGy × cm, which, like the values for the dose-area product in projection radiography, are a measure of radiation exposure, and can be referenced to compare exams in the same section of the body.

Thus, the dose-length product, in addition to the volume CT dose index, is also a basis for defining diagnostic reference dose values. These diagnostic reference dose values have been legally binding in the European Union since 2000 and in Germany since 2002, with the amended X-Ray Ordinance. The diagnostic reference dose values are stipulated by law in Germany by the Federal Agency for Radiation Protection37 and are adapted to the most up-to-date technological methods every few years. Specifying diagnostic reference dose values provides the examiner with comparative values for optimizing his scan parameters for patient dose via benchmarking. The diagnostic reference dose values are determined by the Federal Agency for Radiation Protection, based on national surveys. Thus, a diagnostic reference dose value for a dose size for a specific exam type is compared to the value for the third quartile (75th percentile) while distributing mean value for the individually recorded institutions. This means that, based on specifications, circa 25% of German institutions that perform this exam need to lower their values (for CT, the volume CT dose index, and the dose-length product). Long-established medical authorities regularly check the dose value to be set by the examiner compared to diagnostic reference dose values on a regular basis, in addition to justified indication, adequate image quality, and correct findings. If the statistical mean dose value exceeds the diagnostic reference dose value by more than 30%, supervisory authorities may be informed due to unjustifiably high
exam doses. The medical authority will, however, first attempt to consult with examiners to reduce median dose values.

The actual dose unit relevant to patient risk is the effective dose. This dose can generally be estimated using the Monte Carlo method for average people (average man: 70 kg, 170 cm tall) based on information from the dose-length product.35,38 This procedure is established, and the corresponding 3-D distribution of patient dose can be seen in ▶Fig. 3.29. These distributions determine the dose for individual organs in the direct path of radiation as well as all other organs exposed to radiation. The effective dose is calculated as a weighted median of the relative sensitivity of the individual organs from the whole of organ dose values.31,36 This procedure, which estimates effective dose in this manner using the dose-length product, is established35 and is an approach for estimating doses in a manner appropriate for daily practice.


Procedures for evaluating CT doses in children are not defined and standardized to the same extent as those for CT in adults. The information for volume CT dose indices and dose-length products cannot be easily applied to pediatric exams. The skull and thoracic thicknesses of 16 and 32 cm phantom diameters, respectively (which are used for estimating doses in adults) do not adequately represent the anatomical proportions in children. The common conversion values from the dose-length product for effective dose calculations as listed in the literature should be evaluated critically. To date, the Federal Agency for Radiation Protection has made no statements on this matter. The American Association of Physicists in Medicine provides recommendations for using conversion factors,39 which were also taken into account in ▶Table 3.4. A direct dose calculation based on concrete patient profiles and organ dose values (thus providing an estimate of effective dose) would be more precise (▶Fig. 3.29), though this is not always feasible in everyday practice. Since 2010, it has been recommended that, at minimum, CT manufacturers refer to the smaller Acrylic glass phantom diameter of 16 cm value for the volume CT dose index and the dose-length product shown on the CT during pediatric exams. Special phantom diameters for pediatric CT protocols, a topic of discussion in recent years, have not yet been introduced. It is expected, however, that the Federal Agency for Radiation Protection will soon publish graded reference dose values for pediatric CT exams for children in various age groups. An approach based on size with standard phantoms for all age groups, similar to the procedure for adults (▶Fig. 3.30), might offer additional benefits.38


Fig. 3.30 Dose calculation for various age groups.

Only gold members can continue reading. Log In or Register to continue

Stay updated, free articles. Join our Telegram channel

Apr 12, 2020 | Posted by in CARDIOVASCULAR IMAGING | Comments Off on Technical Basics of Diagnostic and Interventional Imaging

Full access? Get Clinical Tree

Get Clinical Tree app for offline access