Clinical application of functional magnetic resonance imaging (fMRI) based on blood oxygenation level–dependent (BOLD) effect has increased over the past decade because of its ability to map regional blood flow in response to brain stimulation. This mapping is primarily achieved by exploiting the BOLD effect precipitated by changes in the magnetic properties of hemoglobin. BOLD fMRI has utility in neurosurgical planning and mapping neuronal functional connectivity. Conventional echo planar imaging techniques are used to acquire stimulus-driven fMR imaging BOLD data. This article highlights technical aspects of fMRI data analysis to make it more accessible in clinical settings.
Key points
- •
Blood oxygenation level–dependent (BOLD) functional magnetic resonance imaging has gained clinical relevance in the past decade. However, acquiring BOLD data is straightforward, there are numerous considerations with regard to experimental design and analysis.
- •
Analysis has 2 distinct sections: preprocessing and postprocessing.
- •
The preprocessing steps relate to the spatial transformations and operations that ensure the data are properly aligned and in the same coordinate space.
- •
With the data properly rendered, postprocessing techniques are applied to infer statistically significant physiologic changes.
- •
As the field continues to evolve at a rapid pace and newer algorithms are developed it is inevitable that measurement and analysis of BOLD will improve in the years to come.
Learning objectives
- 1.
Discuss the preprocessing pipeline typically used in clinical blood oxygenation level–dependent (BOLD) functional magnetic resonance imaging (fMRI).
- 2.
Highlight the importance of preprocessing BOLD fMRI data before statistical inference.
- 3.
Discuss the significance of quality assurance of clinical BOLD fMRI data.
- 4.
Understanding different statistical tests and algorithms to increase the confidence of fMRI results.
Introduction
fMRI has become ubiquitous in modern cognitive research and clinical imaging communities. Not only is fMRI being used by neuroscientists, psychologists, economists, marketers, and others to enhance clinicians’ understanding of the brain, it has also progressed into several clinicians’ protocols; for example, presurgical brain mappings of language and sensorimotor cortex. The statistical activation maps generated after analysis of functional data can help decrease patient morbidity while facilitating the neurosurgeon’s surgical planning for tumor resection in an effort to improve patient outcome. Acquisition of BOLD fMRI data relies heavily on the T2* changes in blood oxygenation levels, as initially observed by Thulborn and colleagues in test tube samples and later called BOLD by Ogawa and colleagues through in-vivo demonstration with rats. Later it was Kwong and colleagues who showed this effect in human brains. The BOLD effect can be summarized as follows: given the paramagnetic nature of deoxyhemoglobin it is possible to quantify the decrease in MR signal caused by a deficiency in oxygen. In essence, the susceptibility differences between deoxyhemoglobin and surrounding tissue lead to a rapid dephasing of regional spins, thereby decreasing the overall MR imaging signal. In contrast, an increase in oxyhemoglobin or decrease in deoxyhemoglobin leads to an increase in MR imaging signal. This process is the seminal principle involved with BOLD fMRI, and it can be detected using a fast susceptibility sensitivity MR imaging pulse sequence such as a gradient echo (GRE) echoplanar imaging sequence. However, the relative change in signal is only between 3% and 5% on scanners with a field strength of 1.5 T, which makes it difficult to distinguish between brain activation and noise (physiologic and scanner). The implication of this result necessitates the construction of higher field strength scanners (to increase signal) and the use of novel statistical techniques to parse out real signals of interest that represent signals that are different enough from background noise to be classified as significant.
This article focuses on the analysis of BOLD fMRI data. Once acquired, there are many preprocessing steps to temper the data in preparation for statistical testing. The processing procedure includes motion correction, coregistration of functional images to structural, segmentation, normalization to a standard space, and smoothing to increase signal/noise ratio (SNR) and decrease the number of multiple comparisons. The combination of all these steps yields a data set ready for statistical estimation and presentation of the maps of brain activations. Fig. 1 shows an overall work flow chart describing the various steps involved in the BOLD image analysis. In the rest of the article these various steps are explained in detail.
Data acquisition
fMRI data is typically acquired through the use of echo planar imaging (EPI) with a GRE excitation scheme. By using a single excitation pulse and rapidly cycling the frequency encoding gradient, an echo can be generated. Coupled with the blipped phase encoding gradient typical for EPI sequences, fMRI data can be acquired very rapidly. Because GRE sequences are heavily T2* weighted, it is the logical choice for exploitation of the BOLD effect.
Of equal or potentially greater importance to GRE EPI acquisition schemes is the experimental paradigm design. Before data collection it is critical to define the anticipated result explicitly. To design a study that is exploratory rather than hypothesis driven is to invite confusion and lack of confidence; the hypothesis ultimately dictates the statistical parameters used to threshold and display the results. For example, consider a study dealing with the cognitive requisites for decision making, which involves the executive function networks. In such an experiment, clinicians would expect to see activation in the orbital frontal cortex (OFC). If the results show OFC activation after analysis, that provides an additional level of confidence because it coincides with the anticipated response. However, the hypothesis also influences the choice of acquisition parameters. Continuing with the previous example, if activation in the OFC is expected certain parameters need to be altered. The OFC is a high-susceptibility region and it would be advantageous to reduce the echo time of the EPI acquisition to collect the signal before spin dephasing attenuates the local signal. The choice of hypothesis and acquisition protocol is study dependent and both are important to optimize the results of a BOLD fMRI study.
Optimization of the acquisition protocol is of paramount importance because of the inherent artifacts associated with EPI sequences. Ghosting, chemical shift, and blurring from T2* decay are the primary sources for EPI image degradation. Using parallel imaging techniques and/or restricting the k-space window by reducing the echo train length or interecho spacing can substantially mitigate artifact generation. The acquisition field of view (FOV) prescription assignment can also be altered to avoid motion-related effects. In the past the FOV has been prescribed tangential to the plane connecting the anterior commissure and posterior commissure to help facilitate the efficiency of image registration algorithms to routine T1-weighted or T2-weighted structural images. However, given the advances in algorithm design, more flexibility now exists. For example, prescribing the FOV at a 20° to 30° tilt to avoid the orbit can prevent the wrapping of eye-related motion to the cerebellum and avoid high-susceptibility regions.
In terms of the functional paradigm design and optimization there are 2 primary modalities: block-related and event-related designs. Block designs are the clear choice from a clinical perspective because of the ease of development and simplicity of analysis. A block design is characterized by a periodic boxcar function ( Fig. 2 ) that alternates between cycles of activity and rest. Given the repetitive nature of block-related designs, stronger signals can be obtained because of averaging of signals arising from similar trials during a block. Block designs are more forgiving in that the inherent averaging that occurs tends to have less impact when stimuli are missed. However, excessive repetition and/or trial duration can cause habituation. In contradistinction with the simplicity of block designs are event-related paradigms.
The event-related paradigms are popular among research-oriented groups because stronger correlations tend to exist. The implementation of event-related designs involves the delivery and presentation of stimuli at either specific or random time points. Although these designs are capable of parsing and isolating neural activity caused by a focused task, they are substantially more tedious to analyze and more sensitive to timing issues. Each paradigm design has its advantages and the choice is up to the end user based on the study/acquisition goal.
Another consideration when setting up functional protocols is the incorporation of a GRE acquisition to map field inhomogeneities. Field mappings can generate both phase and magnitude images that can be used to correct or visualize distortions caused by susceptibility and inhomogeneous fields. An additional BOLD scan that is relevant in a clinical setting is to challenge the brain using breath holding, thereby causing a transient increase in blood carbon dioxide levels. This process induces vasodilation and a subsequent increase in cerebral blood flow, which can be used to map the cerebral vascular reserve. This scan can also be used for screening patients because these maps may also provide additional information regarding the neurovascular uncoupling in patients with brain tumors.
Neurovascular uncoupling
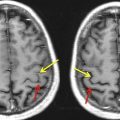
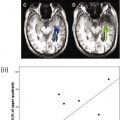
The physiologic underpinning of BOLD functional imaging relates to cerebral blood flow (CBF). It has been shown that in response to stimulus an increase in CBF manifests locally to regions of neuronal activation. Typical brain functioning relies on cerebrovascular autoregulation; the process by which normal blood flow is maintained despite dynamic physiologic stressors. This autoregulation modulates blood flow by varying vascular resistance, which is a function of the cerebrovascular reserve. If blood flow augmentation is altered because of a tumor, diseased/occluded vascular networks, or a steal phenomenon from an arteriovascular malformation, then neuronal activation is adversely affected. This outcome has the undesirable consequence of yielding false-negative results with the potential for gross underestimation of cortical activation. In a clinical setting this could be detrimental to neurosurgical patients because proper surgical planning is contingent on accurate localization of the eloquent cortex containing language and sensorimotor regions. Neurovascular uncoupling is highly prevalent for patients with low-grade gliomas and can provide a more comprehensive evaluation of presurgical mappings.
BOLD data preprocessing steps before statistical analysis
With an understanding of the physiologic basis for fMRI signal generation as well as optimized considerations for acquisition, the next step is to extract the BOLD signal from the T2* images. Although it is possible simply to begin statistical testing on the raw functional data, the results would lack confidence and statistical validity. Subject motion, time discrepancies between multislice acquisitions, misregistration of anatomic overlays, and low SNR are potential sources of significant error and require attention before the statistical analysis. These corrections are referred to as preprocessing steps and are essential to obtain reliable BOLD data. The various postprocessing steps and methods currently used in BOLD imaging are discussed later.
Distortion correction
As mentioned earlier, it helps to acquire GRE field maps characterizing both the magnitude and phase information associated with local field inhomogeneities. This information can be used to review potential areas in the BOLD image that may be susceptible to inhomogeneities and potentially correct for signal attenuation as a result of susceptibility differences created by B 0 inhomogeneities if present in the acquired T2* images.
Related posts:
 Clinical Applications of Functional MRI
 Foreword
Resting-State Blood Oxygen Level–Dependent Functional MR Imaging for Presurgical Planning
Foreword
Resting-State Blood Oxygen Level–Dependent Functional MR Imaging for Presurgical Planning
 Blood Oxygen Level Dependent Functional Magnetic Resonance Imaging for Presurgical Planning
 Pretherapeutic Functional Magnetic Resonance Imaging in Children
 Applications of Blood-Oxygen-Level-Dependent Functional Magnetic Resonance Imaging and Diffusion Tensor Imaging in Epilepsy
Stay updated, free articles. Join our Telegram channel

Full access? Get Clinical Tree


