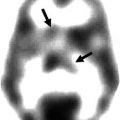
Fig. 8.1
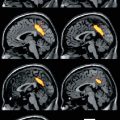
(a) The default network of the human brain as it was originally identified in a meta-analysis of nine positron emission tomography (PET) studies (132 healthy young adults) from Shulman et al. (1997) (Reprinted with permission). The colored brain regions were more active in passive task states as compared to active tasks states. (b) The default network identified using functional connectivity MRI (fcMRI) while a single subject was resting in the scanner. The color scale indicates functional connectivity (Pearson correlation coefficient after Fishers r-to-z transformation) with the signal from a seed region placed in the posterior cingulate cortex as indicated by the green arrow (Adapted from Van Dijk et al. (2012b))
Brain regions associated with the default network are the posterior cingulate cortex, medial prefrontal cortex, inferior parietal lobule, lateral temporal cortex, and regions of the parahippocampal and entorhinal cortex (Buckner et al. 2008; Greicius et al. 2003; Raichle et al. 2001; Shulman et al. 1997; Ward et al. 2014). The relative ease of measuring this network during rest using currently standard neuroimaging techniques, in combination with initial findings of vulnerability of the default network to neurological and psychiatric disease states, caused the default network to be a popular brain network to study which, in turn, led to an exponential increase in the number of papers published each year (see Fig. 8.2).
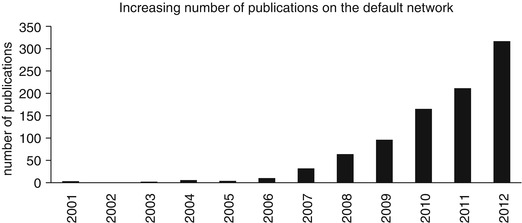

Fig. 8.2
The number of publications per year regarding the default network has shown a steady increase since the publication by Raichle et al. (2001) in which the term default mode was associated with the network that was described by Shulman et al. (1997). The graph shows the number of publications per year for the following query: “default network” OR “default mode network” OR [“default mode” AND “brain function”] (Source http://ligercat.ubio.org/, December 20, 2012)
There is growing interest in measuring structural connectivity of the default network and in other neuronal systems. While measures of brain structure, such as structural brain connectivity using diffusion magnetic resonance imaging, are beyond the scope of the present chapter, we would like to mention that several large multisite collaborative projects, such as the “Human Connectome Project” in the United States and the “Developing Human Connectome Project” and “Human Brain Project” in Europe, are expected to shed more light on the complex relationship between brain structure and function during health and disease states.
8.2 Measuring Default Network Function
The main methods for the assessment of default network function are (1) observing regions of deactivation during attention-demanding cognitive tasks, (2) probing the network with tasks that specifically rely on default network activation, (3) assessment of functional connectivity in terms of coherent BOLD fMRI signals either during task states or during the resting state, and finally (4) using FDG-PET to determine the molecular function and metabolic connectivity.
8.2.1 Deactivation During Attention-Demanding Cognitive Tasks
While the most commonly used clinical radiotracer for the assessment of brain function is 18 F-FDG (18-fluorodeoxyglucose for measuring glucose consumption), scientific activation studies performed in healthy young adults in the late 1980s and into the 1990s primarily used H2 15O (oxygen-15-water for measuring cerebral blood flow). Those studies were aimed at mapping cognitive functions such as language and decision making under attention-demanding experimental conditions. The half-life of H2 15O is only 122 s (as opposed to 110 min for 18 F-FDG), which made it suitable for repeated assessment of blood flow during different experimental conditions within one scanning session. Using H2 15O-PET, many brain regions were identified that were implicated in a range of cognitive abilities. As mentioned in the previous section, an analysis by Shulman et al. (1997) of data of several PET experiments indicated that a common set of brain regions – which was only later termed the default network – showed consistent deactivation during various attention-demanding cognitive tasks. This means that those regions are more active in passive task conditions relative to many active task states. When it turned out that changes in blood oxygenation, as indirect measure of neuronal function, could be determined using BOLD fMRI without the use of radiotracers (Kwong et al. 1992; Ogawa et al. 1992), fMRI became the method of choice for studying brain function in healthy young adults. Parametric manipulation of task difficulty during BOLD fMRI experiments confirmed that the more a person is focused on an attention-demanding task, the more deactivation of the default network occurs (McKiernan et al. 2003).
8.2.2 Tasks That Rely on Default Network Activation
In addition to attention-demanding tasks that deactivate the default network, one can also ask people to perform tasks in the scanner that specifically activate the default network. Tasks relying on conceptual knowledge, moral decision making, the ability to think what other people are thinking (i.e., theory of mind), remembering the past, and imagining the future are all associated with activation of default network regions and are therefore considered core functions of the network (e.g., Addis et al. 2007; Binder et al. 1999; Buckner et al. 2008; Mitchell et al. 2006); Shenhav and Greene 2012). Another suggested role of the default network is the exploratory monitoring of the external environment, a function that is suspended when a person is engaged in a task that requires focused attention (Gusnard et al. 2001; Shulman et al. 1997). In situations when people are left to think to themselves, the default network seems to integrate information from past experiences, replay events from memory, and construct mental simulations about possible future events (Buckner et al. 2008; Schacter et al. 2007).
8.2.3 Assessment of Functional Connectivity
Functional connectivity, defined as temporally correlated remote neurophysiological events (Friston 1994), can be estimated within individual subjects using functional neuroimaging measures such as EEG, MEG, and fMRI. The most commonly used method for assessing brain functional connectivity is fMRI and is often referred to as functional connectivity MRI (fcMRI). Using fcMRI, patterns of synchronous fluctuations in the blood oxygenation level-dependent (BOLD) signal are measured (Biswal et al. 1995). These analyses involve data processing, including steps to remove unwanted signals such as physiological noise caused by heart rate, breathing, and head motion during the scan. If, after data preprocessing, two or more brain regions show a similar pattern in fluctuations over time, we designate these regions as being functionally connected. While functional connectivity does not equate to structural connectivity, accumulating evidence suggests that fcMRI can be used as noninvasive probe of integrity of neuronal systems (for review, see Van Dijk et al. 2010).
Biswal and colleagues in 1995 used BOLD fMRI to show that a region in the left somatomotor cortex exhibits signal fluctuations that are highly correlated with signal fluctuations in the whole somatomotor system including contralateral somatomotor cortex (Biswal et al. 1995). It is important to realize that the somatomotor system exhibits these coherent signal fluctuations when a person is simply resting in the scanner, that is, when a person is not engaged in active behavior that relies on the somatomotor system. This technique of mapping functional systems by analyzing coherent fluctuations in remote brain areas increased in popularity when Greicius et al. (2003) decided to place a region of interest – also called a “seed region” – in a core node of the default network. When they extracted the signal from that seed region and computed the correlation strength between the seed and every other voxel in the brain, the results robustly revealed the default network (Greicius et al. 2003). During those years, data-driven techniques that do not rely on choosing a specific seed region also revealed coherent activity patterns in large-scale brain systems such as the somatomotor and default network (Beckmann et al. 2005; De Luca et al. 2006). While it is relatively easy to measure these networks while people are resting in the scanner, it is important to note that most networks, including the default network, also show functional connectivity during many tasks (Fransson 2006; Smith et al. 2009; Van Dijk et al. 2010). This means that functional connectivity methods can be applied to data acquired during rest but also during active task conditions (for applications and discussion, see (Fair et al. 2007). When one is interested in how functional connectivity changes during different conditions of a task, other methods, such as psychophysiological interaction analysis, are suitable (Friston et al. 1997; McLaren et al. 2012).
Over the last years, different authors have focused on different networks as measured during rest. Besides the default network, often-mentioned systems are those involved in keeping attention focused on a task (dorsal attention network or salience network; see, e.g., (Fox et al. 2005; Seeley et al. 2007), respectively) or networks performing executive control functions such as allocating attention to one stimulus and then actively switching attention to another stimulus when cued to do so (Seeley et al. 2007; Vincent et al. 2008). Efforts of determining an exact number of meaningful neuronal networks will offer different results based on the methods employed and the behavior of the subject during the scan. Moreover, while these fcMRI metrics show fairly stable measurements from one session to the next (e.g., Shehzad et al. 2009; Van Dijk et al. 2010), the correlational measures do not capture moment to moment changes in coherence (Chang and Glover 2010).
Potential pitfalls when using fcMRI to determine functional network integrity are contamination of the BOLD signal by the before-mentioned sources of physiological noise such as heart rate, respiration (Birn et al. 2006; Chang and Glover 2009), and head motion (Power et al. 2012; Satterthwaite et al. 2012; Van Dijk et al. 2012a). It is crucial that investigators that apply fcMRI are aware of these confounding factors since they often bias results in studies where patients are compared to healthy controls in the direction of hypothesized effects (e.g., one might find lower coherence in the default network in the patient group, while the patient group also moved more during the scan). Discussion of additional caveats when working with measures of functional network integrity and interpretation of functional network changes when structural brain changes are also present are beyond the scope of this chapter but are topics of active research.
With the increasing availability of high-quality neuroimaging datasets and advances in computational approaches to complex biological systems, a field has emerged in which the brain is treated as graph with brain regions as nodes and functional or structural connections as edges or links between the nodes (Bullmore and Sporns 2009; Drzezga et al. 2011; Rubinov and Sporns 2010; Sepulcre et al. 2010; Stam and Reijneveld 2007; van den Heuvel et al. 2008). Graph theory applied to structural and functional brain images has shown that the human brain is shaped by an economic trade-off between minimizing costs and maximizing efficiency of information processing whereby the brain exhibits properties of a complex network that sits in between a regular low-cost/low-efficiency lattice network and a high-cost/high-efficiency random network (see Fig. 8.3).
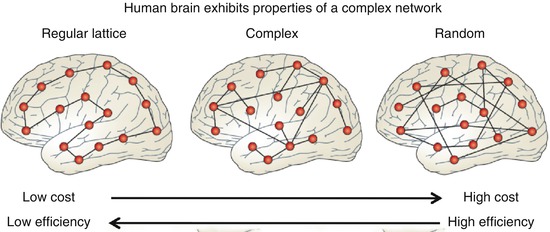

Fig. 8.3
The human brain exhibits properties of a complex network that sits in between an orderly regular lattice structure and an unorderly random network. The healthy human brain shows a balance between minimizing costs and maximizing processing efficiency. While the default network is known to include many key relay stations that are important for this cost/efficiency trade-off, graph theoretical measures of the human brain go beyond the default network and are starting to show promise to indentify changes in brain network structure in neurological and psychiatric disease states (Adapted with permission from Macmillan Publishers Ltd: Nature Reviews Neuroscience, Bullmore and Sporns, copyright 2012)
While complex brain network analysis techniques often take the whole brain into account and are not necessarily aimed at identifying (just) the default network, it turns out that the brain’s main cortical hubs largely – but not fully – overlap with default network regions (see Fig. 8.4). One potential role of these hub regions is that they act as relay stations for information processing serving as connector regions between different (sub)networks. Other complex brain network analyses suggest that default network regions display extensive local connectivity between and within certain bordering brain areas (see Buckner et al. 2009; Sepulcre et al. 2010; Tomasi and Volkow 2010 for discussion). Possible interpretations of complex brain network analysis and utility of metrics that determine abnormal connectomics due to neurologic and psychiatric disease states are currently under way (Bullmore and Sporns 2012; Rubinov and Sporns 2010).
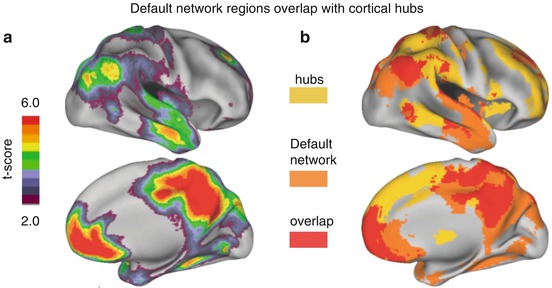

Fig. 8.4
(a) Map of the default network as voxels exhibiting greater activity during blocks of passive fixation than during externally directed tasks. Six independent fMRI blocked-design studies were included, each comprising 30 participants matched on age and gender for a total of 180 healthy young adults. The scale is average t-score. The map of the default network is consistent with prior meta-analyses (e.g., Shulman et al. 2007 as shown in current Fig. 8.1a). (b) Overlap of the default network with a map of degree connectivity representing cortical hubs (Adapted with permission from Buckner et al. (2009))
8.2.4 Molecular Function and Metabolic Connectivity
The abovementioned fcMRI methods allow functional connectivity between brain regions to be estimated within individual subjects. 18F-FDG-PET does usually not provide information regarding change in neuronal functional over time but rather offers a snapshot reflecting synaptic glutamatergic activity which then serves as summary measure of neuronal function over the duration of the scan. This means that within one subject, connectivity between two given regions (region A and B) cannot be computed using FDG-PET as in both regions only a single value will be obtained. However, a correlation between the values in region A can be computed with the values in region B across subjects. This approach using PET imaging was used before the availability of fMRI BOLD methods (e.g., Horwitz et al. 1984; McIntosh 1999), and the same concept has successfully been applied to structural MRI data of older adults with and without dementia (e.g., He et al. 2008; Seeley et al. 2009). Recently, across-subject analysis of FDG-PET data was termed “metabolic connectivity” in a study by Morbelli and colleagues (Morbelli et al. 2012). They demonstrated reduced resting metabolic connectivity in prodromal Alzheimer’s disease both in hypometabolic and nonhypometabolic areas and suggested that metabolic disconnection (reflecting early diaschisis) may antedate remote hypometabolism (early sign of synaptic degeneration) (Morbelli et al. 2012).
Stay updated, free articles. Join our Telegram channel

Full access? Get Clinical Tree


