The Kidneys
Zsolt Szabo
Jinsong Xia
William B. Mathews
Rationale
The successful application of positron emission tomography (PET) in cancer is expected to translate to other diseases. Considerable progress can already be observed in cardiac and neurological PET applications. Other potential nononcological uses of PET imaging may include diseases of the kidneys, lungs, and liver. With its high sensitivity for detection of molecular signatures in vivo, PET could be useful for solving many clinical problems. Examples of potential pulmonary applications of PET include the diagnosis, management, and follow-up of cystic fibrosis, α-1 antitrypsin deficiency, idiopathic pulmonary fibrosis, primary pulmonary hypertension, asthma, chronic obstructive pulmonary disease, chemical lung injury, and infections in immune-compromised persons. Potential applications in hepatology would be in the management of viral hepatitis, acute liver failure, and liver transplant complications.
Areas of nephrourology that could benefit from PET include the management of acute or chronic renal failure, proteinuria, kidney stones, urinary tract infections, and polycystic kidney disease. Of increasing importance is the understanding and management of interconnected disorders where strategies of disease management encounter strategies of disease prevention. Areas that could be included are the metabolic syndrome, diabetes, and hypertension, with the complications of renal insufficiency, cardiomyopathy, and cerebrovascular disease. To apply PET in these important clinical areas researchers will have to improve their understanding of the underlying molecular mechanisms and match them with the unique features of PET chemistry and imaging technology.
PET could already replace the gamma camera for imaging renal blood flow or cortical function. The spatial resolution of modern PET scanners is 5 to 6 mm at a counting sensitivity of 30 cps/Bq/mL (1), quite adequate for imaging the kidneys. Image acquisition at 1- to 2-second frame times is now possible for rapid dynamic studies, while static scans of outstanding quality can be obtained in 3 to 5 minutes. The recently evolving technique of list mode acquisition will permit reconstruction of time intervals with the best signal to noise ratios. Iterative reconstruction algorithms are also available that can handle PET scans with high activity gradients attributable to large perfusion differences between the cortex and medulla or to the accumulation of radiopharmaceuticals in the pelvocalyceal system.
At the present time clinical protocols are not available for routine PET imaging of the kidneys. PET has been used occasionally to diagnose renal cancer, but this imaging modality has limited sensitivity for this disease (2). An important area that needs better imaging sensitivity is the diagnosis and follow-up of renovascular hypertension. Although the accuracy of digital subtraction angiography (DSA) and even of computed tomography angiography (CTA) for diagnosis of renal artery stenosis is high (3,4,5), these methods involve the use of potentially nephrotoxic contrast agents and ionizing radiation. Magnetic resonance angiography (MRA) can also be used for diagnosis of renal artery stenosis. It is considered to be noninvasive and safe and quite accurate in diagnosing renal artery stenosis, yet it is apparently less accurate than, for example, captopril renography in assessment of its hemodynamic significance (6). The experience with captopril enhanced MR is extremely limited (7). Diagnosis of renovascular hypertension, prediction of the outcome of revascularization, detection of reperfusion injury, and early detection of a hemodynamically significant restenosis are important unanswered problems. Another significant problem is the assessment of the hemodynamic significance of arterial stenoses in the presence of duplicated or polar renal arteries (8,9,10).
PET techniques can be grossly divided into functional and molecular imaging applications. Functional imaging techniques that await immediate clinical application include determinations of regional renal blood flow and glomerular filtration. Molecular imaging of the kidneys is at best in an experimental stage. In this chapter renal imaging techniques will be classified according to the kinetic properties of the radiopharmaceuticals adhering to the following containment hierarchy of terms: (a) tracer: any radiolabeled molecule used for PET or single-photon emission computed tomography (SPECT) imaging; (b) radiopharmaceutical: any drug or druglike organic molecule used as tracer; (c) radioligand: a radiopharmaceutical that binds with high affinity to molecular recognition sites or serves as a substrate or pseudosubstrate of transporters and enzymes. The expression substrate can be used for tracers that in addition to binding to recognition sites also undergo
chemical changes (if the target protein is an enzyme) or spatial translocations (if the target protein is a transporter). A pseudosubstrate is one that retains some but not all the characteristics of the substrate, an example is fluorine-18-fluorodeoxyglucose ([18F]-FDG).
chemical changes (if the target protein is an enzyme) or spatial translocations (if the target protein is a transporter). A pseudosubstrate is one that retains some but not all the characteristics of the substrate, an example is fluorine-18-fluorodeoxyglucose ([18F]-FDG).
Tracer Kinetic Models
Tracer kinetic models have been used to understand the biological behavior of radiopharmaceuticals and to derive quantitative parameters of radiopharmaceutical accumulation, binding, and clearance. Ideally kinetic parameters are directly or indirectly related to clinically useful physiological measures of renal blood flow, glomerular filtration, tubular transport, or receptor density. A tracer kinetic model is a simplified representation of the biological behavior of the radiopharmaceutical and serves as a logical link between the PET measurement and its computerized analysis. An algorithm, on the other hand, is the algebraic reformulation of the model optimized for the computational steps needed for derivation of quantitative parameters. Algorithms usually also include the processing tools needed to deal with image noise or error progression and for maximization of the accuracy of the estimated parameters.
There are three basic types of tracer kinetic models: stochastic models, distributed models, and compartmental models (11), and all three models can be applied in renal PET studies. The most complicated one is the distributed model, which typically includes many details of the measured biological process. Due to the large number of parameters needed for process description, distributed models are seldom used (12). Compartmental modeling is much more widespread because it is based on generalizations that permit its application to a large number of pharmacokinetic processes. The third one, the stochastic model (13), makes no assumptions about the inner structure of the kinetic process and treats it as a “black box” with a response function brought forth by an input function. The stochastic model provides the impulse response function, a basic function that can be used to describe the response to any time concentration profile of the radiopharmaceutical that enters the organ via its feeding artery. Stochastic and compartmental models share two fundamental assumptions for tracer kinetics: (a) linearity (doubling the injected dose results in doubling of the organ activity); and (b) time invariance (blood volume, blood flow, and binding processes remain constant during the time of imaging). The stochastic model cannot quantify the exchange between the individual compartments, but it can still provide useful pharmacokinetic parameters. Such parameters are the tracer distribution volume, which is the area under the impulse response function, the mean transit time, which is the first momentum of the impulse response function, or the retention fraction, which is the ratio of a value at a chosen time point and the peak value of the impulse response function.
The operational equation that describes the course of a radioligand in the renal parenchyma, the convolution integral between the arterial input function, and the impulse response function is common to both the stochastic and the compartmental model:
where, CT(t) equals the parenchymal tissue activity curve, CA(t) equals the input function, f(t) equals the tissue impulse response function, and ⊗ is the operation of convolution.
CT(t) is derived from the dynamic PET images of the organ; CA(t) is most accurately measured by rapid arterial blood sampling, but it is also often approximated by time activity curves derived from the abdominal aorta (or the cardiac blood pools if the myocardium is the organ of interest). The capability to correct the noninvasive input function for confounding physical sources of error, such as partial volume effects, or biological sources of error, such as red blood cell binding or protein binding, will have a direct influence on the accuracy of quantitative analysis. The process of convolution can be reversed by deconvolution analysis if one needs to obtain f(t) from CT(t) and CA(t). Since the activity in the renal vasculature is not negligible, total tissue activity also includes intravascular activity CA(t) weighted by the blood volume:
Blood volume (BV) is typically expressed in units of milliliters blood to milliliters tissue or milliliters of blood to grams of tissue. Equation 14.2.2 represents the first steps leading away from the stochastic model toward the compartmental model. BV can be estimated from the tissue activity curve if included in the compartmental model, or it can be approximated with an arbitrary number, which is approximately 5% in the brain and 15% in the kidneys. This number may even be higher. Although not yet established for the human kidney, in the dog kidney the parenchymal blood volume is about 20% (14). Blood volume in the kidneys depends on the highly variable glomerular volume, which is governed by the tubuloglomerular feedback mechanism (15).
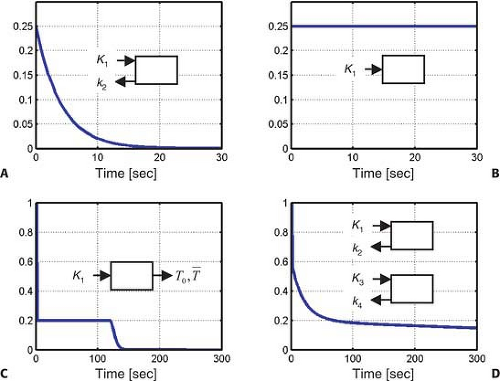
Renal radiopharmaceuticals can be divided into four groups according to their impulse response function (Fig. 14.2.1): freely diffusible tracers, chemical microspheres, tracers with urinary excretion, and radioligands. Fig. 14.2.1 shows the four corresponding impulse response functions. The impulse response function is the simplest time activity curve (also called the primitive or base function) that would be measured in an organ after instantaneous injection of a radioactive bolus into the feeding artery of the organ excluding any subsequent recirculation of radioactivity. The tracer can be trapped in the organ (Fig. 14.2.1B), it can return to circulation rapidly (Fig. 14.2.1A) or slowly (Fig. 14.2.1C,D), but in either of these cases the first point of the impulse response function will always be its maximum value, fmax. The shape of the rest of the impulse response function is determined by the degrees of retention, trapping, or washout.
Freely Diffusible Tracers
Radiopharmaceuticals with rapid exchange between blood and renal parenchyma such as oxygen-15 ([15O])-labeled water follow a simple kinetic model with a single parenchymal compartment and two compartmental rate constants, K1, which describes the uptake and k2, which describes the washout of the tracer. The parameter K1 is equivalent to flow x extraction, FE. Extraction of water is considered complete so that K1 is identical to blood flow. The most exact way to measure the input function involves the use of an automatic blood sampler that propels the arterial blood through a coincidence detector cross-calibrated and synchronized with the PET scanner (16). Even this highly accurate input function suffers from distortions such as the delay and dispersion of the radioactive bolus (17). The parameter k2 is less affected by delay and dispersion than K1 and can also be used to estimate renal blood flow since the distribution
volume of water DV = K1/k2 is approximately 1 in this organ (18). Glomerular filtration of 20% of the water entering the kidneys will contribute a slow kinetic process to this rapid washout model first because of the transportation of this water within the tubular lumen and, second, because of partial recycling of water within the loop of Henle. These processes may result in an apparent water distribution volume larger than 1.
volume of water DV = K1/k2 is approximately 1 in this organ (18). Glomerular filtration of 20% of the water entering the kidneys will contribute a slow kinetic process to this rapid washout model first because of the transportation of this water within the tubular lumen and, second, because of partial recycling of water within the loop of Henle. These processes may result in an apparent water distribution volume larger than 1.
As early as in 1971, a positron-emitting radiopharmaceutical, [15O]-labeled water was injected into the renal artery of experimental animals, and its washout was measured with an external radiation detector (19). Using the kinetic model of inert gases, renal blood flow was obtained from the washout rate of the tracer. Fig. 14.2.1A shows the impulse response function of [15O]-water when the volume of interest only contains one tissue type, either the cortex or medulla. Since it is impossible with external detectors and without tomographic imaging capabilities to separate these two tissue components, the time activity curve looked rather like the one shown in Fig. 14.2.1D. A few assumptions were incorrect with those early studies. First, the assumption that [15O]-water behaves in the kidneys like an inert gas such as xenon-133 ([133Xe]) was improper. This was not correct since water is likely the most ubiquitous molecule present in biochemical reactions. Second, an erroneous assumption was that the input function was assumed to be an infinitesimally short bolus (in mathematical terms a δ function). This was incorrect since recirculation of water is significant if the measurement is longer than the renal vascular transit time. No algorithm was provided for solving a convolution integral. The measured time activity curve was fitted with a simple biexponential function whereby, following Fig. 14.2.1D, k2 described the washout rate from the cortex and k4 described the washout rate from the medulla. Astonishingly, the measured values were quite realistic and showed a cortical blood flow of 370 mL/min/100 g and a medullary blood flow of 55 mL/min/100 g (19).
With current PET scanners renal perfusion imaging can be performed in dynamic mode, and time activity curves can be analyzed in every voxel of the study. To achieve this in human subjects, 1,110 to 1,850 MBq (30 to 50 MCi) [15O]-water is injected intravenously, and PET scans are acquired at 3-second steps over 90 seconds. In humans the input function is obtained from a region of interest placed in the center of the abdominal aorta and is corrected for
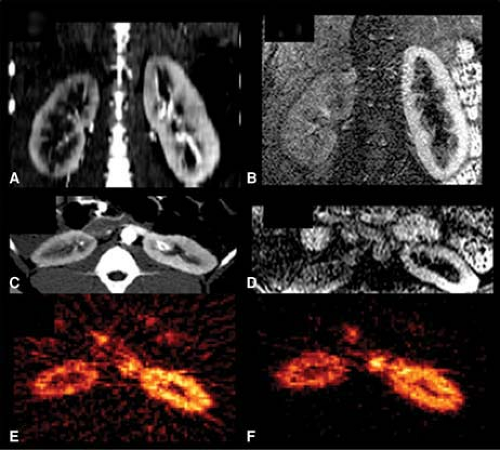
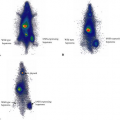
partial volume effects. In healthy individuals the estimated renal blood flow with this method is 340 mL/min/100 g, which is similar to the results of probe measurements. Cortical blood flow is significantly decreased in renal diseases (20). Fig. 14.2.2A illustrates the reduced accumulation of [15O]-water in experimental renovascular hypertension.
partial volume effects. In healthy individuals the estimated renal blood flow with this method is 340 mL/min/100 g, which is similar to the results of probe measurements. Cortical blood flow is significantly decreased in renal diseases (20). Fig. 14.2.2A illustrates the reduced accumulation of [15O]-water in experimental renovascular hypertension.
Chemical Microspheres
Rubidium-82 Chloride
Rubidium-82 ([82Rb]-chloride, and nitrogen-13 ([13N])-ammonia are radiopharmaceuticals with high parenchymal extraction and insignificant washout rates. The kinetic model of these tracers is the most simple one since it includes only an uptake parameter but no washout parameter (Fig. 14.2.1B). This tracer trapping model is identical to the distribution model of radioactive microspheres, which are typically injected into the left atrium or left ventricle of experimental animals (21,22).
Radioactive microspheres are retained in the capillaries of organs according to the distribution of cardiac output (23,24,25,26). Chemical microspheres behave similarly to true microspheres since, to a large degree, they also are trapped in the organs, but they accumulate inside the cells rather than within the capillaries. The chemical properties and biological behavior of these radiopharmaceuticals are responsible for their tissue trapping. The Gjedde-Patlak graphical method of irreversible tracer binding has been used for quantification of tracer trapping (27,28). The slope of this plot, Ki is directly related to rate constants of tissue uptake K1, tissue incorporation k3, and inversely related to the rate constants of tracer release from the reversible component k2 + k3:
If washout from tissue (determined by k2) is negligible, the slope is identical to K1, which in case of microspheres with 100% extraction becomes equivalent to renal blood flow (29). In reality, the extraction fraction of chemical microspheres is <100% since there is always some tracer backflow before retention is accomplished. If, however, trapping is significant though <100%, the Gjedde-Patlak plot will achieve linearity at the time point when plasma activity and reversible tissue activity reach equilibrium.
Rubidium-82, like thallium-201, is a potassium analogue. Rubidium-82 is a positron emitting radioisotope obtained from strontium-82 ([82Sr]) in a generator and has a physical half-life of 75 seconds and a maximum positron energy of 3.35 MeV. The high positron energy results in a longer positron range, and together with the rapid decay, makes this isotope less optimal for imaging organ perfusion. Despite certain disadvantages, [82Rb] is successfully used for cardiac imaging and can also be used for imaging the kidneys. Rubidium-82 is injected in a dose of 40 to 60 MCi (1,480 to 2,220 MBq). For quantification of split renal perfusion or for detection of regional cortical perfusion defects a single static image can be acquired (Fig. 14.2.2F), but a dynamic PET protocol is needed for detailed quantitative analysis. During dynamic PET imaging, 2- to 3-second frames are acquired (30).
The kinetic model from Fig. 14.2.1A was used to fit the time activity curve of [15O]-water (Fig. 14.2.3A) and the kinetic model from Fig. 14.2.1B was used to fit the time activity curve of [82Rb]-chloride (Fig. 14.2.3B). Assuming a density of renal tissue of 1 g/mL using [82Rb] the renal blood flow in the right (R) kidney was 467 mL/min/100 g and in the left (L) kidney 619 mL/min/100 g with a R/L ratio of 0.75. Measurement with [15O]-water yielded a right kidney blood flow of 222 mL/min/100 g, a left kidney blood flow of 422 mL/min/100 g, and a R/L ratio of 0.53. The input function was obtained from the region of interest (ROI) of the aorta and was not corrected for partial volume effects, which is probably the most
important factor to explain the high blood flow values. The ROIs were drawn separately for the [82Rb] and [15O] studies which contributed to the different blood flow values obtained with the two isotopes. To establish either one of these two tracers in clinical studies, and [82Rb] is the more likely candidate, it will be important to standardize and validate the procedures of imaging and image analysis.
important factor to explain the high blood flow values. The ROIs were drawn separately for the [82Rb] and [15O] studies which contributed to the different blood flow values obtained with the two isotopes. To establish either one of these two tracers in clinical studies, and [82Rb] is the more likely candidate, it will be important to standardize and validate the procedures of imaging and image analysis.
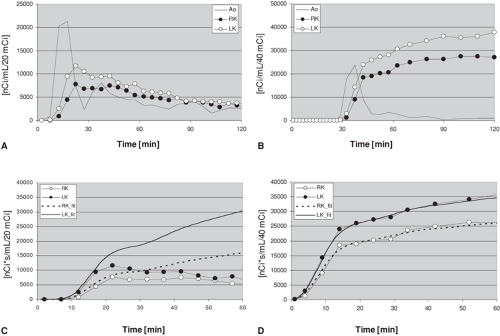 Figure 14.2.3. Time activity curves of the kidneys obtained with oxygen-15 ([15O])-water (A) and rubidium-82 ([82Rb]) (B) in a pig with right-sided renal artery stenosis. Magnetic resonance angiography, computed tomography angiography, and PET images of this same animal are shown in Fig. 14.2.2. The time activity curves were derived using regions of interest of the aorta (Ao), right kidney (RK), and left kidney (LK). Compared to [15O]-water, the renal accumulation of [82Rb] is delayed due to the dead space and prolonged bolus duration of the infusion system. The activity difference between the two kidneys is larger with [15O]-water during the first pass of the tracer, but the difference persists longer with [82Rb], permitting longer imaging times. The integrated input function derived from the abdominal aorta and the tissue time activity curves of [15O]-water are diverging, which is consistent with back diffusion of this tracer into the circulation (C). The integrated input function and tissue time activity curves of [82Rb], on the other hand, are nearly identical (D), which is consistent with the behavior of this tracer as a chemical microsphere. It is important to emphasize that the integrated input functions are adjusted for each kidney using the renal blood flow values calculated with each tracer. |
With [15O]-water the integral of the input function calibrated with the corresponding blood flow showed slightly higher values than the organ time activity curve during the up-sloping phase (Fig. 14.2.3C) and increasing deviation from the organ curve at the peak activity and later time points, which is consistent with the washout of this radiopharmaceutical from the kidneys. On the other hand, with [82Rb], the correspondence between the measured organ time activity curve and the integral of the input function calibrated for blood flow was nearly perfect (Fig. 14.2.3D). This implies that [82Rb] can be used to image and quantify blood flow over a longer time interval with high precision, which will result in good quality images. This may not apply to the accuracy of the measurement since the accumulation of [82Rb] also depends on the parenchymal extraction of the tracer, which may be lower than the extraction of [15O]-water and show a nonlinear regression with organ blood flow. This limitation of [82Rb] was demonstrated by the finding that [82Rb] overestimated the stenotic/nonstenotic kidney blood flow ratios compared to [15O]-water.
For [82Rb] only washin K1 but no washout k2 was included in the model. The close fit between the integrated input function and the organ time activity curve confirms the correctness of the assumption on the behavior of [82Rb] as a (nearly perfect) chemical microsphere. The close curve fit confirms the lack of washout but, unfortunately, it does not provide an estimate of the extraction fraction of [82Rb]. The extraction of [82Rb] in the kidneys has been estimated to be over 80% (30).
The zero washout rate (i.e., k2 = 0) of [82Rb] permits the use of a continuous tracer infusion technique and the tissue:blood [82Rb] ratio to assess renal blood flow. The infusion method requires only one blood sample for calibration and is particularly suited for serial measurements of renal blood flow in one experimental setup (31).
Copper-PTSM
Copper(II)-pyruvaldehyde bis (n-4-methylthiosemicarbazone) (Cu-PTSM) also behaves like a chemical microsphere. Its high tissue extraction is explained by the lipid solubility of the copper complex. Washout is slow due to a reductive decomposition of the copper chelate by intracellular sulfhydryl groups (32). PTSM can be labeled with either [64Cu], which is a cyclotron product with a half-life of 12.7 hours, or with [62Cu], a generator product with a half-life of 9.8 minutes. Both copper isotopes are positron emitters. In dogs, renal cortical blood flow determined with Cu-PTSM is 300 to 550 mL/min/100 g (33) and correlates well with renal blood flow determinations with radioactive microspheres (33,34).
Nitrogen-13-Ammonia
Nitrogen-13-ammonia is the third tracer suitable for imaging renal blood flow due to its microspherelike behavior. The renal blood flow determined with this tracer in dogs is 400 mL/min/100 g, which correlates well with renal blood flow obtained with [15O]-water (35). The mechanism of uptake in the kidneys is unknown, but it may be similar to the uptake in the myocardium where the glutamic acid–glutamine pathway has been postulated as the predominant means of tissue extraction. This reaction requires adenosine 5′-triphosphate (ATP) and is mediated by the enzyme glutamine synthetase (36), thus, the uptake of [13N]-ammonia, like the uptake of the potassium analogue [82Rb], depends not only on organ perfusion but also on tissue viability. In pigs, reduced renal blood flow has been documented using [13N]-ammonia in warm ischemia, allograft rejection, and cyclosporine nephrotoxicity (37).
Tracers for Glomerular Filtration
Radiolabeled ethylenediaminetetraacetic acid (EDTA) behaves biologically like technetium-99m (99mTc) diethylenetriamine pentaacetic acid (DTPA). It is excreted by the kidneys via glomerular filtration. For PET either cobalt-55 ([55Co]) (38) or gallium-68 ([68Ga]) (39) can be used for labeling. Cobalt-55 is obtained in a cyclotron and has a half-life of 17.5 hours and a maximal positron energy of 1.5 MeV. Gallium-68 is obtained from a generator (40), has a half-life of 68.3 minutes, and a maximal positron energy of 1.9 MeV.
The renal kinetics of radiolabeled EDTA can be best characterized with the stochastic impulse response function previously described for 99mTc DTPA (13,41), which has a vascular and a parenchymal component. The vascular peak value is followed by 20% extraction and transfer of tracer into primary urine within the capsule of Bowman and from there into the tubular lumen. Since the length of the tubules is variable the fate of the tracer is best described by a random pathway distribution model quantitatively characterized by the minimal and mean transit times T0 and [T with bar above] (Fig. 14.2.1C).
Altered tubular transport is a sensitive indicator of altered renal function in renovascular hypertension, obstructive nephropathy, transplant rejection, and other diseases of the kidneys. Planar renal imaging studies with a gamma camera result in a significant overlap of activity from renal parenchyma, collecting system, and adjacent organs such as the liver and spleen. Decomposition of the individual constituents of this curve is achieved by factor analysis (42) or other sophisticated pattern recognition techniques such as neural network analysis (43). One important advantage of PET is an effective separation of these activity components by tomographic imaging. Even so, the tracer may accumulate in the collecting system at high concentrations that could result in image artifacts and may require implementation of iterative image reconstruction algorithms that are less sensitive to effects of high concentration gradients within the field of view.
Radioligands
Small labeled drugs (radiopharmaceuticals) that undergo molecular interactions with larger molecules such as enzymes, transporters, receptors, and other specific tissue binding sites are called radioligands. In inorganic chemistry, ligands are molecules that can share electrons through a covalent bond with another molecule. In organic chemistry, ligands are molecules that can bind to a specific recognition site of a protein. Natural ligands are hormones and neurotransmitters with agonistic effects on their targets. Their interaction with the target permits intercellular communication and initiation of intracellular signal transduction cascades. The role of these intracellular signal transduction cascades is to amplify or, in general, modulate the incoming signal.
Radioligands developed for PET imaging of receptors are usually specific and selective antagonists labeled with [11C] or [18F]. After intravenous injection, these radioligands form specific bonds with the target receptor, transporter, enzyme, or signal transduction protein. Whether an agonist or antagonist is used, it is important that the radioligand be injected in subpharmacological doses to avoid biological effects. This is achieved by injection of radiopharmaceuticals in low drug mass (e.g., at high specific activity). In addition to high specific activity, high ligand affinity will result in high specific-to-total or specific-to-nonspecific binding ratios.
Compartmental impulse response functions have been widely applied to describe the kinetics of radioligands. Each compartment is mathematically defined by a separate monoexponential impulse response function f(t) = Kine–kout(t). If the tracer is distributed in multiple compartments, the resulting impulse response function will be composed of a sum of multiple exponential functions, and the number of the exponentials will equal the number of compartments. This number has been referred to as the model order. For example, if one compartment is present for nonspecific binding and one compartment for specific binding, the model order is 2.
Tracer kinetic models of radioligands used for imaging receptors of the neurons within the brain assume a sequential connection of two compartments. The nonspecific binding compartment is directly related to the uptake of radioligand through the blood– brain barrier K1. Receptor binding follows at a second step, and, therefore, the two impulse response functions are convolutive in the time space or multiplicative in Laplacian and Fourier spaces. Due to absence of the blood–brain barrier and contemporaneous exposure of the radioligand to both binding sites, a parallel connectivity model is more appropriate for description of radioligand kinetics in the kidneys and organs other than the brain. For these organs the tissue impulse response function can be described as a sum of the two individual exponential functions without a need for convolution. If K1 and k2 are the parameters of nonspecific binding and K3 and k4 are the parameters of specific binding, it is
desirable to have a K3 >K1. In serial connectivity models it is desirable to have k3 >k2. The use of a capital K3 indicates that it describes direct transfer from blood to tissue, while small k3 indicates exchange between intraparenchymal compartments. If the criterion K3 >K1 cannot be achieved, one has to wait until nonspecific binding is washed out, and in this case the second criterion to be fulfilled is k4 <k2. Typically, specific binding has a low capacity and a high affinity (i.e., K3 is <k1 but k4 is also <k2). With the parallel connectivity model, the ratios K1/k2 and K3/k4 describe the distribution volumes of nonspecific and specific binding DVn and DVsp and their sum DVn + DVsp represents the total tissue distribution volume of the radioligand. If the ligand has a large distribution volume with a small k4, better images are achieved if it is labeled with [18F] than if labeled with [11C], which has a much shorter half-life. In terms of pharmacokinetics and molecular interactions, a better term of specific binding is displaceable binding because the radioligand can be displaced from its binding site with a pharmacological dose of a competitive drug.
desirable to have a K3 >K1. In serial connectivity models it is desirable to have k3 >k2. The use of a capital K3 indicates that it describes direct transfer from blood to tissue, while small k3 indicates exchange between intraparenchymal compartments. If the criterion K3 >K1 cannot be achieved, one has to wait until nonspecific binding is washed out, and in this case the second criterion to be fulfilled is k4 <k2. Typically, specific binding has a low capacity and a high affinity (i.e., K3 is <k1 but k4 is also <k2). With the parallel connectivity model, the ratios K1/k2 and K3/k4 describe the distribution volumes of nonspecific and specific binding DVn and DVsp and their sum DVn + DVsp represents the total tissue distribution volume of the radioligand. If the ligand has a large distribution volume with a small k4, better images are achieved if it is labeled with [18F] than if labeled with [11C], which has a much shorter half-life. In terms of pharmacokinetics and molecular interactions, a better term of specific binding is displaceable binding because the radioligand can be displaced from its binding site with a pharmacological dose of a competitive drug.
Stay updated, free articles. Join our Telegram channel

Full access? Get Clinical Tree


