The Kidneys
M. Robert Dejong
Jeanine Rybyinski
|

OBJECTIVES
Discuss the normal anatomy of the kidneys including vasculature.
Describe the microscopic internal renal anatomy to include the glomerulus and nephrons.
Discuss the physiology of the upper urinary system.
List the common laboratory function tests for the kidneys and what an abnormal value may indicate.
Recognize sonographic anatomy of the upper urinary tract.
Discuss the routine scanning protocol of the kidneys.
Describe the sonographic appearance of the various cystic lesions of the kidneys.
Describe the sonographic appearance of common benign and malignant solid masses of the kidneys.
List some of the causes for hydronephrosis and the sonographic appearance of each grade.
List common causes, and describe the sonographic appearance of kidney stones.
Discuss the sonographic appearance of medical renal disease, and list common causes for medical renal disease and renal failure.
Describe the sonographer’s role in native renal biopsies.
KEY TERMS
acoustic shadow
acute tubular injury (ATI)
adenoma
autosomal dominant polycystic kidney disease
angiomyolipoma
blood urea nitrogen (BUN)
column of Bertin
cortex
creatinine
dromedary hump
duplicated or bifid collecting system
ectopic kidney
emphysematous pyelonephritis
enhancement
estimated glomerular filtration rate (eGFR)
extrarenal pelvis
glomerulus
horseshoe kidney
hydronephrosis
junctional parenchymal defect
kidney stones or calculi
lymphoma
medical renal disease
nephrocalcinosis
nephron
oncocytoma
parenchyma
pyelonephritis
pyonephrosis
renal agenesis
renal cell carcinoma
renal cyst
renal failure
renal pelvis
sinus
subcapsular hematoma
transitional cell carcinoma
GLOSSARY
acoustic enhancement a localized area of increased echo brightness behind a structure of low attenuation; also called posterior enhancement or enhanced through transmission
acoustic shadow caused by a dense structure, usually containing calcium, of high attenuation that absorbs the sound beam causing a black area that does not contain any echoes underneath the structure
acute kidney injury (AKI) a rapid or abrupt decrease in renal function based on lab values and urine output; previously called acute renal failure (ARF)
blood urea nitrogen (BUN) a blood test that measures the amount of urea nitrogen in the blood. It helps determine kidney function
chronic kidney disease (CKD) a long-term process that damages the kidneys, causing renal failure; previously called chronic renal failure (CRF)
contralateral the other side of the body
creatinine a blood test that measures the level of creatinine in the blood. It helps determine kidney function along with BUN
cyst a round structure of smooth, thin-walled tissue that contains fluid
estimated glomerular filtration rate (eGFR) an estimate of how well the kidneys are working and can determine if kidney disease is present and what stage. It measures the kidneys’ ability to filter toxins or waste from blood
Gerota fascia a fibrous connective tissue that encapsulates the kidneys and adrenal glands; also known as the renal fascia
glomerulus a ball-shaped structure that make up the nephron and involved in the filtration of the blood. Plural form is glomeruli
hematuria when there is blood in the urine and can be referred to as either gross hematuria, when the blood is visible in the urine, or microscopic hematuria, when blood can only be seen under a microscope
hypernephroma another term for renal cell carcinoma
hypertension, or high blood pressure, is when the force of the blood pushing against the walls of the blood vessels is at a higher pressure than normal
ipsilateral on the same side of the body
nephrectomy surgical removal of a kidney
nephron the functional unit in the kidney that consists of a glomerulus and a tubule, through which the glomerular filtrate passes to become urine by removing waste and excess substances and fluid
nephropathy refers to kidney disease
nephrotoxic anything or any substance that can damage the kidneys
oliguria when there is a low output of less than 400 mL of urine in 24 hours, oligio—little, uria—urine, little urine
proteinuria when there is protein in the urine
renal pelvis an area in the center of the kidney where urine collects to be funneled into the ureter
septation a tissue partition inside a cyst
According to the National Institute of Diabetes and Digestive and Kidney Disease, 1 in 3 people with diabetes and 1 in 5 people with high blood pressure have kidney disease. Nearly 786,000 people in the United States are living with end-stage renal disease (ESRD), with 71% on dialysis and 29% with a kidney transplant. Despite the prevalence of the disease, as many as 9 in 10 people are unaware that they have chronic kidney disease (CKD).1
Sonography is generally the first imaging test to evaluate the kidneys when renal disease is suspected because neither radiation nor nephrotoxic contrast is needed. Both computed tomography (CT) and magnetic resonance imaging (MRI) contrast agents can damage the kidneys and possibly cause the patient to acquire acute kidney injury (AKI). A renal sonogram provides the nephrologist or physician information about renal length, cortical thickness, the echogenicity of the renal cortex, and if pathology is present. If further information is needed, the patient will be sent for a CT scan or a MRI scan.
Renal sonograms may be challenging to perform. Sonographers must have a good understanding of anatomy, physiology, and pathophysiology of the organs scanned. With this knowledge, the sonographer has the information needed to adjust the protocols, if necessary. In addition, the sonographer should be able to evaluate lab reports, physical examination findings, and any operative or imaging reports. This information assists the sonographer in anticipating potential findings, especially as typically the minimal amount of clinical information is on the order. All sonographic images are evaluated regarding the demonstration of appropriate anatomy, technical settings, measurements, and vascularity. Image optimization ensures the best patient care and potential for diagnosis.
This chapter discusses the upper third of the urinary system, which comprises the kidneys and the proximal ureters. Chapter 13 discusses the lower third of the urinary system, including the distal ureters, urinary bladder, and the urethra, and Chapter 20 reviews the pediatric urinary system. Chapter 6 discusses renal Doppler examinations, Chapter 24 renal transplants, and Chapter 26 sonography-guided interventional procedures, including renal biopsies.
ANATOMY
Often having an understanding of how the organs are developed can assist the sonographer in understanding variations in anatomy, congenital anomalies, and other organ systems that may be affected.
The urinary system begins its development along with the reproductive system as they develop from the same origin, often described as the urogenital ridge. This is why anomalies in one system may have associated anomalies in the other system. The urogenital ridge will form during the fourth week of gestation and divide into the nephrogenic cord, to form the urinary tract, and the gonadal ridge, to form the reproductive tract. The correct development of the urinary tract is through a complex interaction between embryonic tissues, the mesonephric duct, the ureteric duct, and the metanephric blastema. A disruption of this intricate process through either a genetic or environmental cause can result in congenital anomalies of the urinary system, including renal agenesis, multicystic dysplastic kidney (MCDK), or infantile polycystic kidney disease (PKD). What follows is very basic information on the embryology of the kidneys, and the reader is encouraged to read more detailed information about the formation of the urinary system.
The kidneys will develop in three morphologic stages called the pronephros, the mesonephros, and the metanephros. The pronephros is the earliest nephric stage and is a transitory, nonfunctional structure that disappears by the fourth week of gestation. Pronephros is derived from Greek and means before kidney. Its purpose is not well understood, but it is thought that it might provide a structure for the mesonephros. The mesonephros forms just caudal to the pronephros and develops into the mesonephric tubules and the mesonephric duct, also known as the Wolffian duct. This structure provides partial function, whereas the kidney continues to develop and completely regresses by the 12th week of gestation. The Wolffian duct will regress in females and become Gartner duct that can form a cyst called a Gartner duct cyst, which is usually located along the anterolateral wall of the proximal third of the vagina. They can sometimes be identified on an endovaginal examination. In males, the Wolffian duct develops into parts of the male reproductive system, including the epididymis, vas deferens, seminal vesicles, and the ejaculatory duct. In females, the mesonephric duct develops into the paramesonephric duct, or Müllerian duct, which develops into the female reproductive system, including the uterus and the cervix. In males, the Müllerian duct will regress and become the appendix testes. The ureteric bud comes off the mesonephric duct and develops into the different parts of the collecting system, such as the calyces, collecting ducts, renal pelvis, and ureter. The ureteropelvic junction (UPJ) is the last to canalize and is the most common site of obstruction in congenital hydronephrosis. During the fifth week of gestation, the metanephros phase begins, and the metanephric mesoderm will form the excretory parts of the kidneys that form the nephrons, glomerulus, Bowman capsule, and the convoluted tubules (Pathology Box 12-1). Note that the collecting system and the parenchyma develop from two different sources. The kidneys become functional at about 12 weeks of gestational age. Nephrogenesis, development of the kidney, will continue through 32 to 36 weeks of gestational age.
 PATHOLOGY BOX 12-1
Development of the Kidneys
Urogenital ridge
Nephrogenic cord
Three morphologic stages:
Pronephros
Mesonephros
Metanephros
Mesonephric duct
Ureteric duct
Metanephric blastema
The kidneys initially develop in the pelvic region where they lie close together in the sacral region. As the fetus grows and the abdomen enlarges, the kidneys are drawn apart and ascend to their final position in the abdomen around T12-L3. During this ascent, the kidneys will rotate 90 degrees, causing the hilum, which initially faces ventrally, to face medially. This ascent process occurs between 6 and 9 weeks of gestational age. While in the pelvis, the kidneys will receive their blood supply from the common iliac arteries. As the kidneys ascend, they are vascularized by a succession of transient, higher arteries off the abdominal aorta that corresponds to the level of the kidneys, until the kidneys reach their final position and the main renal arteries are formed. These lower vessels should regress as they become unnecessary, but if they persist, they become accessory renal arteries.
The normal urinary system consists of two kidneys, two ureters, the urinary bladder, and the urethra. The kidneys are in the retroperitoneum on either side of the vertebrae. The ureters take the urine from the kidney to the urinary bladder, where it is stored temporarily until it is excreted from the body through the urethra. The left kidney is located at about the level of T12-L3, whereas the right kidney is slightly lower in the abdomen owing to the larger size of the liver (Fig. 12-1A). The left kidney will be slightly higher, superior, in the abdomen and more toward the back, posterior, then the right kidney. The kidneys lie on the posterior abdominal wall on the quadratus lumborum muscle on either side of the spine in the perineal space of the retroperitoneum (Fig. 12-1B, C). The long axis of the kidney is in an oblique plane parallel to the lateral border of the psoas muscle. It is not in a sagittal plane. The upper pole of the kidney is more medial and lies more posterior than the lower pole. This is why the lower pole of the kidney tilted up toward the skin surface (Fig. 12-2).
Renal length gives an approximation of renal function; therefore, it is important for the sonographer to measure the kidneys carefully. Kidney size has been correlated with the patient’s height, age, and body mass index (BMI). The size
of the kidneys is roughly the size of the patient’s fist. In adults, the normal kidney is approximately 10 to 14 cm long in males and 9 to 13 cm long in females. A general number used is renal length is between 9 and 12 cm. The kidneys measure about 5 to 7 cm in width, 3 to 5 cm in thickness, and weigh approximately 120 to 170 g (Fig. 12-3A). The width and thickness measurements are measured at the level of the renal hilum in a transverse plane that is perpendicular to the long axis of the kidney. The two measurements should be at a right angle to one another (Fig. 12-3B). The kidneys are slightly larger in men, and the left kidney is usually slightly longer than the right. The difference between the two normal kidneys should be within 15 mm if the right kidney is smaller and 10 mm if the left kidney is smaller. The rule of thumb that is commonly used in sonography is that the kidneys should be within 2 cm of each other in length. If one kidney is more than 2 cm or shorter by at least 2 cm in length, when compared with the other kidney, the sonographer needs to try and determine the cause. The potential reasons for this discrepancy in size are discussed later in this chapter. When a kidney is removed, the remaining kidney will start to grow again and increase in size, called hypertrophy, to compensate for assuming the function of the other kidney, measuring greater than 12 to 13 cm in length. As people age, their kidneys tend to shrink. Therefore, a 9.5-cm kidney in an 80-year-old woman may be normal, whereas in a 26-year-old, it would be small.
of the kidneys is roughly the size of the patient’s fist. In adults, the normal kidney is approximately 10 to 14 cm long in males and 9 to 13 cm long in females. A general number used is renal length is between 9 and 12 cm. The kidneys measure about 5 to 7 cm in width, 3 to 5 cm in thickness, and weigh approximately 120 to 170 g (Fig. 12-3A). The width and thickness measurements are measured at the level of the renal hilum in a transverse plane that is perpendicular to the long axis of the kidney. The two measurements should be at a right angle to one another (Fig. 12-3B). The kidneys are slightly larger in men, and the left kidney is usually slightly longer than the right. The difference between the two normal kidneys should be within 15 mm if the right kidney is smaller and 10 mm if the left kidney is smaller. The rule of thumb that is commonly used in sonography is that the kidneys should be within 2 cm of each other in length. If one kidney is more than 2 cm or shorter by at least 2 cm in length, when compared with the other kidney, the sonographer needs to try and determine the cause. The potential reasons for this discrepancy in size are discussed later in this chapter. When a kidney is removed, the remaining kidney will start to grow again and increase in size, called hypertrophy, to compensate for assuming the function of the other kidney, measuring greater than 12 to 13 cm in length. As people age, their kidneys tend to shrink. Therefore, a 9.5-cm kidney in an 80-year-old woman may be normal, whereas in a 26-year-old, it would be small.
 FIGURE 12-1 Anatomy of the urinary system. A: A female showing two kidneys, two ureters, and one urethra. The main difference between a male and female urinary system is the urethra in a male is longer. Note: The suprarenal gland is another name for the adrenal gland. B: An anatomic transverse image of the kidneys in their retroperitoneal location surrounded by the renal capsule and both perirenal and pararenal fat. Note the surrounding structures and their relationship to the kidneys. C: Transverse image of the right kidney showing the kidney and its relationship to the psoas and quadratus lumborum muscles. GB, gallbladder; IVC, inferior vena cava. |
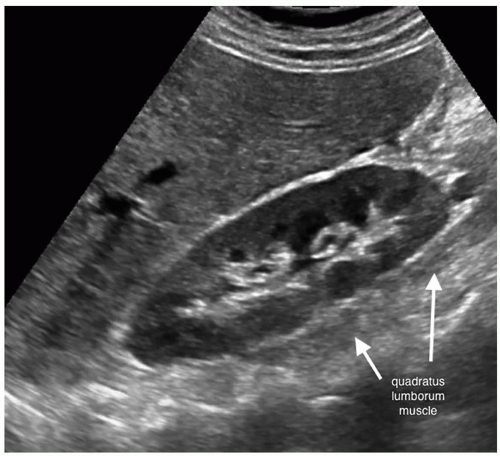 FIGURE 12-2 Longitudinal image of the right kidney showing the tilt of the kidney with the upper pole deeper in the image and the lower pole closer to the surface. This image also demonstrates a Riedel lobe of the liver. |
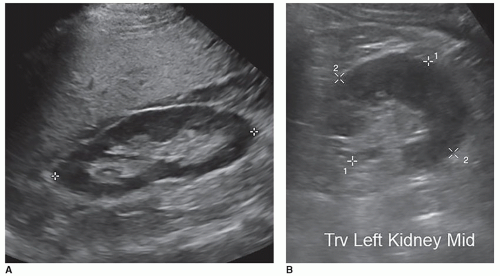 FIGURE 12-3 Standard renal measurements. A: Longitudinal image of the right kidney demonstrating how to correctly measure the length of the kidney. B: Transverse image of the left kidney at mid pole demonstrating the transverse measurement (calipers 1) and the thickness measurement (calipers 2). (Images courtesy of T. Whitten.) |
The cortical thickness is measured from the base of the pyramid to the capsule and is normally between 6 and 10 mm. If the pyramids are difficult to see, the parenchymal thickness can be measured, instead of measuring from the edge of the sinus echo to the capsule and should be between 15 and 20 mm (Fig. 12-4). Cortical thickness appears to be closely related to estimated glomerular filtration rate (eGFR), and studies have shown that in patients with a low eGFR, their cortical thickness is reduced in size. Some nephrologists use the cortical thickness over the renal length measurement to determine the severity of renal failure as well as to follow the patient for progression of the disease.
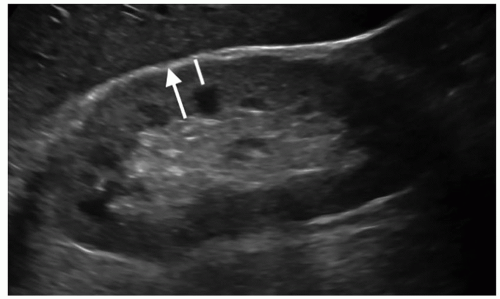 FIGURE 12-4 Image demonstrating how to measure cortical thickness (solid line) and parenchymal thickness (arrow). |
Another sonographic method to evaluate the kidney for renal failure is by obtaining a renal volume. Renal volume can be used to help assess renal function, especially in patients with CKD, because renal volume will decrease with a decrease in renal function. Renal volume is a more sensitive indicator of declining renal function as opposed to a single linear measurement. It is calculated by measuring the three axes of the kidney and using the formula for an ellipsoid:
Volume = length × width × thickness × π/6
An easier version to use for calculation is volume = length × width × thickness × 0.523 (where π/6 = 3.14/6 = 0.523). Some ultrasound (US) units can calculate the renal volume from the three measurements when the volume tool is activated. Because the kidney is not a true ellipse, renal volumes are underestimated using this method. A normal renal volume is between 110 and 190 mL in men and between 90 and 150 mL in women (Pathology Box 12-2). Renal volumes calculated using a 3D transducer and 3D software have been shown to be more accurate when compared with renal volumes obtained using MRI.
Obtaining accurate renal length measurements is very important for patient care as medical decisions are made based on these measurements. It is important when measuring the length of the kidney to ensure that the full length of the kidney is being accurately measured, as it is easy to oblique the transducer and foreshorten the length, creating a false measurement. Look at the cortex as it should be about the same thickness as it surrounds the sinus echoes. Check the individual measurements of each kidney and compare the measurements between the kidneys to make sure that they make sense. The difference in size between the two kidneys should be less than 2 cm, and the measurements should be repeated if the difference is greater than 2 cm and a reason for the discrepancy cannot be determined. Sometimes, the lower pole may be hard to define due to a rib shadow or overlying bowel gas. A kidney that measures less than 9 cm is usually abnormal, so if a measurement is less than 9 cm, it is important to reevaluate the image, especially if the other kidney is a normal size. If the sinus echoes touch or are near the border of a pole, then the measurement will be inaccurate as this image has been captured in an oblique plane. If seeing the lower pole border is difficult due to a rib shadow, try using a sector transducer as it can get between the ribs and show both the borders of the kidney. It is acceptable for the rib shadow to go through the middle of the kidney when obtaining a length measurement. If the issue is bowel gas, try placing the transducer closer to the scanning table and angling anteriorly toward the kidney. If that does not work, turn the patient into an oblique or decubitus position. A last resort is to turn the patient into a prone position. Sometimes, pathology can interfere or mask the poles of the kidney, and the sonographer will need to make their best judgment on how to measure the length of the kidney. This will involve using the border of the mass to represent the pole of the kidney (Fig. 12-5A-H). There will be a slight variation in measurements between sonographers, called intervariability, and between repeated measurements from the same sonographer, called intravariability. If you realize that the sonographer on the prior study measured incorrectly, do not try to make your measurements match theirs, as this is very poor patient care. The radiologist, supervisor, or manager should directly discuss scanning errors with the employee that measured incorrectly. It is important for sonographers to remain professional and resist discussing errors or mistakes of colleagues among staff because this leads to a hostile working environment.
 PATHOLOGY BOX 12-2
Normal Renal Measurements
|
The kidney is bean shaped with a convex lateral border, a concave medial border, an upper pole, and a lower pole. The kidney is divided into the renal parenchyma, which consists of the renal cortex and the medulla, and the renal sinus (Fig. 12-6A, B). The renal cortex lies under the capsule and contains Bowman capsule, the glomerulus, and the proximal and distal convoluted tubules of the nephron. It is in the renal cortex where filtration occurs. The medulla is the inner portion of the renal parenchyma and contains the loop of Henle, which is where reabsorption takes place. The renal medulla consists of 7 to 14 renal pyramids, which are separated from each other by an inward extension of the renal cortex called a renal column or column of Bertin, through which the blood vessels pass. On average, there are eight renal pyramids in each kidney. The renal pyramids along with the surrounding cortical tissue create one lobe of the kidney. The arcuate arteries, which are located at the base of the pyramids, separate the medulla from the cortex and are termed the corticomedullary junction. The apex of the pyramid, called the renal papilla, fits into the cup-like
cavity of a minor calyx to collect the urine. There are between 7 and 14 minor calyces, which converge to form the two to three major calyces. Urine flows from a minor calyx into a major calyx and then into the funnel-shaped renal pelvis, which narrows to form the ureter at the UPJ. The renal sinus is a cavity located within the medial aspect of the kidney and contains blood vessels, the renal pelvis, and fat. Renal parenchyma surrounds the centrally located, hyperechoic renal sinus, which abuts the columns of Bertin without a connective tissue interface (Fig. 12-7). On the medial border of the kidney is an indentation called the renal hilum, which is where the renal arteries, nerves, lymphatics, and
fat enter the kidney and the renal veins and ureter leave the kidney. The renal veins are anterior to the renal arteries, and the ureter is posterior to the renal vessels (Fig. 12-8A, B). The kidneys are surrounded by an inner fibrous capsule, a middle layer of perinephric fat, an outer layer of fibrous connective tissue that also surrounds the adrenal gland, and, finally, an outer layer of pararenal fat. The innermost layer is the fibrous renal capsule, which covers the surface of the kidney and goes between the kidney and the adrenal gland to provide support to the renal tissue and protection from infection. There is not any adipose tissue found between the renal parenchyma and the renal capsule. The renal capsule is covered by a layer of perirenal fat, called the adipose capsule or renal fat pad, which helps support the kidney and is a protective layer acting as a shock absorber (Fig. 12-9A-C). The next layer anchors the kidneys to the surrounding structures and is the perirenal fascia, which is a collagen-filled, fibrous connective tissue that envelops the kidney, the adrenal gland, and the perirenal fat to form the perirenal space. The perirenal fascia divides into two layers that pass in front of and behind the kidney. The anterior and posterior fascial leaflets fuse, closing off the perirenal space from the rest of the retroperitoneum. The anterior perirenal fascia is called Gerota fascia, which separates the perinephric fat from the paranephric fat (Pathology Box 12-3). It is named after Dr. Dimitrie Gerota, an anatomist and the first Romanian radiologist and later urologist after losing his hand to radiodermatitis. The posterior renal fascia is a fibrous sheath covering the posterior side of the kidney and the perinephric space and is called Zuckerkandl fascia, named after the Hungarian Zuckerkandl brothers who worked together at The University of Vienna. Emil was an anatomist and surgeon, and Otto was a urologist. Emil described the posterior fascia in 1883 in a paper but did not recognize the anterior fascia. In 1895, Dr. Gerota described the anterior fascia and named the posterior fascia after Emil Zuckerkandl. The posterior pararenal space of the retroperitoneum is posterior to the Zuckerkandl fascia. Over time, the Zuckerkandl name has been forgotten and most people refer to both fasciae as Gerota fascia. Finally, there is another layer of fat, called the pararenal fat. The fatty layers are important in protecting and holding the kidneys in their normal position. When the amount of fatty tissue around the kidney rapidly decreases owing to rapid weight loss, it may cause a ureter to become kinked, causing hydronephrosis.
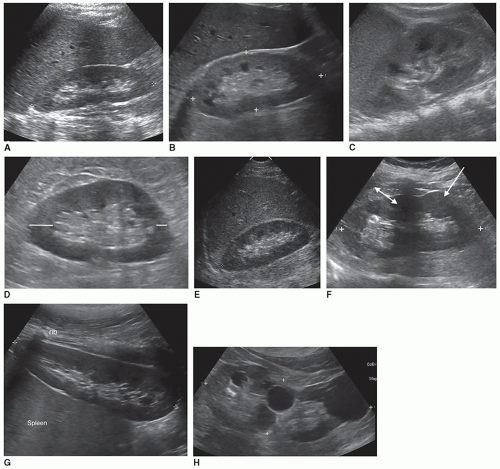 FIGURE 12-5 Renal measurements. A: Good technique in measuring the kidney. Note how the cortex is the same thickness at the upper and lower poles. There is a slight rib shadow through the middle of the kidney, which is acceptable for measuring purposes. B: In this image, the lower pole is obscured by the rib. The sonographer may sometimes “guess” where the lower pole should be, as in this case. Try following the curve of the kidney on both the anterior and posterior surfaces and determine where they would meet to form the lower pole. Note that the echogenicity of the kidney is brighter than the liver, which is compatible with medical renal disease, and the prominent pyramids. C: Note that the sinus echoes are touching the lower pole, indicating that this is an oblique image and not a true longitudinal and should not be used for a length measurement. This is the left kidney that has a dromedary hump. D: On this image, the cortical thickness of the lower pole is thinner than the upper pole, indicating that the image has been frozen in an oblique plane and should not be used to measure the length of the kidney. E: This image was obtained using a sector array transducer, which easily fits between the ribs because of its small footprint and allows good visualization of both the upper and lower poles. F: Here the rib shadow does not interfere with measuring the length of the kidney; however, the area under the rib must be evaluated. The double-headed arrow points to the rib shadow, and the single arrow to a solid renal mass. G: In this image, the patient is prone. A rib shadow is seen in the upper pole; however, it is not obscuring the border. H: There are multiple cysts in the kidney with a large cyst replacing the lower pole. Because the lower pole is not seen, the border of the cyst served as the lower pole. It would not be proper to guess where the lower pole border is inside the cyst as it would be hard to duplicate its location on follow-up examinations. |
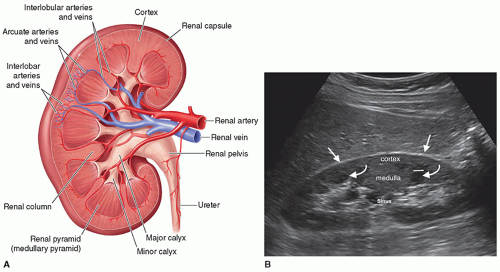 FIGURE 12-6 Renal anatomy. A: Interior view of the kidney demonstrating the different parts of renal anatomy, including renal vasculature. B: Image of a normal kidney identifying various parts of renal anatomy. The solid line indicates the area of the corticomedullary junction at the top of the pyramid. Curved arrows indicate renal pyramids, and straight arrows indicate Gerota fascia. |
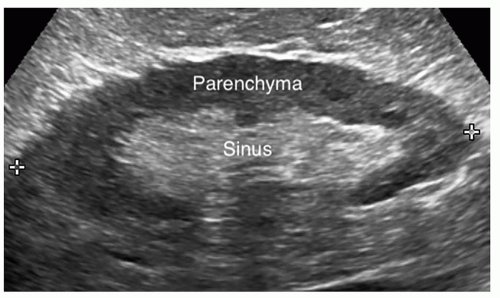 FIGURE 12-7 Image of a normal kidney identifying the parenchyma and the echogenic sinus. |
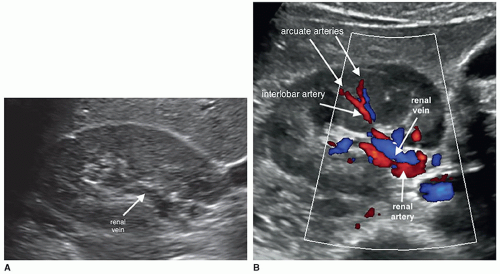 FIGURE 12-8 Renal vasculature. A: Transverse image at the level of the renal hilum. The arrow is pointing to the renal vein, which can often be seen on the grayscale image owing to its larger size. A color Doppler image of the area should be obtained to verify that it is the renal vein. B: Color Doppler image showing the renal vein in blue and the renal artery and its segmental branches in red. An interlobar artery is seen going between the pyramids and ending at the arcuate arteries, which demarcates the corticomedullary junction. The interlobar vein is seen next to the artery. Flow past the arcuate arteries is not seen because of the color velocity scale being too high. |
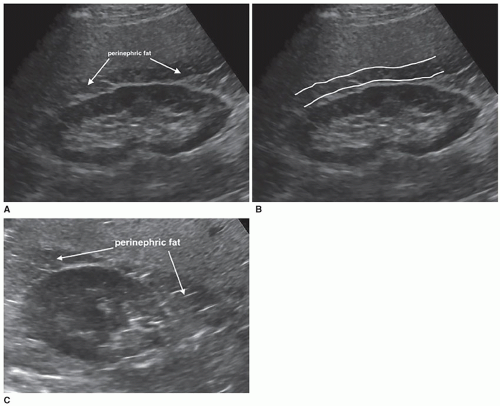 FIGURE 12-9 Perinephric fat. A: Longitudinal image of the kidney showing fat around the kidney. This fat is a combination of both paranephric and perinephric fat and is usually just called perinephric fat. B: Same image as in A with the white lines demarcating the borders of the fat. This is called the double line sign. C: Transverse image of the right kidney showing the fat between the kidney and the liver. |
 PATHOLOGY BOX 12-3
Layers Surrounding the Kidney from Inner to Outer
Fibrous capsule—goes between kidney and adrenal gland
Perirenal fat—also called adipose capsule or renal fat pad
Perirenal fascia—covers the kidney and adrenal gland and consists of anterior fascia, Gerota fascia, and the posterior fascia, Zuckerkandl fascia
Pararenal fat—located superior to renal fascia
The kidneys receive their blood supply from the renal arteries, which arise from the lateral borders of the aorta, at around the level of L1-2, just distal to the superior mesenteric artery (SMA). Approximately 20% to 30% of the cardiac output enters the renal arteries. They are the first lateral branches off the aorta, and their long axis is best seen in a transverse plane. The renal arteries are approximately 4 to 6 cm in length and 5 to 6 mm in diameter and are located posterior to the renal veins (Fig. 12-10). Because the aorta lies to the left of the midline, the right renal artery (RRA) is longer than the left and travels posterior to the inferior vena cava (IVC) on its way to the kidney (Fig. 12-11A, B). The left renal artery (LRA) is more superior in location and courses posterior to the left renal vein (LRV) (Fig. 12-12). The main renal artery supplies branches to the adrenal gland, ureter, perinephric tissue, and the renal capsule as it approaches the renal hilum. The renal artery branches are an example of anatomic end arteries, which means that there is no communication between the arteries so that if one arterial branch becomes thrombosed or damaged, the renal parenchyma supplied by that vessel will become necrotic. The renal artery supplies blood to the five segments of the kidney: superior or apical, anterior superior, anterior inferior, inferior, and posterior. As the renal artery approaches the renal hilum, it divides into anterior and posterior segmental arteries, with the anterior branch receiving approximately 75% and the posterior branch approximately 25% of the blood flow. The first division of the renal artery is the posterior branch that passes behind the renal pelvis to become the posterior segmental artery. This branch supplies blood to a large portion of the posterior kidney. The main renal artery continues as the anterior branch, and at the renal hilum, it divides into the four anterior branches: the apical, upper, middle, and lower segmental branches. The apical segmental artery will supply blood to the anterior and posterior surfaces of the upper pole. The lower anterior segmental artery will supply blood to the anterior and posterior surfaces of the lower pole. The upper and middle segmental arteries supply blood to the remainder of the anterior surface. The segmental arteries then course through the renal sinus and branch into the lobar arteries. As the lobar arteries reach the minor calyces, they further divide into the interlobar arteries, which run between the pyramids, supplying them with blood. At the base of the pyramids, the interlobar arteries bend to form the incomplete arches of the arcuate arteries, indicating the true corticomedullary junction. The arcuate arteries travel across the top of the renal pyramids and give rise to the cortical radiate arteries, which were formerly known as interlobular arteries. The cortical radiate arteries come off the side of the arcuate artery at right angles and are arranged radially over the basal surface of the pyramids, perpendicular to the renal surface (Fig. 12-13). The cortical radiate arteries pass through the cortex as they divide to form the afferent arterioles. The afferent arterioles send the blood into a high-pressure capillary bed called the glomerulus where filtration takes place. The blood exits the glomerulus through the efferent arterioles. The efferent arterioles form a second capillary network around the tubule, which is called the peritubular capillaries, which empty their blood into a small network of venules that converge to become the cortical radiate veins. The blood next travels to the arcuate veins and then the interlobar veins, which form the main renal vein. Note that there are no segmental veins. The renal veins emerge from the renal hilum to enter the side wall of the IVC at about the level of L2 (Pathology Box 12-4). The right renal vein is typically about 3 to 4 cm in length as it is right next to the IVC, whereas the LRV is about 6 to 7 cm in length. The renal veins have a diameter of 10 to 12 mm. The LRV courses between the SMA and the aorta to reach the IVC (Fig. 12-14A-C). The LRV receives venous blood from the left adrenal vein, left gonadal (ovarian, testicular) vein, and the inferior phrenic vein. The right renal vein does not receive venous blood from other veins. The
nutcracker syndrome is when the LRV, the nut, is compressed between the SMA and the aorta, the nutcracker. Some patients may be asymptomatic, whereas others have hematuria, flank, or abdominal pain. Two common variants of the LRV are a retroaortic LRV, where the vein courses posterior to the aorta, and a circumaortic LRV, where both a retroaortic LRV and a normal renal vein pass anterior to the aorta (Fig. 12-15).
nutcracker syndrome is when the LRV, the nut, is compressed between the SMA and the aorta, the nutcracker. Some patients may be asymptomatic, whereas others have hematuria, flank, or abdominal pain. Two common variants of the LRV are a retroaortic LRV, where the vein courses posterior to the aorta, and a circumaortic LRV, where both a retroaortic LRV and a normal renal vein pass anterior to the aorta (Fig. 12-15).
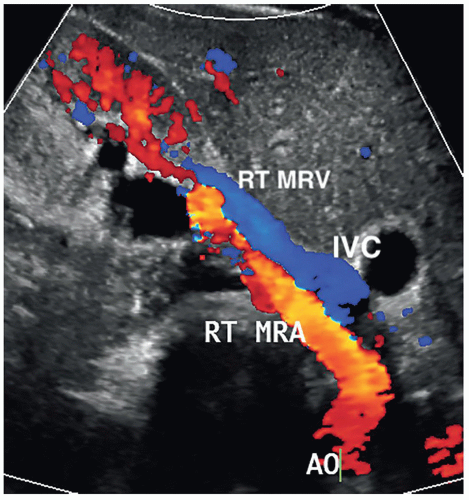 FIGURE 12-10 Transverse image showing the renal arteries coming off the aorta. IV, inferior vena cava; LRA, left renal artery; LRV, left renal vein; RRA, right renal artery, SMA, superior mesenteric artery. |
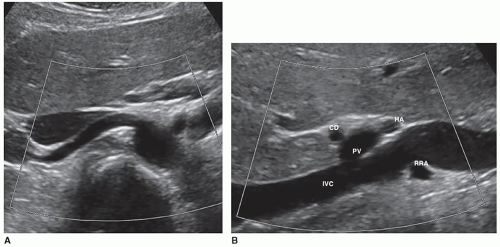 FIGURE 12-11 Surrounding vasculature. A: Grayscale image using a feature called Clarify™ that “cleans up” the noise inside vessels. This image shows the origin of the right renal artery off the aorta (Ao) as it passes posterior to the IVC. B: Longitudinal image of the IVC using Clarify™ showing a small circle posterior to the IVC, which is the right renal artery (RRA). Anterior to the IVC is the “Mickey Mouse” sign of the portal triad. CD, common duct; HA, hepatic artery; IVC, inferior vena cava; PV, portal vein. |
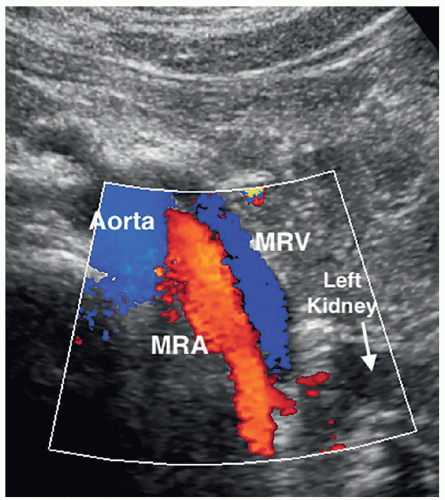 FIGURE 12-12 Color Doppler image of the left main renal artery (MRA, in red) and main renal vein (MRV, in blue) from a supine approach. Note that the left kidney is visible and the short length of the artery. The vein is superior to the artery. The color velocity scale was inverted from BART (blue away, red toward) so that the artery, which is going away from the transducer, is encoded with red. |
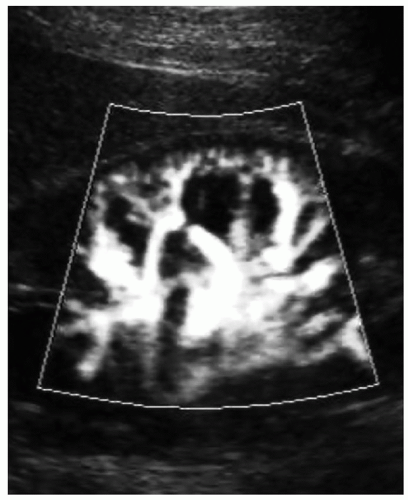 FIGURE 12-13 A power Doppler image showing normal perfusion of the kidney. Note the exceptional detail of the individual arteries even at the level of the cortical radiate arteries. When flow is seen all the way to the capsule, this is called cortical blush. Just like the spleen, there is no communication between branches. |
 PATHOLOGY BOX 12-4
Renal Vascular Anatomy
Abdominal aorta—brings blood from the heart to the abdomen
Main renal artery—branch of the aorta that comes off its side wall
Segmental arteries—usually five branches of the renal artery that brings blood to the different parts of the kidney. They course through the renal sinus and branch into the lobar arteries
Lobar arteries—When they reach the minor calyces, they divide into the interlobar arteries.
Interlobar arteries—They run between the pyramids and at the base of the pyramid they bend to form the incomplete arches of the arcuate arteries, which indicates the corticomedullary junction.
Arcuate arteries—They travel across the top of the renal pyramids and give rise to the cortical radiate arteries.
Cortical radiate arteries—These arteries come off the side of the arcuate artery at right angles and pass through the cortex to divide and form the afferent arterioles.
Afferent arterioles—These arterioles send the blood into a high-pressure capillary bed called the glomerulus.
Glomerulus—It is where filtration takes place.
Efferent arterioles—The efferent arterioles receive oxygenated blood from the glomerulus.
Peritubular capillaries—Capillary network that interacts with the tubule.
Venules—The venules receive blood from the peritubular capillaries and start the journey to the main renal vein.
From here the veins run alongside their same named arteries.
Cortical radiate veins—These veins receive the blood from the venules.
Arcuate veins—Receive the blood from the cortical radiate veins.
Interlobar veins—Receive the blood from the arcuate veins and form the main renal vein.
Main renal vein—Takes the unoxygenated blood away from the kidney and back to the heart.
IVC—The renal veins empty into the IVC, which takes the blood back to the heart.
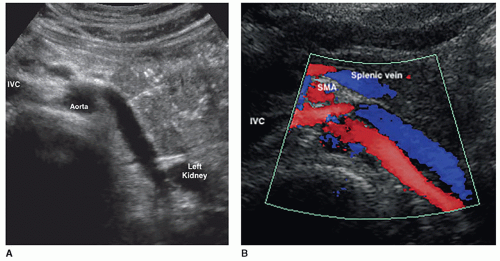 FIGURE 12-14 Renal veins. A: Transverse image from a supine position demonstrating the main left renal vein (LRV) from the kidney to the level of the aorta. As the renal veins are larger in diameter than the artery, it is easily seen on the grayscale image. B: Blue is toward the transducer, and red is away from the transducer. The LRV starts as blue because flow is toward the transducer. At mid aorta, the vein turns downward toward the inferior vena cava (IVC) and is now red because flow is now away from the transducer. |
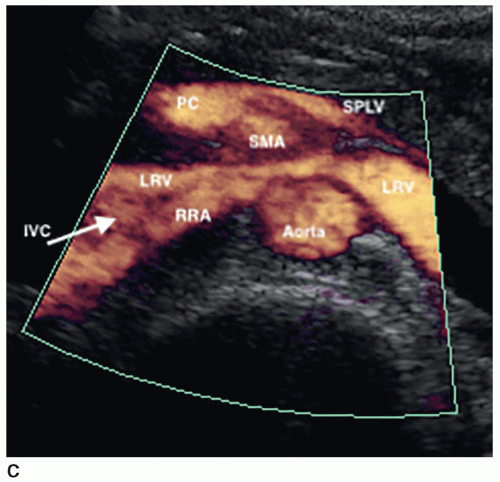 FIGURE 12-14 (continued) C: Power Doppler image of the LRV and surrounding vasculature. The increased resolution of power Doppler allows each vessel to be seen with no bleeding over as can be seen with color Doppler. With color Doppler, the right renal artery (RRA) and LRV are side by side going in the same direction, sometimes making it difficult to separate them, but each vessel is seen individually with power Doppler. PC, portal confluence; SMA, superior mesenteric artery; SPLV, splenic vein. |
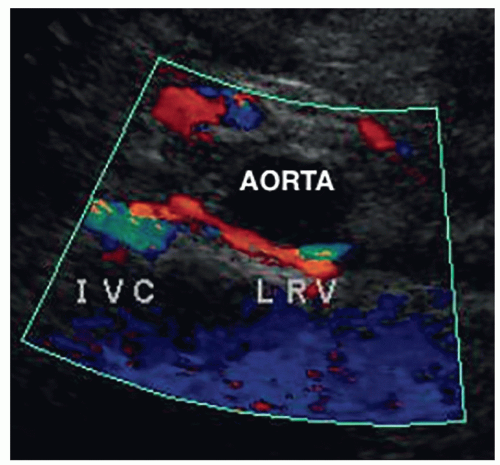 FIGURE 12-15 Color Doppler image of a retroaortic left renal vein (LRV). IVC, inferior vena cava. |
The kidneys play an important role in keeping our body functioning properly by removing and excreting waste products and regulating the amounts of electrolytes in the body. They are responsible for regulating blood pressure by removing excess water from the body as the kidneys need the correct pressure to work properly. The kidneys ensure that the makeup and volume of the fluids in the body are correct by controlling the chemical balance of the blood and regulating the body’s level of sodium, potassium, and calcium. The kidneys control the pH levels of the blood by maintaining an acid-base balance. The kidney is an endocrine organ and secretes several hormones, to maintain normal functioning of the body. If the kidney is not functioning properly, it will affect the entire body, causing organs, especially the liver and heart, to not function properly. The following are some of the hormones the kidneys produce and their function.
Erythropoietin is produced when oxygen levels in the blood are low, which signals the bone marrow to produce mature red blood cells (RBCs) to maintain healthy oxygen levels in our body.
Vitamin D is essential for several body functions. Vitamin D in an inactive form needs to be changed by the kidneys before it can act within the body. Active vitamin D stimulates the uptake of calcium from food, which is important for the maintenance of healthy bones.
Renin regulates angiotensin and aldosterone levels, called the renin-angiotensin system, and together they control blood pressure. If the kidneys are not functioning properly, they can release too much renin, causing vasoconstriction, retaining extra fluid, and increasing the blood pressure, which can lead to hypertension.
The formation of urine involves the following three processes: glomerular filtration, tubular reabsorption, and tubular secretion. Approximately 1,100 to 1,200 mL of blood passes through the kidneys every minute, with more than 90% of the blood going to the nephrons and only a small amount supplying the kidney’s nutritional needs. One-third of the nephrons must function correctly, or the person will need to be on dialysis.
The nephron is the functional unit of the kidney, and each kidney has about 1 million nephrons. The functions of the nephron are to control blood concentration and volume by removing water and solutes as needed, help regulate blood pH, and remove toxic wastes. A nephron is composed of the renal corpuscle and renal tubules (Fig. 12-16A). The renal corpuscle is made up of Bowman capsule, a cup-like structure, and a tuft of capillaries called the glomerulus that sits inside it. The renal tubule is a long, convoluted structure that emerges from the glomerulus and is divided into three parts. The glomerulus and convoluted tubules of the nephron are in the cortex of the kidney, whereas the collecting ducts are in the pyramids of the medulla. The first part of the renal tubule is called the proximal convoluted tubule because it is near the glomerulus. The second part is called the loop of Henle, as it forms a loop with a descending and ascending limb that goes through the renal medulla. The third part of the renal tubule is called the distal convoluted tubule and is only found in the renal cortex and empties its filtrate into collecting ducts that line the medullary pyramids. Nephrons are classified into two types. Most of the nephrons are the cortical nephrons, which start high in the cortex and have a short loop of Henle that does not penetrate deeply into the medulla. Whereas the juxtamedullary nephrons start low in the cortex near the medulla and have a long loop of Henle that penetrates deeply into the renal medulla (Fig. 12-16B).
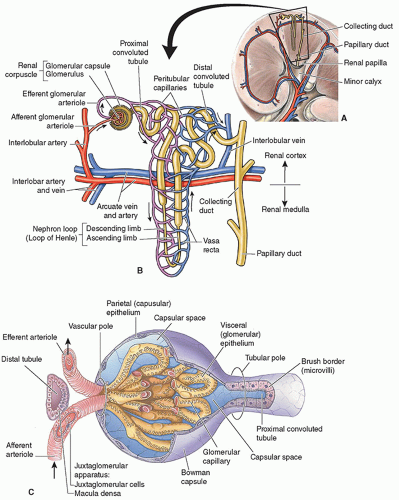 FIGURE 12-16 Nephron. A: Illustration of a nephron showing its relationship with the cortex and medulla. B: A detailed image of a nephron showing the various vessels and tubes and how they interact with one another. The black arrows show the flow of blood from the arterial to the venous side. The yellow tube is the path that urine follows. Recall that the interlobular vessels are now called the cortical radiate vessels. C: A diagram showing how blood enters the capillaries of the glomerulus through the afferent arteriole and exits via the efferent arteriole. (A hint to remember is that they are alphabetical.) The beginning of urine, called the filtrate at this point, exits the glomerulus via the proximal convoluted tubule. |
What follows is basic information on how urine is made, and the reader is encouraged to read a more detailed explanation. Urine is formed by the filtration of blood in the nephron, where substances needed by the body are returned to the blood, whereas waste products and excessive water pass into the collecting ducts as urine. Blood enters the glomerulus via the afferent artery, which comes off the cortical radiate artery. Unlike most capillary beds, the glomerular capillaries will drain into the efferent arterioles rather than venules. The glomerular capillary hydrostatic pressure is affected by the afferent and efferent arteriolar resistance, which is the pressure exerted by fluid on the capillary walls of the glomerulus to provide the force for filtration. As blood pressure increases, it causes the hydrostatic pressure to
increase as well. This causes an increase in the GFR, which increases the amount of water and solutes in the filtrate. The glomerulus is an intertwined group of capillaries and is responsible for filtering the blood. Glomerulus comes from the Latin “glomus,” meaning ball of yarn as the capillaries look like a ball of yarn. The walls of the glomerulus act like a sieve, as they have tiny little holes called fenestrae that allow the smaller molecules of wastes and water to pass into Bowman capsule, whereas the larger molecules of proteins and blood cells will stay in the blood. The small molecules are forced through the fenestrae by the hydrostatic pressure within the glomerulus. The waste products and excessive water pass into Bowman capsule, which funnels these products, called the filtrate, into the proximal tubule. Blood then exits the glomerulus and flows into the efferent arterioles and passes into a set of peritubular capillaries, which follow the collecting tubule (Fig. 12-16C). The interaction between the peritubular capillaries and the tubules returns needed substances to the blood and removes wastes. As the fluid moves through the tubule, the peritubular capillaries reabsorb most of the water, along with nutrients that the body needs. The remaining fluid and wastes in the tubule become urine which drains from the collecting tubule into a minor calyx, which, in turn, empties into a major calyx, then into the renal pelvis, and finally into the ureter to drain the urine into the bladder. Back in the nephron, the blood enters a renal venule and begins the journey to the main renal vein following in reverse the path that the arterial blood used (Fig. 12-17).
increase as well. This causes an increase in the GFR, which increases the amount of water and solutes in the filtrate. The glomerulus is an intertwined group of capillaries and is responsible for filtering the blood. Glomerulus comes from the Latin “glomus,” meaning ball of yarn as the capillaries look like a ball of yarn. The walls of the glomerulus act like a sieve, as they have tiny little holes called fenestrae that allow the smaller molecules of wastes and water to pass into Bowman capsule, whereas the larger molecules of proteins and blood cells will stay in the blood. The small molecules are forced through the fenestrae by the hydrostatic pressure within the glomerulus. The waste products and excessive water pass into Bowman capsule, which funnels these products, called the filtrate, into the proximal tubule. Blood then exits the glomerulus and flows into the efferent arterioles and passes into a set of peritubular capillaries, which follow the collecting tubule (Fig. 12-16C). The interaction between the peritubular capillaries and the tubules returns needed substances to the blood and removes wastes. As the fluid moves through the tubule, the peritubular capillaries reabsorb most of the water, along with nutrients that the body needs. The remaining fluid and wastes in the tubule become urine which drains from the collecting tubule into a minor calyx, which, in turn, empties into a major calyx, then into the renal pelvis, and finally into the ureter to drain the urine into the bladder. Back in the nephron, the blood enters a renal venule and begins the journey to the main renal vein following in reverse the path that the arterial blood used (Fig. 12-17).
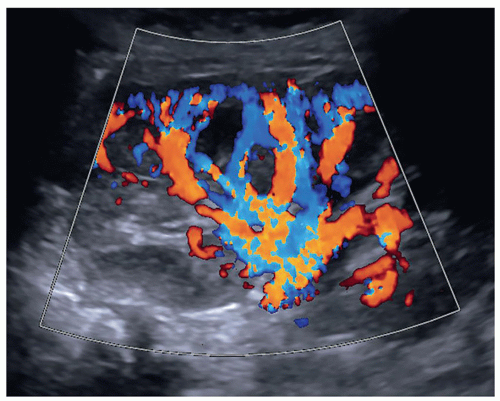 FIGURE 12-17 A color Doppler image showing intrarenal arteries (red) and intrarenal veins (blue). This patient has a fatty liver, so the echogenicity of the renal parenchyma is reduced. |
The position of the kidney can vary slightly from patient to patient. The right kidney is posterior to the liver, whereas the left kidney is posterior to the spleen. The upper poles of the kidneys are partially protected by the 11th and 12th ribs. Once the location of the kidneys has been determined, the contour and internal architecture are evaluated. The contour of a normal kidney should appear smooth. The internal renal has specific sonographic characteristics as described in the following sections.
Renal Capsule
The renal capsule appears sonographically as a bright reflector surrounding the kidney. It is a specular reflector and is only seen when imaged perpendicular to the sound beam (Fig. 12-18).
Renal Cortex
The renal parenchyma is best appreciated on a longitudinal view of the kidney and will demonstrate the cortex and the medullary pyramids. The renal cortex extends from the renal capsule to the bases of the pyramids and into the spaces between them, the columns of Bertin. The normal adult renal cortex is homogeneous with the echogenicity of the cortex less than, hypoechoic, or equal to, isoechoic, to that of the adjacent liver. Studies have shown that the cortex may appear isoechoic to the liver in adults with normal renal function. As the spleen is more echogenic than the liver, a normal left kidney will always be less echogenic than the spleen (Fig. 12-19A). In order to correctly compare the right kidney against the liver, it must be a normal echogenicity. Fatty livers will be markedly increased in echogenicity, and there will be a big difference in echogenicity between the two organs (Fig. 12-19B). Livers with hepatitis can cause the kidney to appear echogenic because of the decreased echogenicity of the liver (Fig. 12-19C, D). When the renal cortex is more echogenic than the liver, this is abnormal and is discussed later in this chapter.
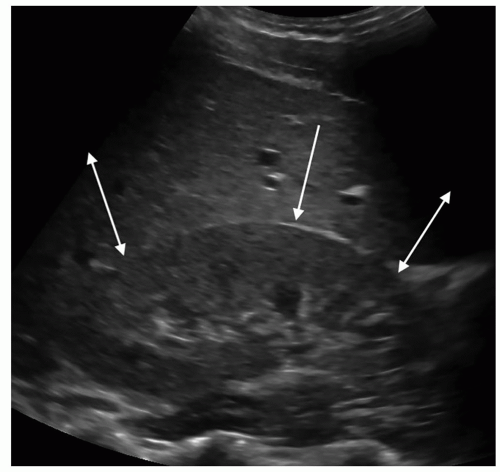 FIGURE 12-18 The arrow is pointing to Gerota fascia where it is echogenic as it is perpendicular to the sound beam. The double-headed arrows are pointing to where the echogenic line disappears. The upper pole seems to blend in with the liver parenchyma. |
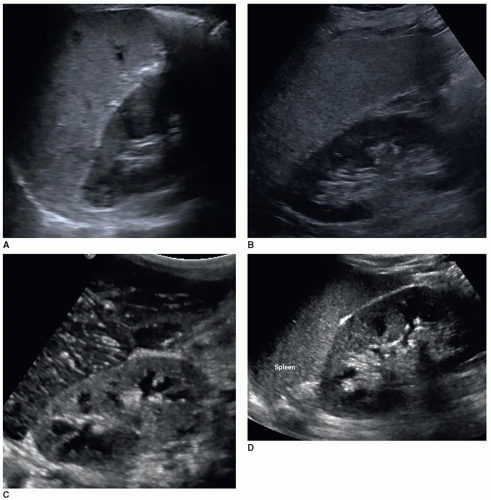 FIGURE 12-19 Kidney echogenicity. A: An image demonstrating that the left kidney is less echogenic than the spleen. It is acceptable to show just the upper pole of the left kidney for the comparison shot when it is difficult to show the entire left kidney. B: Note how the echoes in the kidney are reduced in echogenicity due to the increased attenuation of the fatty liver. C: This patient has hepatitis as seen by the increased echogenicity of the portal triads. To see the parenchyma of the kidney, the overall gain is increased, causing the kidney to appear more echogenic than the liver. D: Same patient as in C showing the normal relationship between the spleen and the left kidney, verifying that the echogenicity of the right kidney is normal. |
Renal Medulla
Posterior to the cortex is the inner portion of the renal parenchyma, which is called the medulla and contains the renal pyramids. The renal pyramids are uniform in distribution and in size and shape. The broader base of each pyramid faces the cortical area, and its apex or papilla points toward the renal pelvis. Sonographically, the medullary pyramids are cone or triangle shaped and are hypoechoic relative to the renal cortex and can be seen in about 50% of normal adults. The pyramids are more visible when the kidney cortex is echogenic (Fig. 12-20).
Renal Sinus
The renal sinus is the central portion of the kidney and contains the major and minor calyces, the renal pelvis, renal vessels, fat, nerves, and lymphatics. The fat in the sinus
is an extension of the perirenal fat. The renal sinus will appear as an oval highly echogenic structure in the center of the kidney. This bright echogenicity is not because the renal sinus is a dense structure but is caused by the multiple interfaces from fat, the calyces, renal pelvis, vessels, and lymphatics. The normal renal sinus should be more echogenic than both the normal renal cortex and the normal liver. The renal cortex is the least echogenic structure in the upper abdomen, whereas the renal sinus is the most echogenic structure (Pathology Box 12-5).
is an extension of the perirenal fat. The renal sinus will appear as an oval highly echogenic structure in the center of the kidney. This bright echogenicity is not because the renal sinus is a dense structure but is caused by the multiple interfaces from fat, the calyces, renal pelvis, vessels, and lymphatics. The normal renal sinus should be more echogenic than both the normal renal cortex and the normal liver. The renal cortex is the least echogenic structure in the upper abdomen, whereas the renal sinus is the most echogenic structure (Pathology Box 12-5).
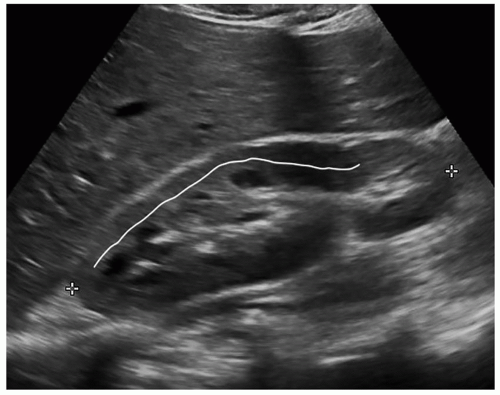 FIGURE 12-20 Longitudinal of the right kidney demonstrating several pyramids and the medulla tissue between them. The white line represents the border between the cortex and the medulla. This kidney is slightly more echogenic than the liver. |
Renal Pelvis
The normal renal pelvis is not seen with US unless it is dilated. If the patient is well hydrated, the renal pelvis may sometimes be seen as a lighter gray echo pattern inside the echogenic renal sinus.
Ureter
From the renal pelvis, urine flows into the ureters, which are approximately 25- to 30-cm long and 3 to 4 mm in diameter. The smooth muscle wall of the calyces, pelvis, and ureters contracts rhythmically and propels urine by peristalsis to the bladder where it is stored. The ureter is not seen sonographically unless it is dilated. When dilated, the proximal ureter can be seen, leaving the kidney. There are three areas along the course of the ureter where it narrows, allowing a stone to become stuck: at the UPJ, as the ureter enters the pelvis and crosses over the common iliac artery bifurcation, and at the ureterovesical junction (UVJ), which is the most common place (Pathology Box 12-6).
 PATHOLOGY BOX 12-5
Normal Echogenic Relationships in the Abdomen from Brightest to Least Echogenic
Renal sinus
Pancreas
Spleen
Liver
Renal cortex
 PATHOLOGY BOX 12-6
The Ureter
25-35 cm in length
3-4 mm in diameter
Common places where stones can get stuck:
UPJ
Where it crosses over the iliac vessels
UVJ
One of the most common requests for a renal sonogram is elevated blood urea nitrogen (BUN) and creatinine, especially on patients in a hospital. However, there are other laboratory values that the sonographer should understand. Because the sonogram is of the kidneys, there will be both blood and urine lab tests to evaluate. Fortunately, it is not necessary to know the range of normal values because the report will give the range of normal values used by that lab along with high or low values highlighted on the report (Pathology Box 12-7).
Blood Tests
BUN measures the amount of urea nitrogen in the blood. It is usually ordered along with creatinine to help evaluate renal function. Urea nitrogen is a normal waste product in the blood that comes from the breakdown of protein from food during digestion.
The formation of urea begins in the liver. Proteins that are used by the cells of the body produce ammonia. Ammonia is highly toxic and cannot be allowed to accumulate. In the liver cells, carbon dioxide reacts chemically with the ammonia and produces urea. Urea is next released into the bloodstream as a small water-soluble molecule. It is filtered out by the kidneys and excreted in the urine. BUN increases in renal failure, renal parenchymal disease, obstructive uropathy, congestive heart failure (CHF), dehydration, hemorrhage, and eating a high-protein diet. Values can decrease in liver failure, overhydration, pregnancy, and not consuming enough protein. BUN can also increase with age.
Creatinine is a waste product produced by the muscles from the breakdown of the compound creatine and is removed from the blood by the kidneys, primarily by glomerular filtration, and eliminated from the body in the urine. It is more sensitive than BUN to evaluate renal function. The amount of creatinine produced depends on body size and muscle mass, and therefore, creatinine levels can be slightly higher in men. Increased creatinine can be caused by glomerulonephritis, acute
tubular injury (ATI), complication of diabetes, blocked urinary tract, and certain medications such as Bactrim, Zantac, Tagamet, Tricor, cephalosporin antibiotics such as Keflex, and chronic or excessive nonsteroidal anti-inflammatory drug (NSAID) use. It is uncommon to have low levels of creatinine and is usually not a cause for concern. Increased BUN and creatinine levels in the blood indicate decreased renal function.
BUN/creatinine ratio. When the BUN levels are compared with the creatinine levels, it gives a better understanding of kidney function and is known as the BUN/creatinine ratio. The BUN/creatinine ratio is useful to help differentiate between acute and chronic renal disease. An increase in BUN/creatinine ratio can be caused by renal disease, such as AKI, dehydration, gastrointestinal (GI) bleeding, hyperthyroidism, CHF, and certain antibiotics and corticosteroids. This ratio can also increase with age and decreasing muscle mass. A low BUN/creatinine ratio can be caused by advanced liver disease, renal failure, hypothyroidism, and diets poor in protein.
eGFR is a calculation of the GFR and provides a more accurate indicator of kidney function. It is the volume of fluid filtered from the glomerular capillaries into Bowman capsule per unit time. It is calculated from a formula based on the creatinine serum test and other factors including age and gender. GFR is a measure of functional renal mass and is influenced by glomerular capillary hydrostatic pressure and renal blood flow. It indicates how well the glomerular filtration process is working and can be used to help determine the stage of kidney disease so that the best treatment can be determined. The eGFR can decrease with primary renal disease, decreased renal perfusion, or obstructive renal disease. Patients with renal artery stenosis can be at risk of having a decreased eGFR due to the reduction of blood to the glomerulus. An eGFR score below 60 mL/min/1.73 m2 (milliliters of cleansed blood per minute per body surface) suggests kidney disease, and an eGFR below 15 mL/min/1.73 m2 indicates ESRD and the patient needs to be started on dialysis. eGFR can decrease with age. This is one lab value where the higher the number, the better the outcome.
An increase in RBCs can be seen in patients with renal cell carcinoma (RCC). A low RBC count, which can cause anemia, can be seen in chronic renal disease.
An increase in white blood cells (WBCs) can be seen in patients with an infection or inflammatory process such as pyelonephritis and has been seen in patients with kidney stones. A low WBC count has been associated with CKD in the elderly.
 PATHOLOGY BOX 12-7
Renal Blood and Urine Tests
Renal blood tests
BUN measures the amount of urea nitrogen in the blood. Used to help determine renal function
Increases in
Renal failure
Parenchymal disease
Urinary obstruction
Decreased blood flow
Dehydration
Decreases in
Liver failure
Overhydration
Pregnancy
With age
Creatinine is a waste product from the breakdown of the compound creatine produced by the muscles. It is removed from the blood primarily by glomerular filtration and eliminated in the urine. It is more sensitive than BUN to evaluate renal function.
Increases in
Glomerulonephritis
ATI
Diabetics
Urinary obstruction
Decreased blood flow
Certain medications such as Bactrim, Zantac, Tagamet, Keflex, and chronic or excessive use of NSAIDs
Decreased values are not a concern for renal function
eGFR
Accurate indicator of kidney function as it measures how well the glomeruli are filtering the blood.
Decreases when there is decreased blood flow to the glomerulus, urinary obstruction, and primary renal disease.
Increases values are not a concern.
Urine tests
Proteinuria occurs when protein or albumin is passing through the glomerulus or tubules and is ending up in the urine.
Causes include
Diabetes
Hypertension
Glomerulonephritis
Nephrotic syndrome
Overuse of NSAIDs
Renal vein thrombosis
Hematuria is when there are RBCs in the urine. The bleeding can happen anywhere in the urinary system.
Causes include
UTI
Pyelonephritis
Kidney stones
Prostate enlargement
Post-kidney biopsy complication
TCC
Renal vein thrombosis
Cystitis
Urine Tests
Proteinuria is when there is a high amount of protein in the urine and is an indication of an underlying disease that needs to be determined. Normally, the plasma proteins are too large to go through the filtration process in the glomerulus. The smaller proteins, usually albumin, that pass through the glomerulus are reabsorbed by the tubules. Proteinuria occurs when either the glomeruli or tubules in the kidney are damaged. When there is kidney damage, the protein that goes through the filter is not reabsorbed back into the blood but passes into the urine. The most common cause of proteinuria is seen in patients with diabetes or hypertension. Other causes include patients with glomerulonephritis, nephrotic syndrome, or certain medications, especially NSAIDs, and patients with renal vein thrombosis. Some patients may have temporary proteinuria, particularly in younger people after exercise or during an illness, patients who are dehydrated, and patients who are under emotional stress. Proteinuria due to exercise usually resolves in 24 hours. Persistent high levels of protein in the urine may indicate kidney disease. Low levels of protein in the urine are normal.
Albuminuria is when there is too much albumin protein in the urine. Because albumin is a type of protein and the main protein found in proteinuria, the two terms are used interchangeably, although they are not the same thing. Other proteins can be found in proteinuria, whereas albumin is the only protein in albuminuria. Because albumin molecules are small, they are among the first protein to pass through the filtration process and end up in the urine. When the kidneys are functioning properly, there should be no albumin seen in the urine. Albuminuria is the earliest indicator of glomerular disease and is seen with cardiovascular disease. The most common cause is diabetes and can be an early indicator of diabetic nephropathy. Other causes include hypertension, cirrhosis, heart failure, and lupus.
Microalbumin/creatinine ratio is usually used to screen people who are at higher risk for kidney disease. The test measures the albumin and creatinine in a urine sample collected randomly, as opposed to a timed collection, and an albumin-to-creatinine ratio is calculated. An albumin-to-creatinine ratio is calculated by dividing albumin concentration in milligrams by creatinine concentration in grams. Creatinine is released into the urine at a constant rate, and its level in the urine is an indication of urine concentration. This property of creatinine allows its value to be used to correct for urine concentration when measuring albumin in a random urine sample. This provides a more accurate indication of the how much albumin is in the urine. If the albumin-to-creatinine ratio shows albumin in the urine, the patient may be tested again to confirm the results. If the results continue to show albumin in urine, it is suggestive of early-stage kidney disease. If the test results show high levels of albumin, it is suggestive of renal failure.
Hematuria is when there are blood cells in the urine. Hematuria may be defined as microscopic hematuria, when the blood cells are only seen with a microscope, and gross hematuria, when the blood in the urine can be seen with the eye. Blood can come from the kidneys or other parts of the urinary tract. Hematuria is a symptom and not a disease, and the treatment is dictated by the cause. Causes of hematuria include a urinary tract infection (UTI), pyelonephritis, kidney stones, prostate enlargement, post-kidney biopsy complication, kidney trauma, bladder or kidney transitional cell carcinoma (TCC), renal vein thrombosis, and cystitis. Medications such as aspirin, Coumadin, or Plavix can cause hematuria. Intense exercise or sustained aerobic exercise can be the source of hematuria, and often, the urine clears up in a few days. Runners are most often affected. Sometimes, the cause of hematuria cannot be identified.
Sonographers will need to select the correct transducers, patient positions, technical controls, and protocol. It is important for the sonographer both to attend the patient and to scan properly to reduce their scanning-related risks for musculoskeletal (MSK) injuries.
Patient Preparation
No patient preparation is needed for a renal sonogram. If the bladder needs to be imaged, then it must contain urine and the patient should drink 16 to 24 ounces of fluid about 30 minutes before the examination. If an abdominal study is also ordered, then the patient will need to be NPO (nothing by mouth) for 6 to 8 hours.
Transducer
The most common transducer to use is a curved linear-array transducer of the appropriate frequency for the size of the patient. Common frequencies used are in the 1 to 6 MHz range. To scan between the ribs, a sector transducer may be utilized. Scanning is usually performed with harmonics turned on, but this can cause penetration issues, especially on patients with fatty livers. If the echoes in the far field are absent or washed out, owing to the overall gain being increased, turn harmonics off and evaluate the image. It may be a more diagnostic image without using harmonics. Sometimes, the sonographer may need to take two images, one with and one without harmonics, to have images with the best resolution and an image with proper penetration (Fig. 12-21A, B). Compound imaging is another control that can be used to help reduce artifacts in the image. Sometimes, it may interfere with the acoustic shadow or enhancement artifacts. Always try scanning with these controls on and off to see which gives the better image.
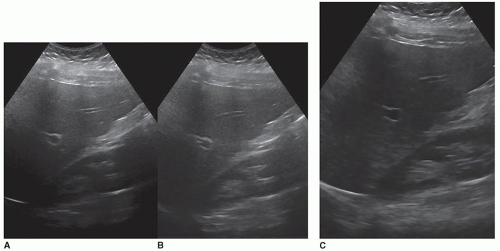 FIGURE 12-21 Technical settings. A: This patient has a fatty liver with the image obtained using harmonics and no other adjustments made. The vascular structures in the liver are full of echoes, and there are no echoes in the far field of the liver and in the renal parenchyma. B: The same patient with the overall gain increased to see the far-field echoes and the time gain compensation adjusted to help balance the image. Echoes in the kidney parenchyma are seen, but the vascular structures still have echoes inside them. The overall image looks grayed out. C: This is the same patient with harmonics turned off. The parenchymal echoes in the liver and kidney are now seen, and cystic structures remain echo free. Overall, this is a much better image than image B. Harmonics does not always improve the image but can degrade it. |
Patient Position
The native kidneys are scanned in a supine position to start, using the liver and spleen as acoustic windows. Usually, the transducer is placed subcostal on the side of the patient aiming toward the midline, making the imaging plane is a variation of a coronal plane. Images may also be obtained from an intercostal approach. Usually, both approaches are needed. If the kidneys are not adequately seen from a supine position, then a posterior oblique position can be tried. If one or the other kidney is still not very well seen, then scanning the kidney from a right or left lateral decubitus view may allow better visualization of the kidney. If the kidneys are still not optimally seen, scanning them with the patient in a prone position can often visualize them as there will be no issue with the ribs or bowel gas. When scanning in a prone position, a pillow or a rolled sheet can be placed under the abdomen at the level of the kidneys to help increase the space between the iliac crest and the ribs. This is a good position to scan newborns. Because turning a patient into a prone position can be difficult, one work around is while the patient is in a decubitus position, place the transducer on the back of the patient as if they were in a prone position (Fig. 12-22). It may take scanning the patient in a variety of positions to properly evaluate the entire kidney.
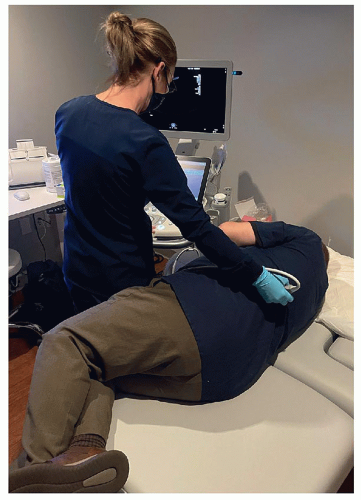 FIGURE 12-22 The patient is in a right lateral decubitus, or left side up, position with the transducer perpendicular to the skin at the level of the left kidney. |
Transducer Positions
The long axis of the kidney is in an oblique plane, so the transducer will also need to be in an oblique plane. When the patient is supine, the kidneys are closer to the stretcher as they are retroperitoneal organs and located in the back of the patient. Having the transducer in the middle of the side of the patient is typically not a good spot to see the kidney. The transducer should be near the stretcher and angled toward the abdominal wall, until the kidney is seen. (Sometimes, the sonographer’s hand is resting on the stretcher to see the kidney.) If the upper pole is not well seen owing to the angle of reflection issues, moving the transducer up toward the head and scanning between the ribs will give a better angle and the upper pole can be better appreciated (Fig. 12-23A, B). In transverse images, the upper pole can be obtained between the ribs, the mid from either an intercostal approach, especially the left kidney, or a subcostal approach and the lower poles from a subcostal approach (Fig. 12-24A-C).
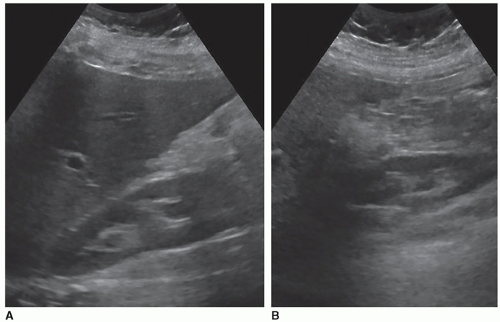 FIGURE 12-23 Approaches to visualize the long kidney. A: Using an intercostal approach, the upper pole and middle of the kidney are well demonstrated. The lower pole has some bowel interference and is not visualized well. B: This image is obtained from a subcostal approach, and the upper half of the kidney is not seen due to bowel gas. The lower pole is best seen from this approach. The sonographer should image the kidney with both intercostal and subcostal approaches. |
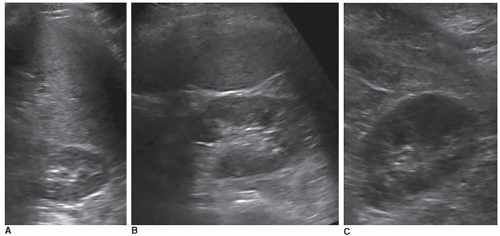 FIGURE 12-24 Approaches to visualize the transverse kidney. A: Transverse image of the upper pole of the left kidney from an intercostal approach. B: Transverse image of the mid pole of the left kidney from an intercostal approach. C: Transverse image of the lower pole of the left kidney from a subcostal approach. |
Breathing Technique
When the patient is scanned from a subcostal approach, a deep inspiration will bring the kidneys down from under the ribs. When scanning from an intercostal approach, the goal is to get the kidney in a good position between the ribs. This can take trying a variety of breathing styles, including having the patient in quiet breathing, which is letting the patient breath normally or in a full or partial expiration. On some patients, a combination of breathing styles and approaches may be needed. For example, to see the upper pole of the kidney, an intercostal approach is used with the patient is in full expiration, whereas the lower pole is best seen from a subcostal approach with the patient in a deep inspiration.
Bladder Images
This section discusses when to include the bladder as part of the examination. The anatomy and pathology of the bladder is discussed in Chapter 13.
In some departments, a renal sonogram always includes longitudinal and transverse images of the bladder, whereas in other departments, it is only scanned when clinically indicated. To evaluate the bladder, there needs to be some urine inside of it.
When there is bilateral hydronephrosis, the bladder should be scanned to see if it is too full and causing the hydronephrosis. If the patient has a full bladder, ask them to take their time and empty their bladder fully. (Some patients will quickly empty their bladder but not fully because they do not want to hold up the room.) After the bladder is emptied, the kidneys should then be rescanned to evaluate if the hydronephrosis stayed the same or went away. If there is still some degree of hydronephrosis present, recheck the bladder to evaluate how full it is.
When there is hematuria clinically, images of the bladder should be obtained to evaluate if the bladder is the source of the bleeding. Kidney stones, blood clots, tumors, or thickened bladder walls caused by cystitis can all be the causes of the hematuria.
If there is a concern for kidney stones, color Doppler should be used to evaluate the bladder for ureteral jets. The speed of the urine leaving the ureter is fast enough to produce a Doppler shift, and the jet can be appreciated with color Doppler as a sudden burst of color in the bladder toward the transducer (Fig. 12-25). Normally, ureteral jets should occur twice or more per minute and should be symmetric with color Doppler in a healthy individual. The jets are directed upward and toward the contralateral side crossing the midline. A nonobstructive stone is suspected with a weak jet or when color constantly “dribbles” out of the ureteral orifice. If a color jet is not visualized, then obstruction should be suspected, especially if multiple jets have been seen on the contralateral side.
Doppler
This section discusses when to add color and spectral Doppler to the examination. Renal arterial and venous Doppler examinations are discussed in Chapter 6.
Color and spectral Doppler may need to be added to a routine renal US for various reasons, such as patients with pyelonephritis, medical renal disease, and evaluation of a renal mass. The renal preset should be used over a general or abdominal one. A renal preset optimizes the US machine, especially the Doppler settings, for the kidneys, whereas the general or abdominal presets are optimized for the liver (Fig. 12-26A, B). The sonographer should adjust the color velocity scale and color gain to appropriate settings to allow for good visualization of flow inside the kidney and in the main renal vessels.
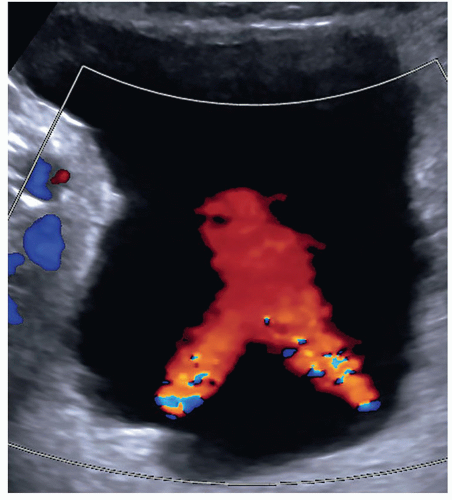 FIGURE 12-25 A good example of bilateral bladder jets indicating that there is no obstruction present. In some patients, it may be necessary to take an image of each jet. |
The following paragraphs of this section discuss scenarios when color and spectral Doppler would be appropriate to include with a routine renal examination. It should be noted that adding color and spectral Doppler to an examination does not automatically allow the sonographer to upcharge to a more expensive renal Doppler study that was not originally ordered. The billing or coding department should be consulted as up-charging inappropriately puts the department at risk for being fined for fraudulent coding.
Some departments might require a color Doppler image with or without a spectral Doppler waveform of the main renal artery and vein at the hilum of the kidney to assess inflow and outflow in all studies. Some clinicians just want to know that there is flow to the kidney and flow leaving the kidney. In some patients, the renal vein may be prominent or dilated, which could mimic hydronephrosis. Color Doppler should be used to investigate this area of dilatation to show if it is a vein (Fig. 12-27A-E).
The resistive index (RI) is an arterial measurement that is obtained from the interlobar artery and relates to renal vascular resistance and is influenced by the amount of diastolic flow. This measurement reflects the condition of the vascular bed where blood flow is traveling.
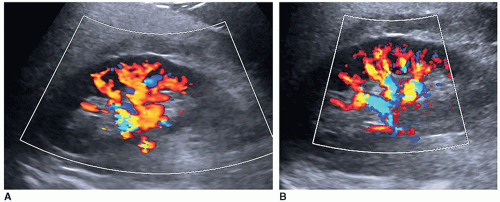 FIGURE 12-26 Renal presets. A: Flow inside the kidney using a general setting. The flow is very “blobby” looking because color is bleeding outside the border of the vessel. B: Same kidney using the renal preset. Note the difference in the appearance of the renal vessels. When using the renal preset, the vessels are more defined and flow is seen out to the capsule. |
The RI is determined by the following equation:
RI = peak systole − end diastole/peak systole
The RI is calculated by the US unit and is determined by the sonographer placing the calipers at peak systole and end diastole. An RI does not require the use of angle correction. The normal kidney should have an RI between 0.6 and 0.7. A RI greater than 0.7 is suggestive of increased vascular pressure, resistance, or compliance inside the kidney. It is important to properly measure the signal as it is easy to mistake noise or mirror artifact for diastolic flow (Fig. 12-28A-E). Observing the color Doppler pattern will help determine when end diastole occurs. If the color is flashing, that is, the arterial flow completely disappears in diastole, then there is no flow in end diastole and the RI is 1. If the arterial flow just about disappears and end-diastolic flow is minimal, then the RI will be greater than 0.8. If the arterial flow is seen very well during diastole, then the RI will be normal, less than 0.7. End-diastolic flow is correctly measured right before the next systolic upstroke as this represents the end of the diastolic cycle. End-diastolic flow should not be measured where diastolic flow stops if it is before the systolic upstroke. Some common examples when an RI should be measured in a kidney include patients with medical renal disease, those with AKI, those with CKD, and patients with hypertension caused and not caused by renal artery stenosis.
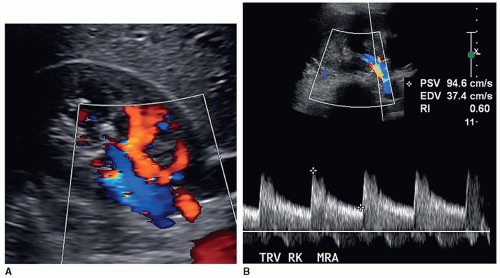 FIGURE 12-27 Color and spectral Doppler. A: Color Doppler image of the right kidney at the hilum showing a normal main renal artery (MRA) and main renal vein. B: Spectral Doppler of the MRA with a low resistive signal and a velocity of 94.6 cm/sec and a resistive index (RI) of 0.60. |
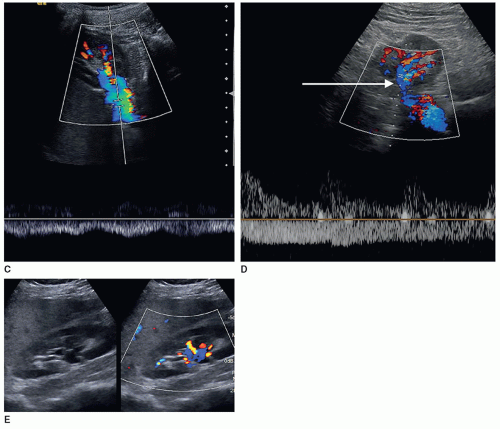 FIGURE 12-27 (continued) C: Spectral Doppler of the main renal vein showing a normal continuous waveform with respiratory variations. D: Spectral Doppler of the main renal vein with an arterial signal. To eliminate the arterial signal, the sample volume could have been placed a little lower (arrow). On some patients, it may be difficult to separate the two signals, which may be acceptable. E: There is dilatation that looks like mild hydronephrosis. A split screen or dual image proving that the dilated area in the hilum is the renal vein and not hydronephrosis. |
A color or power Doppler image of the entire kidney should be obtained to show perfusion in patients with AKI or CKD to evaluate for flow inside the kidney (Fig. 12-29). Patients who have pyelonephritis need a perfusion image to look for areas of flow voids that might be caused by early abscess formation. A common reason is to show perfusion in a “pseudotumor” on a patient with a dromedary hump or fetal lobulations to show that these areas have normal perfusion (Fig. 12-30A-C). A renal mass will not demonstrate perfusion but flow on the border of the mass and sometimes specs of color inside the mass.
An uncommon reason is when one kidney is unexpectedly found to be very small, less than 6 cm, to document for renal artery occlusion by showing a lack of flow in the kidney (Fig. 12-31).
Color Doppler can be helpful in identifying small stones as it produces what is called the twinkling artifact that is caused by the calcium in the stone. Any bright echoes in the kidney should be investigated with color Doppler. The twinkling artifact does not occur with every stone nor does seeing the artifact always mean that it is caused by a stone (Fig. 12-32A-C).
RENAL PROTOCOL8
The following suggested protocol is based on the current protocol, at the time of publication, found on the American Institute of Ultrasound in Medicine (AIUM) or the American College of Radiology (ACR) website. Besides the AIUM and ACR, the Society for Pediatric Radiology (SPR) and the Society of Radiologists in Ultrasound (SRU) have worked together to create this protocol. The renal protocol is found in the document entitled Practice Parameter for the Performance of an Ultrasound Examination of the Abdomen and/or Retroperitoneum.
Vascular protocols can be found on the ACR website and the Intersocietal Accreditation Commission Vascular Testing (IAC VT) website. These protocols are free, and
you do not have to be a member of the organization to download them. They can be found on each organization’s website and should be reviewed annually for any changes. This is important as current protocols are what accreditation reviewers will use to judge your examinations. The following required images are a small representation of what a sonographer sees while scanning. The images should be sufficient and technically accurate to provide the interpreting physician the information needed to make a correct diagnosis. All pathology must be documented in at least two planes. Some departments may require a video clip through each kidney.
you do not have to be a member of the organization to download them. They can be found on each organization’s website and should be reviewed annually for any changes. This is important as current protocols are what accreditation reviewers will use to judge your examinations. The following required images are a small representation of what a sonographer sees while scanning. The images should be sufficient and technically accurate to provide the interpreting physician the information needed to make a correct diagnosis. All pathology must be documented in at least two planes. Some departments may require a video clip through each kidney.
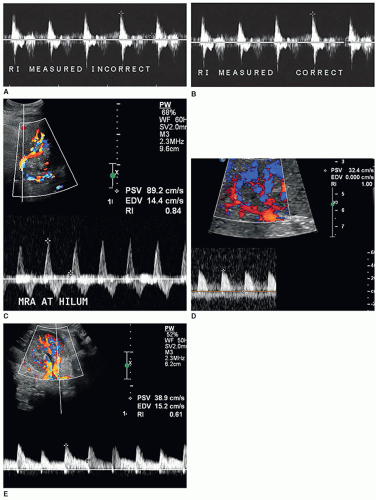 FIGURE 12-28 Diastolic flow. A: The end-diastolic flow on this spectral Doppler signal is measuring flow from an adjacent vessel. Note how the systolic flow is a bright white signal and the diastolic flow is gray. Closely evaluating the false diastolic flow, the signal can be seen going through the systolic signal. B: Same signal with the diastolic flow being properly measured at the baseline as there is no diastolic flow at the end of diastole. C: An example of noise being measured for diastolic flow. Here the signal can be seen going in front of the systolic signal. This is a biphasic arterial signal, and these signals and triphasic signals do not have flow at the end of diastole. D: A properly measured end diastole despite the signal being seen through diastole. This is a monophasic arterial signal, and they do not have end-diastolic flow. The signal appears to be a mirror image artifact of the venous flow. E: An example of a properly measured normal signal. MRV, main renal vein. |
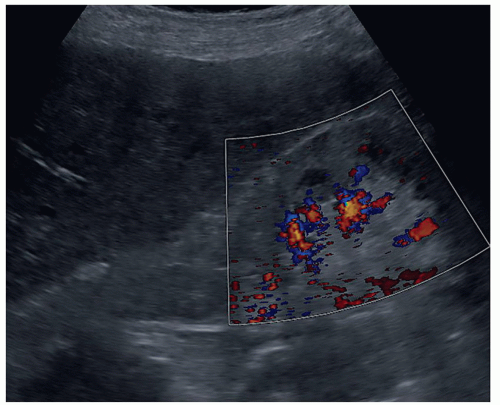 FIGURE 12-29 A color Doppler image of a patient with an echogenic kidney due to an acute kidney injury from computed tomography contrast agent demonstrating the poor flow in the kidney. |
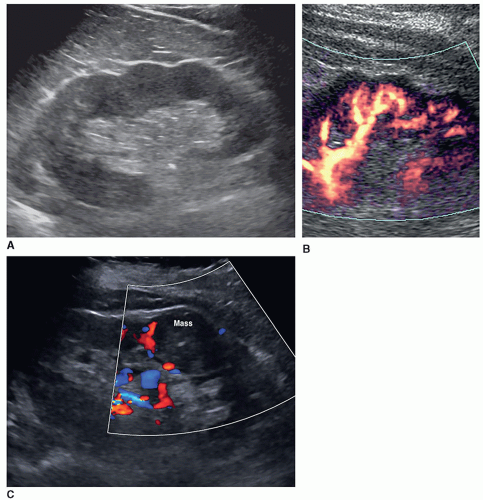 FIGURE 12-30 Pseudotumor. A: Left kidney with fetal lobulations. This is probably a normal kidney; however, one of the “bumps” could be caused by or is hiding a small renal mass. Adding color or power Doppler demonstrates normal renal flow through these areas. B: Power Doppler of another kidney showing the lobular areas with normal renal flow. C: An image of a solid renal mass, likely renal cell carcinoma. There is no normal renal perfusion seen inside the mass. |
Before starting the examination, the sonographer should take the time to look at the patient’s medical history, any imaging reports, and the appropriate lab values. Remember for the kidney to check both blood and urine lab values, which should only take a few minutes. Make sure that the room is prepared and that all needed transducers and supplies are handy. Before scanning, introduce yourself, and explain the sonogram including what they should expect during the examination,
breathing requirements, the different positions that may be needed, and how long the examination will take. Ask the patient if they have any questions and their understanding of why they are having the test. Now, you are ready to start scanning!
breathing requirements, the different positions that may be needed, and how long the examination will take. Ask the patient if they have any questions and their understanding of why they are having the test. Now, you are ready to start scanning!
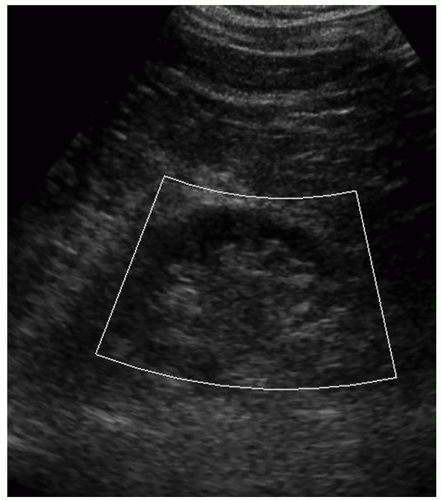 FIGURE 12-31 Power Doppler image showing no flow inside an unexpected small kidney compatible with renal artery occlusion. Patients usually do not feel anything when this occurs, and if the other kidney is functioning normally, lab values and urine output are not affected. |
Longitudinal Images
A long-axis image of the middle of the kidney measuring the longest length of the kidney and the renal cortical thickness. One to two longitudinal images of the kidney documenting from midline to its lateral border. One to two longitudinal images of the kidney documenting from midline to its medial border. An image demonstrating the liver and right kidney together and the spleen and left kidney together for parenchymal comparison (Fig. 12-33A-E).
Transverse Images
A transverse image at the mid pole of the kidney, with the transducer angled to be perpendicular to the kidney. Note that the current AIUM/ACR/SRU/SPR protocol does not require a transverse or an anteroposterior (AP) (or height) measurement, but some departments still may require these measurements. The department can add to a protocol, but they cannot delete any required images. Next one to two transverse images of the kidney documenting from the upper pole to the mid kidney and one to two transverse images of the kidney documenting from the mid kidney to the lower pole (Fig. 12-34A-E).
Additional Images
Some departments might require a color Doppler and spectral Doppler waveform of the main renal artery and vein at the hilum (Fig. 12-35A-C). Some protocols may require images of the bladder and images of bladder jets on all patients. Images to determine postvoid residual volume are not routinely documented unless these images are requesting by the physician (Fig. 12-36) (Pathology Box 12-8).
At times, the kidney or renal sinus will not demonstrate their normal US appearance. However, these kidneys may have normal lab values and normal urine output and will be in their proper anatomic position. In these cases, the kidneys are called normal variants (Pathology Box 12-9).
Dromedary Hump
The dromedary hump is a common variation of kidney shape and is caused by the splenic impression onto the superolateral mid pole of the left kidney. It is called a dromedary hump because it resembles the hump of a dromedary camel. Sonographically, it appears as a focal bulge in the mid-pole region, giving the kidney a more triangular shape. This area will have the same echo texture as the surrounding kidney tissue (Fig. 12-37). A dromedary hump is considered a renal pseudotumor as it may mimic the appearance of a renal mass. To differentiate between the two, interrogating the area with color or power Doppler will demonstrate normal parenchymal flow patterns, whereas a renal mass will show peripheral flow around the mass with possibly scattered flow inside (Fig. 12-38A-C).
Persistent Fetal Lobulations
Embryologically, the kidneys originate as distinct lobules that will fuse together as they develop. When these lobules do not fuse and there is incomplete fusion of the developing renal lobules, this is termed persistent fetal lobulations. This gives the kidney a bumpy contour or outline, as opposed to a smooth, flat, and continuous one. Persistent fetal lobulations have been described as indentations or a scalloped appearance of the renal outline between the renal pyramids (Fig. 12-39). Like the dromedary hump, fetal lobulations are considered pseudotumors and can be worrisome for a renal mass. Color or power Doppler should be used to document normal parenchymal flow underneath these “bumps” (Fig. 12-40A, B).
Columns of Bertin
Columns of Bertin are a normal variant where there are double layers of renal cortex between the renal pyramids, thus widening the space between them. They are named after Exupere Joseph Bertin, a French anatomist, who first
described them in 1744. Columns of Bertin are not hypertrophic tissue but occur because of an incomplete fusion of the fetal lobes, causing two adjacent septa to become a large column with double the thickness. Columns of Bertin are present in approximately 50% of the population, with 20% being bilateral.
described them in 1744. Columns of Bertin are not hypertrophic tissue but occur because of an incomplete fusion of the fetal lobes, causing two adjacent septa to become a large column with double the thickness. Columns of Bertin are present in approximately 50% of the population, with 20% being bilateral.
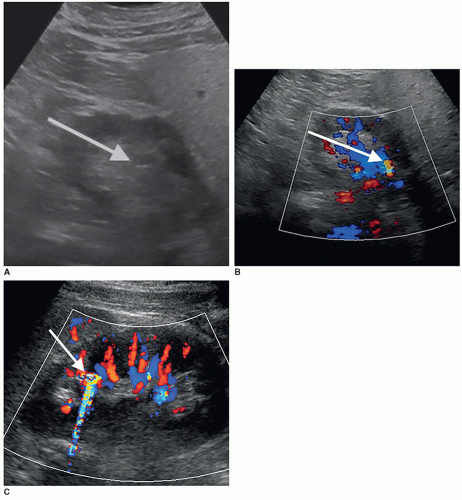 FIGURE 12-32 Kidney stones and color Doppler. A: Patient with a history of kidney stones presented with sudden right back and flank pain. The arrow is pointing to an echogenic structure in the mid kidney area. B: Color Doppler image of the echogenic area demonstrating a color Doppler twinkle artifact (arrow), making this structure suspicious for a kidney stone. The patient passed a small stone the next day. C: Color Doppler image demonstrating the color Doppler twinkle artifact on a larger stone (arrow). The twinkle artifact can be a variety of lengths. |
Sonographic criteria include indentation of the renal sinus, continuous with the adjacent renal cortex, and have the same echogenicity as that of the cortex. They can present with varying depths within the medullary substance of the kidneys and are usually located at the junction of the upper and middle thirds of the kidney. They have been described
as a renal pseudotumor; however, the echogenicity of the column is isoechoic and continuous with the renal cortex (Fig. 12-41). Columns of Bertin may indent deep into the renal sinus and mimic a duplicated collecting system; however, a transverse scan through the column will demonstrate the echogenic sinus at the bottom (Fig. 12-42).
as a renal pseudotumor; however, the echogenicity of the column is isoechoic and continuous with the renal cortex (Fig. 12-41). Columns of Bertin may indent deep into the renal sinus and mimic a duplicated collecting system; however, a transverse scan through the column will demonstrate the echogenic sinus at the bottom (Fig. 12-42).
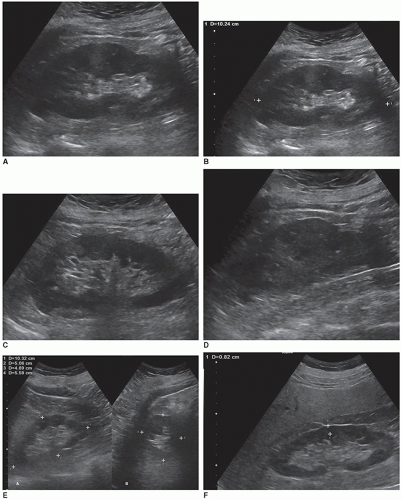 FIGURE 12-33 Longitudinal images. A: Long axis of the length of the left kidney. B: Same image with measurement of the length of the kidney. Measurements are best if both poles can be seen. C: The transducer is now angled medially to see the medial aspect of the kidney. In this image, the sinus echoes are well seen and may extend to the posterior border of the kidney. D: The transducer is now angled laterally to see the lateral aspect of the kidney. In this image, mostly parenchyma is seen. E: Both longitudinal and transverse kidney measurements (calipers) demonstrated within a dual screen. F: Longitudinal kidney demonstrating the measurement (calipers) of its cortical thickness. |
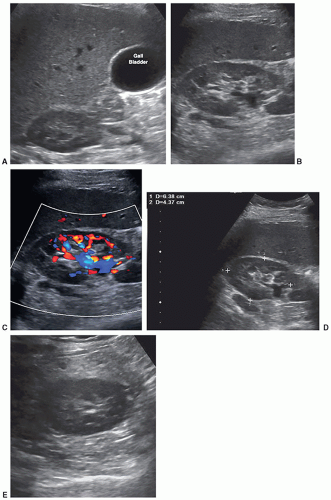 FIGURE 12-34 Transverse images. A. Transverse image of the upper pole of the right kidney. The sinus echoes are just coming in to view. B. Transverse image of the mid pole of the right kidney. There is some dilatation present which could be hydronephrosis or vessels. C. Color Doppler of the mid pole of the right kidney proving that the dilated area is the renal vein. The sonographer should always investigate dilation with color or power Doppler. D. Transverse and AP measurements at the mid pole. Since the kidney is often tilted, the transducer must be angled to be perpendicular to the kidney for accurate measurements. E. Transverse image of the lower pole of the right kidney. |
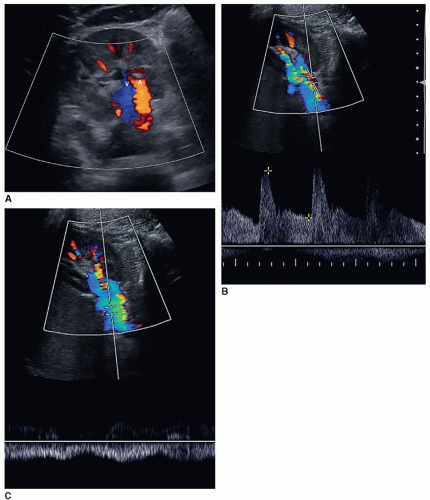 FIGURE 12-35 Color and spectral Doppler of the hilum. A: Color Doppler of the main renal artery (A) and main renal vein (V) at the hilum. B: Spectral Doppler of a normal main renal artery showing forward flow in diastole compatible with a low resistance signal. C: Spectral Doppler of a normal main renal vein showing normal phasic flow. |
Junctional Parenchymal Defect
A junctional parenchymal defect is a fusion defect usually seen in the upper pole of the right kidney, although there are reports in the literature of it being seen in the lower pole and in the left kidney. The defect is due to a partial fusion at the junction of two embryonic parenchymatous masses called ranunculi, which is where the term junctional parenchymal defect originates. On US, it is seen as a triangular or linear echogenic structure, which extends from the capsule to the renal sinus, near the junction of the upper and middle poles. The extension of perirenal fat into the defect causes it to be echogenic. A junctional parenchymal defect has no clinical significance and is discovered incidentally during an abdominal US or CT (Fig. 12-43).
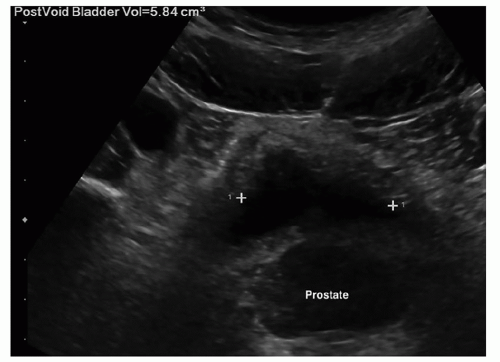 FIGURE 12-36 Most ultrasound units will automatically calculate the bladder volume when all three measurements of the bladder (length, anteroposterior, and width) are completed. Prevoid and postvoid volumes will be differentiated. |
 PATHOLOGY BOX 12-8
Renal Protocol
Before the examination:
Check patient’s medical history
Check appropriate imaging reports
Check appropriate blood and urine lab values
Prepare room
Clean sheet and pillowcase or whatever is used to cover the table and pillow to protect the patient
Transducers
Supplies such as step stool, gel, something to use to protect the patient’s clothing as needed, blanket or sheet to cover patient, and something to clean the gel off the patient.
Before scanning
Introduce yourself
Explain the sonogram including what they should expect during the examination
Breathing requirements
Different patient positions that may be needed
How long the examination will take
If they have any questions
Why they are having the test.
Longitudinal images
Long-axis image measuring the longest length of the kidney and the renal cortical thickness
1-2 longitudinal images from midline to lateral border
1-2 longitudinal images from midline to medial border
An image demonstrating liver/right kidney and spleen/left kidney
Transverse images
Mid pole of the kidney with transducer angled to be perpendicular to the kidney
Transverse and AP measurements optional
1-2 transverse images from upper pole to mid kidney
1-2 transverse images from mid kidney to lower pole
Optional images
Color Doppler of main renal artery and vein at hilum
Spectral Doppler waveform of main renal artery and vein at hilum
Images of bladder
 PATHOLOGY BOX 12-9
Normal Variants
Dromedary hump
Prominent focal bulge on lateral border of the left kidney, which gives the kidney a more triangular shape
Fetal lobulations
When the embryologically lobules do not fuse together after birth causing the outline of the kidney to have a scalloped or bumpy appearance. Can occur in either kidney.
Hypertrophied column of Bertin
Incomplete fusion of fetal lobes that causes a large column with increased thickness and varying depths within the medullary substance. Sonographically, double layers of renal cortex are seen between the renal pyramids with the same echogenicity as that of the cortex.
Junctional parenchymal defect
Fusion defect due to a partial fusion at the junction of two embryonic ranunculi. Sonographically seen as an echogenic line, due to extension of the perirenal fat, near the junction of the upper and middle poles.
Extrarenal pelvis
Anatomic variant where part of the renal pelvis is outside the renal hilum and is best appreciated in a transverse image. There will be no hydronephrosis on a midline image.
Renal sinus lipomatosis
A benign condition of an accumulation of excessive fat within the renal sinus and appears as an enlarged echogenic central sinus that is usually less echogenic than the normal renal sinus.
Extrarenal Pelvis
An extrarenal pelvis is an anatomic variant where part of the renal pelvis is located outside the renal hilum. It appears dilated as opposed to the intrarenal pelvis, which is surrounded by sinus fat that helps to keep it compressed. It is found in approximately 10% of the population. Patients will be asymptomatic, and it is usually an incidental finding on US or CT. An extrarenal pelvis is best appreciated in a mid-pole transverse image as a midline longitudinal image will show no evidence of hydronephrosis. When the transducer is aimed at the medial aspect of the kidney, the fluid will be seen extending outside the renal border (Fig. 12-44A-D). Sonography will demonstrate a cystic area lying partially or entirely outside the renal pelvis on a transverse mid-pole image. Transverse images of the upper and lower poles will be normal. Care should be taken not to mistake an extrarenal pelvis for hydronephrosis by noting lack of dilated calyces
or a hydroureter. As there will be a normal midline image of the kidney that does not show any hydronephrosis, it should be easy not to confuse an extrarenal pelvis for hydronephrosis.
or a hydroureter. As there will be a normal midline image of the kidney that does not show any hydronephrosis, it should be easy not to confuse an extrarenal pelvis for hydronephrosis.
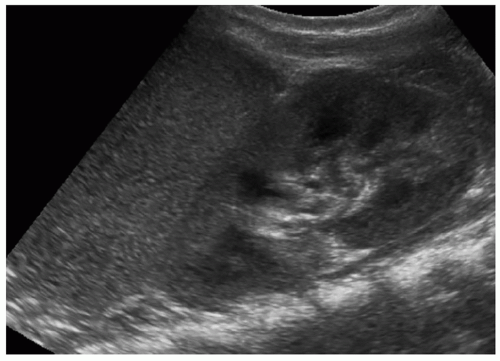 FIGURE 12-37 An image of the spleen showing how it “molds” or imprints itself on the left kidney causing the distortion of the renal shape. |
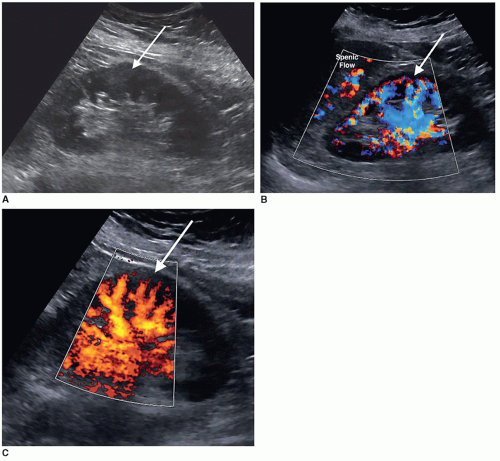 FIGURE 12-38 Dromedary hump. A: Left kidney with a dromedary hump. The arrow is pointing to what appears to be an area of mildly increased echogenicity raising concern for a small renal cell carcinoma. B: Color Doppler showing that this area of concern (arrow) is normal renal tissue. Intrasplenic flow is seen. C: Power Doppler also demonstrating that the area in question (arrow) is normal renal parenchyma. With its increased sensitivity, power Doppler may show normal renal perfusion best when imaging technically difficult patients. |
Renal Sinus Lipomatosis
Renal sinus lipomatosis refers to a condition when there is an accumulation of excessive fat within the renal sinus. It is usually found in patients in their sixth or seventh decade, who are obese, or have had exposure to steroids. Renal sinus lipomatosis has no clinical significance, and patients are asymptomatic with normal urine output and renal function tests. It is usually bilateral and found incidentally. Sonographically, it is seen as an enlarged echogenic central sinus that is usually less echogenic than a normal renal sinus, and what appears to be cortical
thinning, due to the widening of the sinus echoes. These patients may also have a fatty pancreas, which appears as a bright, echogenic pancreas, that has no clinical significance (Fig. 12-45A, B).
thinning, due to the widening of the sinus echoes. These patients may also have a fatty pancreas, which appears as a bright, echogenic pancreas, that has no clinical significance (Fig. 12-45A, B).
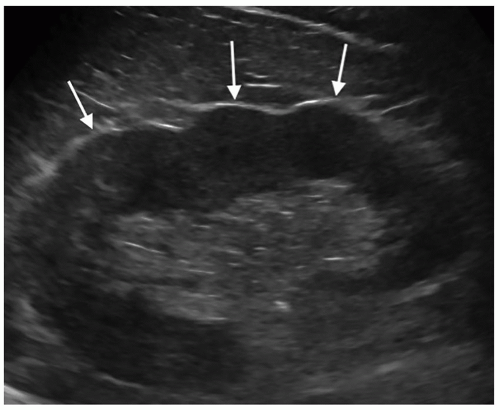 FIGURE 12-39 Image showing the scalloped edges or bumpy look (arrows) on a kidney with fetal lobulations. |
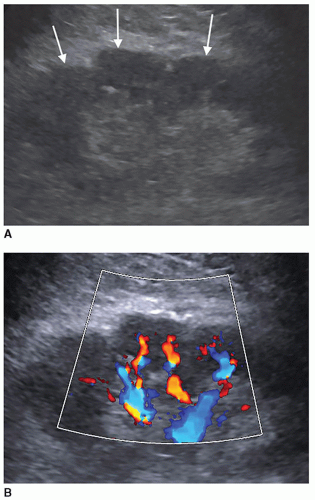 FIGURE 12-40 Fetal lobulations. A: Kidney demonstrating fetal lobulations (arrows). B: A color Doppler image showing flow in the tissue under the lobulation. |
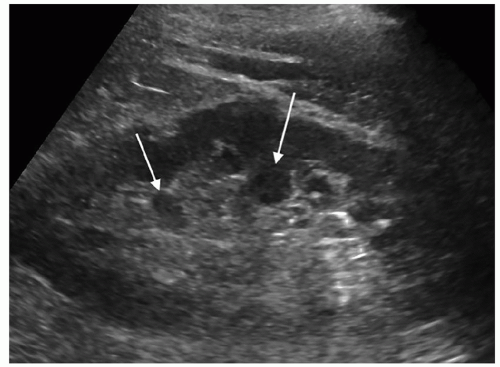 FIGURE 12-41 Columns of Bertin (arrows) in a patient who also has a dromedary hump. |
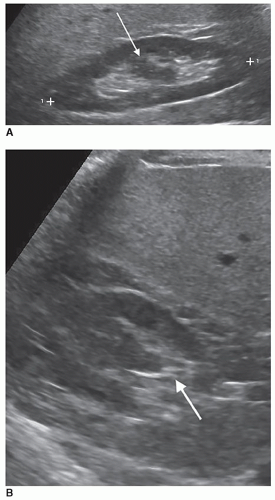 FIGURE 12-42 Columns of Bertin. A: The arrow is pointing to a column of Bertin that appears to split the sinus echoes in half. B: A transverse image in the plane of the arrow in Figure 12-42 showing sinus echoes at the bottom of the column (arrow). |
Related posts:
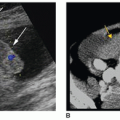
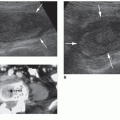
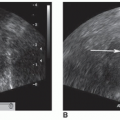
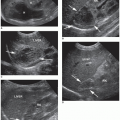
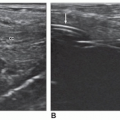
Stay updated, free articles. Join our Telegram channel

Full access? Get Clinical Tree


