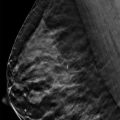
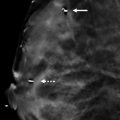
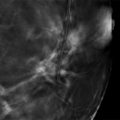
Digital breast tomosynthesis (DBT) is a technology that produces three-dimensional slice images of the breast. The technology is related to conventional film tomography, which was widely used in radiography until the advent of computed tomography (CT). DBT has a lot in common with digital mammography as well. The spatial resolution in the individual reconstructed plane images is similar to that in a digital mammogram. The limited acquisition angle used in DBT is similar to that used for conventional tomography. On the other hand, CT generally has lower spatial resolution and utilizes data collected from all 360 degrees around the patient. The acquisition of data from 360 degrees means that the detector and source need to rotate around the object of interest, in this case, the breast. There are systems under development that place the patient prone on a table with the breast suspended in a hole in the table. The detector and X-ray source are then rotated around the pendulous breast. Such systems show some promise, but none are currently approved for clinical use. Although in many ways DBT of the breast seems very different from CT of the breast, DBT can really be considered to be a limited-angle CT device. Because DBT uses a digital mammography detector, it has very high resolution within the reconstructed plane. But, because of the limited acquisition angles, it has much poorer resolution in the direction perpendicular to the reconstructed plane.
1.2 History
Tomosynthesis was originally proposed in the 1930s by Ziedes des Plantes and was first implemented as conventional tomography. Tomosynthesis, the formation of a series of slices through an object from a series of projection images, was not practical until recently. In the late 1990s, high-quality full-field digital detectors became available. This added technology was required to successfully implement breast tomosynthesis. Flat-panel digital detectors, which are now commonly used in digital mammography, exhibit the necessary properties for a DBT detector; they are highly dose efficient, have low noise, and have high data-acquisition rates.
The first full-field digital mammography (FFDM) system (GE Senographe 2000D, GE Healthcare, Waukesha, Wisconsin) was approved for use in January 2000. Several other full-field digital detector systems were developed and approved for use over the next decade. Tomosynthesis imaging was first demonstrated by Niklason in 1997 but was not commercially available until 2011. In February 2011, the first digital breast tomosynthesis (DBT) system (Hologic Selenia Dimensions) was introduced. Two other systems have been approved since then, GE SenoClaire (August 2014) and Siemens MAMMOMAT Inspiration (April 2015). Early DBT studies were viewed on dedicated workstations due to the large data sets involved and due to the proprietary compression algorithms that were originally employed. The digital imaging and communication (DICOM) standard now supports DBT, allowing viewing and reading of DBT studies on conventional picture archiving and communication systems (PACS) workstations. The workstations need to conform to the mammographic quality standards act (MQSA) with 5-megapixel (MP) monitors and regular physics testing. ▶ Table 1.1 provides key definitions of terms in the field of FFDM and DBT.
|
|
|
|
1.3 Principles of Tomosynthesis: How Does Tomosynthesis Work?
The basic principles of DBT can be understood with a simple example. As seen in ▶ Fig. 1.1, there is a digital detector, an object with two features (a star and a pentagon), and an X-ray tube that can be moved from position A to position B. If we make an exposure with the X-ray tube at position A, we get an image A, as shown on the top right side of ▶ Fig. 1.1. We then move the X-ray tube to position B and make another exposure and obtain the image labeled B. Notice that the positions of the features (the star and the pentagon) are at different locations in the two images. As one can see by the blue lines in ▶ Fig. 1.1, the position of the star moves by a greater amount between exposure A and exposure B than the position of the pentagon. So if we shift the two images relative to each other by an amount x that corresponds to the change in position of the pentagon and add the two images, we get the image labeled A+B. Both the images of the pentagon are superimposed and the signal intensities add together.
However, the images of the star do not superimpose and their intensities do not add together. So the intensity of the two stars will be half that of the pentagon. You can imagine that if we took more images at positions between A and B and properly shifted each image and added them all together, then we could get all the pentagon images to superimpose and the intensity of the pentagon would continue to increase, while the intensity of the star would remain the same. Alternatively, we could adjust the image so that the intensity of the pentagon remained the same, in which case the intensity of the star images would decrease by a factor equal to the number of X-ray exposures. If we took enough exposures close together, the individual images of the star would begin to overlap each other. The result would be a low-intensity, blurry image of the star.
The sharp, full-intensity characteristics of the pentagon would also be true for any other structure that was in the same horizontal plane as the pentagon. So the appropriately shifted and added images from all the exposures would produce a final image that showed all the structures in the plane of the pentagon in sharp focus and any structure that was not in that plane, such as the star, would be of lower intensity and would be blurred. Structures in planes slightly above or below the pentagon would be only slightly blurred, while structures in planes further from the plane of the pentagon would be significantly blurred. Since the detector is a digital detector, we can save all the individual images. If we shift the images by a different amount (for example, y) and then add them together, we can obtain an image where the plane of the star is in sharp focus and the plane of the pentagon is blurred. In general, we can shift and add the individual images with a range of shift amounts and can therefore produce a series of planes through the object.
In conventional tomography, the addition was performed by accumulating the exposures on a single film, and the shifting was accomplished by moving the film during the exposure. In that way, the shifting and adding was accomplished on a single film. Generally the exposure was a single continuous exposure as the tube was moved from A to B. A downside of conventional tomography was that only a single plane could be imaged at a time, and additional exposures were required to obtain images of other planes.
1.3.1 Reconstruction Methods
Shift and Add
The synthesis of the tomographic plane described in the previous section is accomplished by shifting and adding the individual images. Not surprisingly the first algorithm for reconstructing tomographic slices was called the shift and add (SAA) method. It is the original method that was developed and is still commonly used to reconstruct DBT images. The SAA method does not perfectly reconstruct the plane of interest. Information from structures in other planes is also superimposed on the information from the plane of interest. The reduced-intensity, blurry structures from other planes may be more or less of a problem depending on the contrast of the structure and the distance of the structure from the plane of interest. High-contrast structures and structures from planes that are close to the plane of interest produce greater artifacts. In ▶ Fig. 1.2 a conventional mammographic right caudocranial (RCC) view (left) is placed side-by-side with a tomosynthesis slice (right). In the tomosynthesis image on the right, you can observe significant residual artifacts from the high-contrast objects seen in the RCC image on the left.
Alternative reconstruction algorithms are attempts to reduce the effects of structures from other planes.
Filtered Back-Projection
The SAA method is a straightforward algorithm that is relatively easy to understand and to implement. Essentially it represents the method of reconstruction that is used when a conventional tomogram is produced. However, it is true that DBT can also be considered to be limited-angle computed tomography. “Limited-angle” means that data was not acquired from all the angles surrounding the breast. DBT utilizes at most 60 degrees of acquisition whereas complete CT utilizes at least 180 degrees and generally acquires and uses all 360 degrees. Since it is a limited-angle CT, it is not surprising that a common reconstruction method used for CT, filtered back-projection (FBP), is also used for DBT. FBP takes the transmitted information and, after applying a filter to the data, back-projects it through the object ( ▶ Fig. 1.3).
Every voxel (volume pixel) that is along a ray between a pixel in the image and the focal spot of the X-ray tube is given the value of the data in the pixel. This is repeated for all the pixels in the projection image and for all the projection images (for all the angles of acquisition). The blue lines in ▶ Fig. 1.3 correspond to the back projection of the data from the image taken with the X-ray tube at position A and the red lines correspond to the back projection of the data from the image taken with the X-ray tube at position B. The reconstructed volume is not very accurate when only two projection images are acquired. As the number of acquisitions and number of angles of acquisition increase, the accuracy of the reconstruction improves; the features are more accurately displayed and the artifacts are reduced. The filter in “filtered back-projection” is a modification of the projection data that is used to help correct the accuracy of the reconstruction.
The acquisition over a limited angle leads to residual artifacts, and there are various methods used to reduce the effects of those artifacts. All commercially available DBT systems use either FBP or an iterative reconstruction method.
Iterative Reconstruction Algorithms
One class of reconstruction algorithm is based on iterative reconstruction. The basic premise of this class of algorithms is that a first estimate of the reconstructed slices is produced. The algorithm assumes the reconstructed slices represent what is actually in all the planes and simulates what the projection images would look like if an X-ray were directed through those planes. The simulation is done mathematically on a computer, not with real imaging. The resulting simulated image does not look exactly like the actual projection image that was taken. The algorithm then adjusts the reconstructed slices to correct for the differences. Then it again simulates what the projection image would look like for the current reconstructed slices. The details of how the reconstructed slices are adjusted are beyond the scope of this text. The iteration continues until the corrections to the reconstructed slices become smaller than some predetermined threshold. The main advantage of iterative algorithms is that they produce more accurate reconstructions. The main disadvantages are that the iterative process can be time consuming and may introduce image noise.
All commercially available DBT systems use either FBP or an iterative reconstruction method.
1.3.2 Acquisition Parameters
The details of how the projection images are obtained can vary significantly from one system to another and can have a significant impact on image quality, speed of the exam, and patient comfort. Some of the considerations are how many projection images to take and over how great of an angle. The greater the angle over which the images are obtained the more sharply you can define the plane of interest. But larger angles generally require a longer acquisition time. The range of angles employed in commercial systems range from 15 to 50 degrees.
A greater number of images also improves the ability to reconstruct the plane of interest. But if the total X-ray dose is to be held constant, the greater the number of images then the less dose per individual projection image. While digital detectors are very dose efficient, it is possible to reduce the signal strength (dose per image) to a point where the detector characteristics degrade the quality of the image.
Another consideration is whether to acquire images with the tube in motion or whether to stop it for each exposure. If the tube is in motion, the resolution in the direction of motion is decreased due to an effective increase in the focal spot size in that direction. This effect can be minimized by taking short exposures, but tube loading limits how short the exposure can be while still producing adequate X-ray intensity. Stopping the tube before each exposure eliminates that issue, but it results in a longer acquisition time. It takes time to start and stop the tube and while waiting for the tube to stop vibrating from the sudden stop. With longer acquisition times comes the increased possibility of patient motion and increased patient discomfort. Commercially available systems take between 9 and 25 projection images with overall acquisition times between 3.7 and 20 seconds per acquisition.
Another consideration is how many planes to reconstruct. This is primarily limited by the data acquisition because the number of reconstructed planes is dictated by the resolution in the direction perpendicular to the image planes. Typically between-plane resolution is ~ 1 mm and consequently most systems reconstruct planes with 1-mm spacing. For a 5-cm compressed breast that would yield 50 images. Most imaging software allows you to recombine individual slices into thicker slabs.
1.3.3 Anti-Scatter Grid
The use of a grid in DBT can be problematic. First, it can be difficult to use a grid because the tube is moving and, to avoid grid cutoff, the grid would need to move in synchrony with the tube. Secondly, the advantage of the grid is that it reduces scatter radiation, but it also reduces the primary signal. For DBT projection images, the dose per image is quite low, at least a factor of ten less than that for a conventional 2D digital mammographic image. This is so that the total dose of all the projection images is comparable to the dose of a single 2D digital image. The problem is that detector dose efficiency, commonly measured as detective quantum efficiency (DQE), and electronic noise can be a problem for very low exposures. So the detector itself may cause a degradation of the image quality if care is not taken. Most manufacturers have opted not to use a grid for DBT. However, one vendor does use a grid (GE SenoClaire).
1.3.4 Radiation Dose Considerations
It was generally accepted that the DBT data acquisition should require a patient radiation dose no more than that of a conventional 2D digital mammogram under the assumption that a single DBT acquisition would be adequate to provide comparable diagnostic information to that of a conventional two-view mammography study. Studies have not borne that out. The data suggests that two DBT acquisitions per breast perform better than one. The data also suggests that conventional 2-view 2D mammography acquisitions combined with DBT provide more accuracy than either alone. However, this results in roughly double the patient radiation dose. The manufacturers have developed synthesized 2D images (Hologic C-view) that are created from the DBT data. The hope is that the synthesized 2D images (synthetic mammograms) combined with the DBT reconstructed slices will provide the diagnostic information needed without requiring the conventional 2D mammography and the additional radiation dose.
Other alternatives for keeping the patient radiation dose as low as possible while obtaining the most accurate diagnostic information include producing DBT projection images that do not all have the same exposure. One proposal is to deliver half of the total dose to a central projection image with the remaining half distributed to all the remaining projection images, approximately the dose that they received before. The dose for this arrangement would be higher than DBT (or 2D mammography) alone but would only require one acquisition per view (two per breast). Other distributions of dose might also produce a more optimal image quality for a given dose since not all the projection angles provide the same amount of image information. An increased dose generally provides improved image quality. While we have optimized the image quality of conventional digital mammography using the accepted patient dose, it is not clear that the same dose would necessarily be the optimal dose for a technology such as DBT that provides at least different (if not better) diagnostic information. The essential question is, “What extra dose would be justified if we can produce a study with improved diagnostic accuracy?”
1.3.5 Data Size
DBT projection images have pixel sizes of between 85 and 100 µm (microns). For a 24 × 30 cm detector with 2 bytes per pixel that corresponds to between 14.4 and 20 megabytes (MB) per image. Manufacturers may recombine pixels for tomosynthesis projection images and/or for the reconstructed slices in order to reduce noise (by averaging pixels) and also to reduce data requirements. A set of projection images is between 9 and 25 images yielding a total size of up 500 MB per set. Generally lossless compression can reduce that to ~ 150 MB. The reconstructed slices are of a similar size. Therefore a four-view (two per breast) DBT study can be ~ 600 MB. These numbers can be important when designing the amount of memory per workstation, the storage capacity of the archive, and network capacity.
1.4 Conclusion
This brief overview provides the fundamental physics underlying the DBT technology. Understanding the basics will assist you when making the many decisions involved in implementing a DBT program within a breast imaging program. Beyond choosing a DBT vendor and the supporting infrastructure, some additional decisions regarding clinical imaging need to be considered. These decisions may include whether DBT will be offered for screening or for diagnosis, or for both. Will exams involve combination imaging, with FFDM and DBT or with synthetic 2D mammogram and DBT? Additionally, will DBT imaging be collected in two views or one view? The answers to these questions will ultimately impact your infrastructure and data storage.
References
[1] Chawla AS, Lo JY, Baker JA, Samei E. Optimized image acquisition for breast tomosynthesis in projection and reconstruction space. Med Phys. 2009; 36(11): 4859‐4869 PubMed
[2] Dobbins JTIII, Godfrey DJ. Digital x-ray tomosynthesis: current state of the art and clinical potential. Phys Med Biol. 2003; 48(19): R65‐R106 PubMed
[3] Dobbins JTIII. Tomosynthesis imaging: at a translational crossroads. Med Phys. 2009; 36(6): 1956‐1967 PubMed
[4] Niklason LT, Christian BT, Niklason LE, et al. Digital tomosynthesis in breast imaging. Radiology. 1997; 205(2): 399‐406 PubMed
[5] Reiser I, Sechopoulos I.. A Review of Digital Breast Tomosynthesis. Medical Physics International Journal. 2014; 2(1): 57‐66 PubMed
[6] Sechopoulos I. A review of breast tomosynthesis. Part I. The image acquisition process. Med Phys. 2013; 40(1): 014301PubMed
[7] Sechopoulos I, Ghetti C. Optimization of the acquisition geometry in digital tomosynthesis of the breast. Med Phys. 2009; 36(4): 1199‐1207 PubMed
[8] Sechopoulos I. A review of breast tomosynthesis. Part II. Image reconstruction, processing and analysis, and advanced applications. Med Phys. 2013; 40(1): 014302PubMed
[9] Suryanarayanan S, Karellas A, Vedantham S. Physical characteristics of a full-field digital mammography system. NIM B. 2004; 533(11): 560‐570 PubMed
[10] Van de Sompel D, Brady SM, Boone J. Task-based performance analysis of FBP, SART and ML for digital breast tomosynthesis using signal CNR and Channelised Hotelling Observers. Med Image Anal. 2011; 15(1): 53‐70 PubMed
[11] Ziedes des Plantes BG. Eine neue methode zur differenzierung in der roentgenographie (planigraphie). Acta Radiol. 1932; 13: 182‐192 PubMed

Fig. 1.1 Schematic representation of how tomosynthesis works.
Stay updated, free articles. Join our Telegram channel

Full access? Get Clinical Tree


