Introduction: The Ventilation–Perfusion Lung Scan
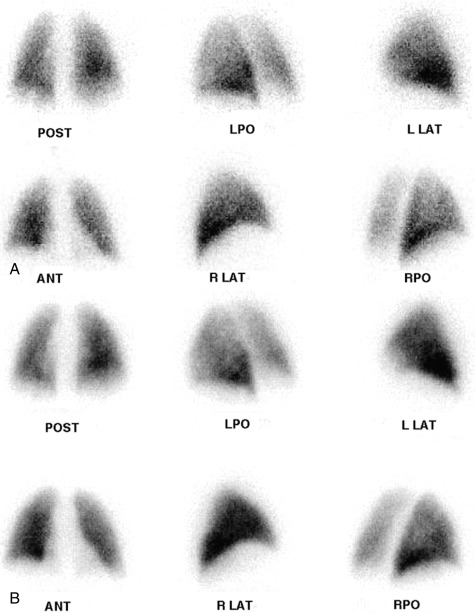
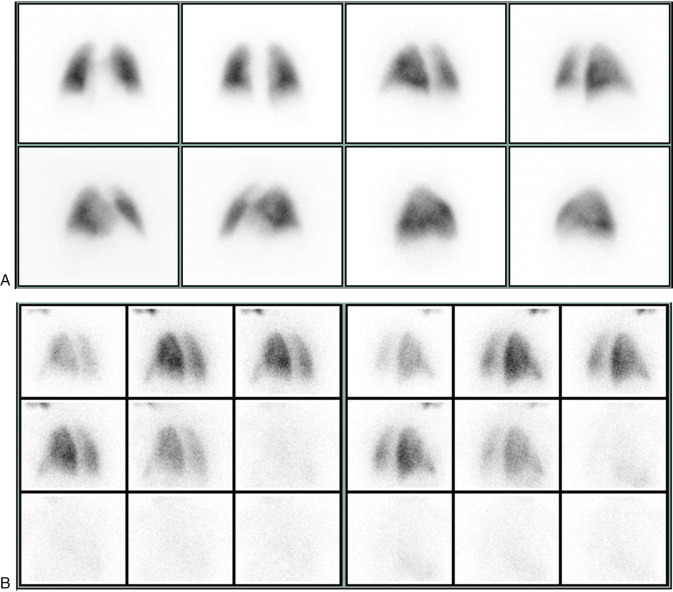
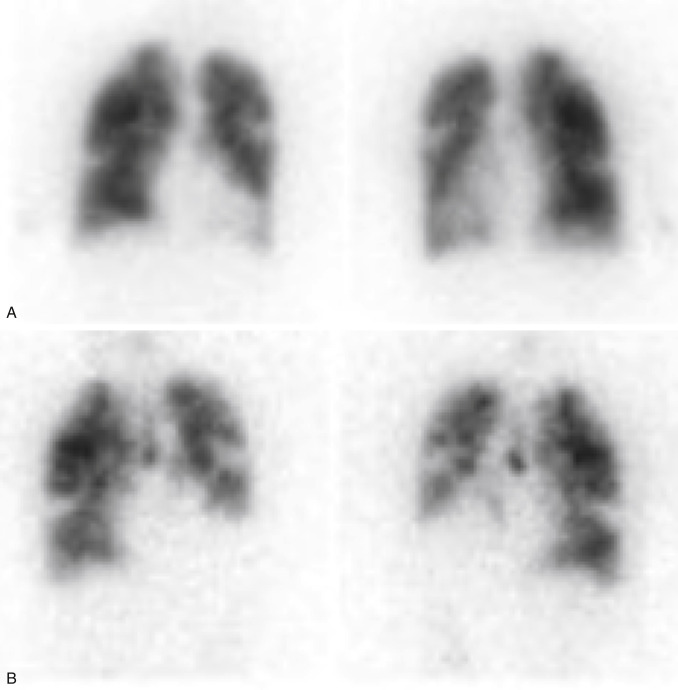
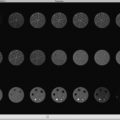
Particles slightly larger than red blood cells can be radiolabeled and injected into a peripheral vein. After passing through the heart and central pulmonary arteries, they finally lodge in the peripheral lung capillaries, creating a map of pulmonary blood flow that can be imaged with a gamma camera. Similarly, inhalation of a radiolabeled gas or aerosol can allow ventilation imaging. These ventilation (V) and perfusion (Q) examinations are the two components that make up the VQ lung scan ( Figs. 7.1 and 7.2 ). Although the VQ scan is most commonly performed to diagnose suspected pulmonary embolism, it can also be used for other purposes, including quantitation of pulmonary function, often pre– or post–lung resection or transplant surgery, and assessment of corrective surgery on pulmonary vasculature.
Pulmonary Embolism
Diagnosis
The clinical diagnosis of pulmonary embolus (PE) can be difficult because of the wide range of presenting signs and symptoms as well as the limitations of available diagnostic tests. Although correct identification and prompt treatment can significantly improve mortality rates (from approximately 30% to 10%) and help prevent recurrence, treatment regimens also expose patients to potential harm.
It is important to understand the tests used to diagnose PE. The accuracy of any test depends not only on its sensitivity and specificity but also on pretest probabilities according to principles of Bayes’ theorem (i.e., a positive test result is more likely a true positive if pretest suspicion is high, but the likelihood dramatically drops if suspicion is low). Therefore referring physicians should perform patient risk stratification to assess the overall likelihood of PE before ordering an extensive workup using validated criteria, such as the Modified Wells Scoring System ( Table 7.1 ), which objectively assign points based on patient history, symptoms, and physical findings.
| Criteria | Modified Wells (Points) |
|---|---|
| Clinical signs of DVT | 3.0 |
| Recent surgery or immobilization | 1.5 |
| Heart rate >100 beats/min | 1.5 |
| Previous vascular thromboemboli | 1.5 |
| Hemoptysis | 1.0 |
| Malignancy | 1.0 |
| PE most likely diagnosis | 3.0 |
| Pregnancy | 0 (not included in Wells score) |
| Clinical Risk Assessment | ||
|---|---|---|
| Risk | Total Score (Points) | PE in Wells Patients |
| High | >6 | 41% |
| Moderate | 2–6 | 16% |
| Low | <2 | 3.4% |
a Modified from Wells PS, Anderson DR, Roger M, et al. Excluding pulmonary embolism at the bedside without diagnostic imaging: management of patients with suspected pulmonary embolism presenting to the emergency department by using a simple clinical model and D-dimer. Ann Intern Med . 2001;135:98–107.
Patients are at greatest risk of a pulmonary embolus from immobilization, recent surgery, and hypercoagulable states. The chance of PE is also significantly increased with a history of prior PE and in the presence of deep vein thrombosis (DVT). Among patients with symptomatic DVT, 30% to 50% result in a PE, and 70% to 90% of patients with PE have had a DVT. Pregnancy and hormone use are more moderate risk factors.
Chest radiographs are frequently ordered and often identify other causes for the patient’s symptoms. However, findings from a PE are highly variable ( Box 7.1 ). Serum D-dimer is sensitive but nonspecific. Doppler ultrasound is an excellent way to noninvasively diagnose venous thrombosis in the lower extremities, making it a frequent component in the workup of possible PE. Further testing beyond these examinations depends on the level of clinical suspicion.
Most common:
Atelectasis
Opacity/infiltrate (localized or regional)
Pleural effusion (usually small to moderate)
Also seen:
Pulmonary artery proximal distention (Fleischner’ sign)
Oligemia (Westermark’ sign)
Pleural-based density (Hampton’ hump)
Normal/negative
The historical imaging gold standard, pulmonary angiography, is very rarely performed today. It is not only invasive but also requires significant facility resources and may not visualize chronic emboli. In recent years, multislice computed tomography pulmonary angiography (CTPA) has become the dominant imaging tool for definitive PE diagnosis. As its use has dramatically escalated, there has been a corresponding significant increase in PE diagnosis. Despite this trend, mortality from PE has not substantially decreased, suggesting that many emboli now found are actually of little or no clinical significance. The potential risks of ionizing radiation exposure from this often-overutilized procedure have also been in the spotlight recently, and the scans themselves may be limited by insufficient contrast bolus density and patient motion. Some patients may not be able to undergo CTPA due to contraindications such as iodinated contrast allergy or poor renal function.
Magnetic resonance angiography (MRA) images the vasculature without ionizing radiation or iodinated contrast. Obtaining diagnostic-quality images in a reasonable amount of time is a significant challenge associated with this modality, although many improvements have occurred in recent years. Some experienced centers now report excellent results, with only a small percentage of inadequate examinations. Demand will likely continue growing, in part because of American College of Radiology (ACR) Contrast Manual guideline changes in 2017 supporting the use of group II gadolinium-based contrast agents (e.g., gadoteridol [ProHance]) in cases of decreased renal function. However, at present, MRA is not routinely used in most practices.
Although technical advances have led to a marked increase in CTPA and MRA utilization, the nuclear medicine VQ lung scan remains an important tool. It is particularly useful in patients who cannot tolerate intravenous contrast, have renal dysfunction, or in whom an adequate CTPA or MRA examination could not be obtained. It frequently provides a definitive answer while minimizing radiation to the patient.
VQ interpretation may seem challenging at first and requires a solid understanding of lung anatomy and physiology as well as of standardized interpretation criteria. Imaging equipment and ventilation agents have improved over the years, and techniques such as single-photon emission computed tomography (SPECT) and single-photon emission computed tomography with computed tomography (SPECT/CT) are reported to improve VQ accuracy. Although the general impression is that CTPA offers greater accuracy over VQ, investigations directly comparing CTPA and VQ have found little or no difference in accuracy or patient outcomes between the two.
VQ Background
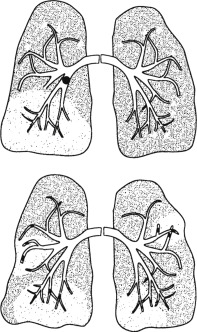
During the perfusion portion of the VQ scan, intravenously administered radiolabeled albumen particles are either normally trapped in distal capillaries or are prevented from reaching the lung periphery if they meet an obstruction, such as a clot. The emboli result in regions of decreased perfusion in the territory fed by the obstructed vessels: lobe, segment, or subsegments depending on whether the clot lodges centrally or distally ( Fig. 7.3 ).
PE diagnosis is complicated by the fact that the body normally shunts blood away from areas of the lung that are not properly ventilated. This means that causes other than PE can also lead to regions of decreased perfusion. Most commonly these are lung diseases, such as emphysema, interstitial lung disease, and asthma. Box 7.2 lists some causes of abnormal ventilation. Comparing ventilation to the perfusion pattern can help determine whether the diagnosis is PE. With emboli, tissues usually remain ventilated, at least for some time. So, the VQ will demonstrate normal ventilation in the areas of perfusion deficit from the embolus, resulting in a “mismatched” defect ( Fig. 7.4 ). Airway diseases, on the other hand, show ventilation abnormalities that coincide with the perfusion defects. These “matched” defects are unlikely to be caused by an acute PE. Box 7.3 contains definitions of some important terms applied to VQ scintigraphy.
Primary Vascular Lesions
Pulmonary thromboembolism
Septic, fat, and air emboli
Vasculitis
Congenital vascular anomalies
Primary Ventilation Abnormality
Pneumonia
Atelectasis
Pulmonary edema
Acute asthma
Chronic obstructive pulmonary disease: emphysema, bullae, chronic bronchitis
Mucous plug
Mass Effect
Tumor
Adenopathy
Pleural effusion
Iatrogenic
Surgery: Pneumonectomy, lobectomy
Radiation fibrosis, postinflammatory fibrosis
Gestalt: Process of holistic interpretation performed by experienced VQ readers that includes more than the use of strict criteria to achieve a more accurate result.
Matched defect: Abnormality of both scans in same area and of same size.
Mismatched defect: Perfusion abnormality in region of normal ventilation.
Reverse mismatched defect: Ventilation abnormality in area with normal perfusion.
Triple-match defect: A matched VQ lesion within the bronchopulmonary segments occurring in the area of a similar sized radiographic abnormality.
Segmental defect: Corresponds to the segmental lung anatomy; often wedge-shaped and extending to pleura.
Large: >75% of the segment involved
Moderate: 25% to 75% of segment
Small: <25% of the segment
Subsegmental defect: Perfusion defect involving less than a segment of lung parenchyma.
Nonsegmental defect: Lesion does not correspond to segmental anatomy, caused by objects outside of the lung tissue, generally not wedge-shaped.
Radiopharmaceuticals
Perfusion: Tc-99m MAA
Technetium-99m macroaggregated albumin (Tc-99m MAA) is the only lung-perfusion agent clinically available in the United States. Radiolabeled particles must be larger than the red blood cells so that they will be trapped in the lungs on the first pass but should not be so large that they lodge centrally. Although MAA particles range in size from 5 to 100 μm, 60% to 80% of the particles are between 20 and 80 μm. Once in the lung, particles gradually degrade and are phagocytized with a biological half-life (T ½ ) of 2 to 3 hours.
Considerations for Tc-99m MAA particle administration are listed in Box 7.4 . In adults, 200,000 to 600,000 particles are typically used (100,000 minimum to maintain image quality). This obstructs only a small fraction of vessels and should result in no ill effects. However, in some situations, particle-number reduction is recommended to ensure safety. In children, modifications are usually done as a reflection of age or weight. In pregnancy, the particles are limited to the minimum. Particle numbers are also decreased in pulmonary hypertension and in right-to-left cardiac shunts. Although it may seem alarming that particles will occlude capillaries in the brain and other organs in such shunts, Tc-99m MAA has long been used to actually calculate cardiac shunts without significant problem.
≈500,000 particles in a 185-MBq (5-mCi) dose
For Adults
Minimum: 60,000 to 100,000 particles
Standard: 200,000 to 700,000 particles
≈300 million arterioles and 280 billion pulmonary capillaries
Obstructs <0.1% to 0.3% of vessels
Consider Particle Number Reduction
Pulmonary hypertension: 100,000 to 250,000 particles
Have far fewer functional capillaries
Right-to-left cardiac shunt: 100,000 to 150,000 particles
Pregnancy: 100,000 particles (decreasing radiation dose)
Use fresh Tc-99m MAA particles.
For Children
Modifications done as a reflection of age
Neonate: 10,000 particles
<5 years: 50,000 to 150,000 particles
Ventilation Agents
A comparison of ventilation radiopharmaceuticals is listed in Table 7.2 . Of these, two aerosols are the most commonly used currently: Tc-99m diethylenetriaminepentaacetic acid (Tc-99m DTPA) in the United States and Tc-99m Technegas (Cyclomedica) in Europe and Australia. Tc-99m Technegas images are generally superior; however, approval by the U.S. Food and Drug Administration (FDA) has been delayed for years in the United States. Although krypton-81 (Kr-81) gas may be used in some sites outside the United States, Xe-133 is the only gas ventilation available currently for routine clinical use in the United States.
| Gas Ventilation Agents | Aerosolized Ventilation Agents | ||||
|---|---|---|---|---|---|
| Comparison Factor | Xenon-133 | Krypton-81m | Tc-99m DTPA Aerosol | Tc-99m Technegas | Tc-99m Sulfur Colloid |
| Decay mode | Beta-minus | Isomeric | Isomeric | Isomeric | Isomeric |
| Physical T ½ | 53 days | 13 sec | 6 hr | 6 hr | 6 hr |
| Biologic T ½ | 30 sec | (Continuous intake) | 80 min a | 135 hr | |
| Photon energy | 81 keV | 190 keV | 140 keV | 140 keV | 140 keV |
| Multiple-view imaging | No | Yes | Yes | Yes | Yes |
| Optimal for SPECT | No | No | +/– | Yes | Yes |
| Useful for COPD | Yes | Yes | +/– | Yes | +/– |
| Used after perfusion scan | No | Yes | No | No | No |
Xe-133
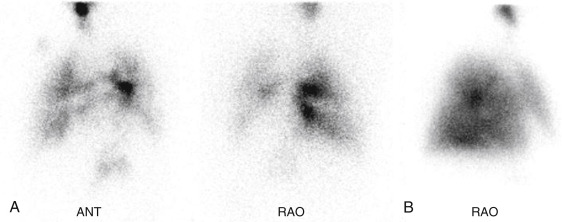
Gas ventilation agents disperse more easily in the lungs than Tc-99m DTPA aerosol, allowing for superior images in cases where airflow is abnormal. Xe-133 gas is fat soluble, moving from the lung into blood and tissues. As it recirculates, gas exchange allows rapid clearance from the body with a 30- to 45-second biologic T ½ . The ability to image washout significantly increases the sensitivity for air trapping in obstructive lung disease, improving overall examination specificity ( Fig. 7.5 ) . However, the low photopeak of 81 keV leads to lower-quality images from greater soft tissue attenuation and scatter. It is also sometimes difficult to tell if perfusion defects are matched because the views obtained before washout are limited. Because most PEs occur in the lower lobes, ventilation was usually done only posteriorly in the past, whereas perfusion could be visualized in multiple projections. The wide availability of two-headed cameras today has resulted in more flexibility, and some systems allow simultaneous imaging in the left posterior oblique (LPO) and right posterior oblique (RPO) projections, thereby visualizing three pleural surfaces of each lung . Rooms used for Xe-133 are equipped with a special xenon trap (a system of shielded charcoal filters and tubing that retains the gas until safely decayed), and scanning is performed in a negative-pressure room with a ventilation system that rapidly clears the radioactive gas to the outside.
Tc-99m DTPA
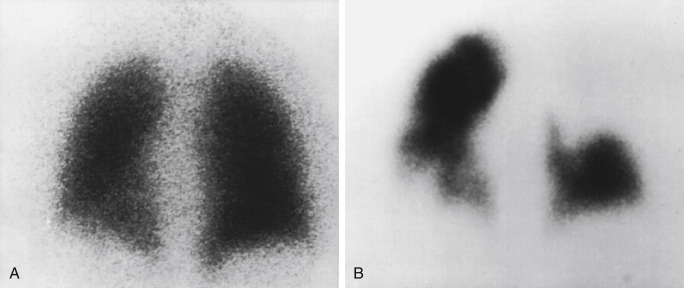
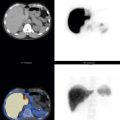
Aerosolized Tc-99m DTPA has recently received FDA approval for clinical use after having been used by physicians “off-label” for decades. The liquid radiopharmaceutical is placed into a nebulizer, producing small particles ranging in size from 0.5 to 2 μm, which are normally able to travel to the lung periphery. However, in asthma and chronic obstructive pulmonary disease (COPD) or when patients cannot cooperate fully with technique, airway turbulence produces large airway deposition and central clumping. Not only does this limit peripheral visualization, but activity shine-through onto the subsequent perfusion scan can obscure perfusion defects ( Fig. 7.6 ).
With time, Tc-99m DTPA is broken down in the lungs and absorbed, ultimately cleared by the kidneys. The biologic T ½ varies but has been estimated at 80 minutes (±20 minutes) in healthy nonsmokers. Clearances dramatically increase when alveolar membranes are damaged. In healthy smokers, the biologic T ½ is only 24 minutes (±9 minutes). Damage to the lungs from toxins or inflammatory processes like adult respiratory distress syndrome can be diagnosed by measuring abnormally rapid Tc-99m DTPA clearance rates.
Tc-99m Technegas
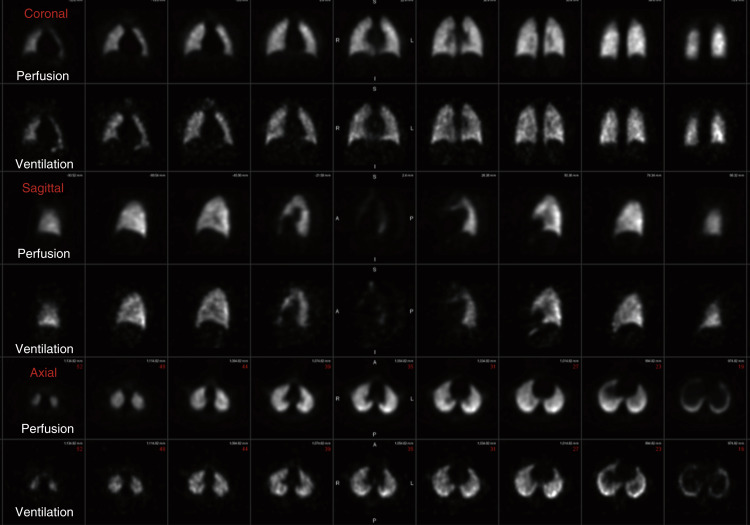
Tc-99m Technegas is an aerosolized suspension of solid carbon particles that are smaller than those of Tc-99m DTPA, small enough to behave as a gas in the lungs. Tc-99m pertechnetate is placed into the crucible of a dedicated machine and incinerated in the presence of 100% argon gas and carbon, resulting in a thin layer of metallic technetium encapsulating carbon particles typically 30 to 60 nm in size (reported range of 5–200 nm, with 80% being less than 100 nm). These particles easily travel to the lung periphery after only a couple inspirations. Images are generally superior to Tc-99m DTPA, with central bronchial clumping infrequently seen. Unlike the clearance seen with Tc-99m DTPA, these particles lodge in a stable distribution, allowing not only for multiview planar images (in the same projections as the perfusion) but for superior SPECT images as well ( Fig. 7.7 ).
Radiation Exposure: VQ Versus CTPA
Newer low-dose CTPA techniques have generally reduced the radiation dose, narrowing the gap with VQ. Although the CTPA effective whole-body dose is sometimes as low as 2 to 3 mSv, significantly higher doses are often still used (3–9.0 mSv), and VQ doses, usually less than 1.5 mSv (1.1–2.0 mSv), still compare favorably. Given the radiation sensitivity of the breast, it may be most important to note that VQ results in a much lower breast dose of 0.8 mGy (0.2–1.2 mGy) as opposed to perhaps 5 mGy from CTPA (roughly 3–34 mGy in literature, depending on technique). In pregnancy, radiation doses to the fetus, although low, are reportedly higher from VQ compared with CTPA. However, fetal exposure may be comparable or even lower when using suggested VQ protocol modifications, such as low-dose perfusion only or 2-day protocols, where a perfusion scan is done on day 1 and the ventilation study is performed on day 2 only for those cases requiring it due to perfusion abnormalities. Radiopharmaceutical dosimetry is outlined in Appendix 1 .
Technique
The ventilation scan is generally acquired first because the perfusion scan would interfere with visualization. The lower-energy photopeak of Xe-133 would be obscured by down-scatter from the higher energy of Tc-99m. Activity in the lungs is also higher on perfusion images, so activity from Tc-99m ventilation agents would be hidden by more abundant Tc-99m MAA counts.
Some sites do perform the perfusion examination first, possibly avoiding a ventilation examination if perfusion is normal in young or pregnant patients and those with clear chest radiographs. This requires a low 1-mCi (37-MBq) Tc-99m MAA dose or delaying the ventilation until the next day, possibly prophylactically treating the patient with heparin overnight. Both situations could result in interpretation difficulties if counts are too low or defects change as atelectasis evolves in the lung.
Ventilation
Protocols for Tc-99m DTPA, Xe-133, and Tc-99m Technegas are outlined in Boxes 7.5, 7.6, and 7.7 , respectively. For all ventilation radiopharmaceuticals, patients breathe through a closed system, with a mask connected to the delivery device and the nose clamped. Only a fraction of the dose placed in the unit reaches the lungs. In the case of Tc-99m DTPA, only 0.5 to 1.0 mCi (18.5–37 MBq) is delivered to the lungs. Of the available agents, Tc-99m Technegas has the most rapid uptake, requiring only a few breaths.
Patient Preparation
Chest radiograph within 24 hours
Dose Administration
- 1110
MBq (30 mCi) Tc-99m DTPA in nebulizer; patient receives 20 to 40 MBq (0.5–1.0 mCi).
Instrumentation
Collimator: Low energy, parallel hole
Photopeak: 20% window centered at 140 keV
Positioning
Place nose clamps and connect mouthpiece with patient semisupine.
Image Acquisition
Center camera over chest; patient breathes continuously for several minutes.
Acquire posterior image for 250,000 counts; obtain other views for this same time: anterior and posterior, anterior and posterior obliques, right and left lateral.
Patient Preparation
Chest radiograph within 24 hours
Dose Administration
Adult: 740 MBq (20 mCi) Xe-133 in chamber
Pediatric: 10 to 12 MBq/kg (1–10 mCi/kg) with 100 to 120 MBq (3 mCi) minimum
Instrumentation
Collimator: Low energy, parallel hole
Photopeak: 20% window centered at 81 keV
Positioning
Place nose clamps and connect mouthpiece with patient on camera.
Image Acquisition
First breath: Patient exhales fully then maximally inhales and holds it (if possible) for 100,000 counts or 10 to 20 seconds.
Equilibrium: Obtain three sequential 90-second images as patient breathes normally.
Posterior obliques may be possible at this time.
Washout: Turn system to exhaust; obtain sequential 45-second posterior images until activity clears or for 5 minutes.
Patient Preparation
Chest radiograph within 24 hours
Dose Administration
- 500
MBq (30 mCi) Tc-99m Technegas, range 400 to 900 MBq (10–25 mCi)
Dose Preparation
Power on dose generator, turn on argon supply, and then turn on regulator.
Wet crucible with ethanol, draw back excess, and insert wet crucible into machine.
Load Tc-99m pertechnetate dose into crucible with 1-cc syringe
(may repeat, after a simmer run to evaporate fluid in order to achieve desired dose).
Press start to ignite burn (raises temperature above 2700°C for 15 seconds).
Disconnect argon.
Administer within 10 minutes.
Instrumentation
Collimator: Low energy, parallel hole
Photopeak: 20% window centered at 140 keV
Matrix: Planar 256 × 256; SPECT 64 × 64 (can use 128 × 128)
Positioning
Place nose clamps and connect mouthpiece with patient supine/semisupine, in well-ventilated room, preferably apart from camera room to avoid contamination.
Patient breathes in for three to six respiratory cycles.
Five-second breath hold at end of each increases retention until 2 kcounts/min.
Center camera over chest.
Image Acquisition
Planar: Acquire posterior image for 250,000 to 500,000 counts; obtain other views for this time: anterior and posterior, anterior and posterior obliques, right and left lateral.
SPECT: 3 degrees/step, 64 steps/head, 10 seconds/view, 360 degrees total
Reconstruction: Ordered-subset expectation maximization; 8 iterations, 4 subsets
Postreconstruction filter: Three-dimensional (3-D) Butterworth; cutoff 0.8 cycles/cm, order 9
Related posts:
Stay updated, free articles. Join our Telegram channel

Full access? Get Clinical Tree


