Chapter 25 The radiographic image
Chapter contents
25.1 Aim
The aim of this chapter is to consider the major factors involved in the production of a radiographic image. The chapter will first consider the attenuation patterns in a patient that will produce an X-ray image and will then consider how this reacts with a recording medium to produce a radiograph. The chapter also summarizes how the selection of exposure factors affects the quality of the radiographic image produced.
25.2 Introduction
The quality of the radiographic image is affected by a number of geometrical factors that determine the magnification of the image and the amount of geometrical unsharpness produced. The radiographic image depends on more than geometrical considerations. This chapter considers the other factors which contribute to the image quality. To understand this, it is necessary to understand the contribution of photoelectric absorption and Compton scattering to the final radiographic image (see Ch. 23).
1. The production of an X-ray image pattern as the beam of radiation is attenuated by the patient.
2. The production of a radiographic image as this radiation pattern interacts with a recording medium.
Therefore, this chapter will consist of two halves, each looking at one of these stages.
25.3 The X-ray image pattern
25.3.1 Attenuation of the X-ray beam by the body
We will assume, for simplicity, that the radiation beam from the X-ray tube striking the body is of uniform intensity across the beam. When this beam interacts with the body substance, different structures will cause different amounts of attenuation and a ‘pattern’ of radiation intensities is transmitted to the imaging device. If all structures in the beam attenuated the radiation by the same amount, there would be no pattern and no image of any structures would be seen on the radiograph. A simple example of such differential absorption is shown in Figure 25.1, where two separate rectangular blocks of bone and soft tissue are shown interacting with the X-ray beam. The profiles of the incident (I0) and the transmitted (IT) radiation intensifies are also shown. If again we assume, for simplicity, that the attenuation of the radiation beam is exponential, then:
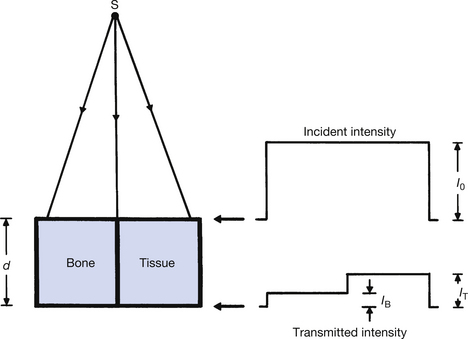

where I0 is the intensity of the X-ray beam before it enters the patient, μ(B) is the total linear attenuation coefficient for bone and μ(T) is the total linear attenuation coefficient for soft tissue. IB is the intensity of the radiation transmitted through a thickness d of bone and IT is the intensity transmitted through a similar thickness of soft tissue. As can be seen from Figure 25.1, IB is less than IT. This is because μ(B) is greater than μ(T). There are two physical reasons for this:
1. The density of bone is approximately twice that of soft tissue (ρB=1.8; ρT=1.0).
2. The average atomic number of bone is approximately twice that of soft tissue (ZB=14; ZT=7.5).
where τ is the linear attenuation coefficient for the photoelectric effect, σ is the linear attenuation coefficient for Compton scattering, ρ is the density of the attenuator, Z is its atomic number and E is the photon energy. The higher atomic number of bone means that it will greatly attenuate suitable radiation by the photoelectric effect.
The findings are summarized in Table 25.1. The process of photostimulation is (See page 185). The essential points to be taken from the table are that in the diagnostic range of photon energies, the higher atomic number of bone results in photoelectric absorption being the main attenuation process, whereas the lower atomic number of soft tissue means that Compton scattering is the main attenuation process. (In the therapy range of photon energies, the dominant attenuation processes are Compton scattering and pair production, both of which are less dependent on the atomic number of the attenuator.)
Table 25.1 Comparison of linear attenuation in bone and soft tissue
| ATTENUATOR | PHOTOELECTRIC τ ∝ ρ×Z3/E3 | COMPTON SCATTERING σ ∝ ρ (ELECTRON DENSITY)/E | TOTAL ATTENUATION μ=τ+σ |
|---|---|---|---|
| Bone Z=14 ρ=1.8 | Photoelectric absorption is high when photon energy is low: 12–16 times greater than soft tissue | Predominates at high photon energies 500 keV to 5 MeV | Mainly photoelectric absorption at diagnostic energies |
| Soft tissue Z=7.5 ρ=1.0 | Significant at low photon energies <25 keV | predominates at photon energies > 30 keV | Compton scattering is the dominant process if the average photon energy is greater than about 30 keV |
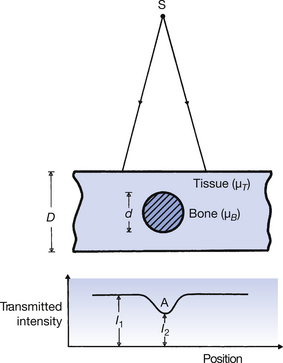
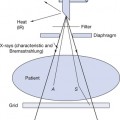
A more realistic example of attenuation is given in Figure 25.2. This simulates the presence of a piece of bone surrounded by soft tissue. A profile of the transmitted radiation intensity is also shown and it can be seen that its minimum corresponds to the maximum thickness of the bone (point A in the figure).
Related posts:

Stay updated, free articles. Join our Telegram channel

Full access? Get Clinical Tree


