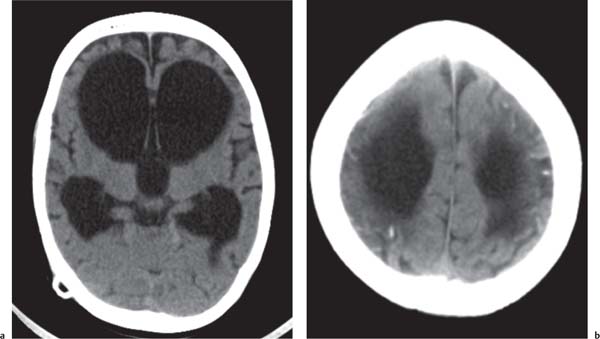
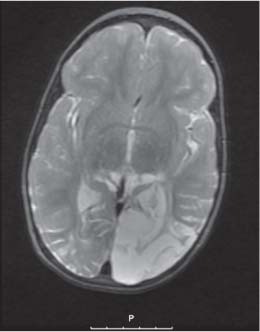
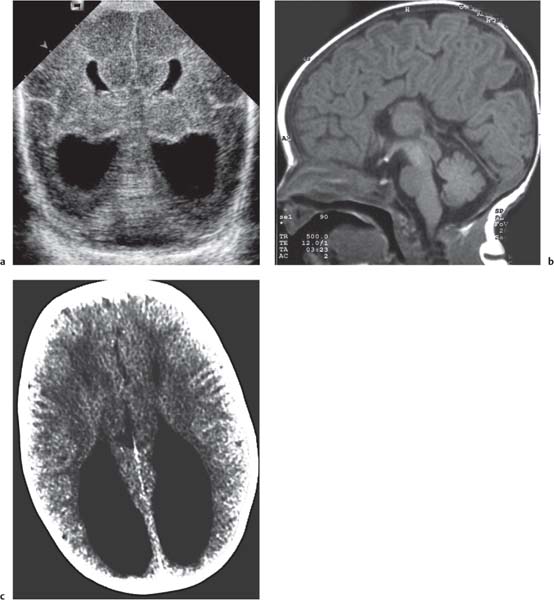
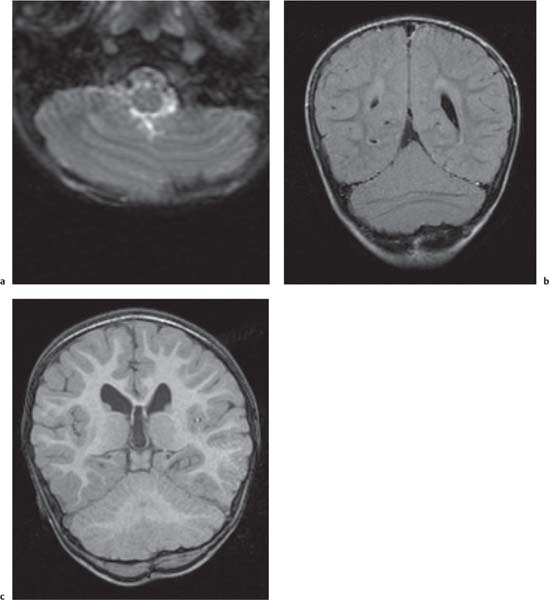
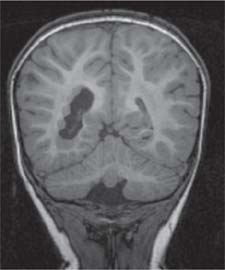
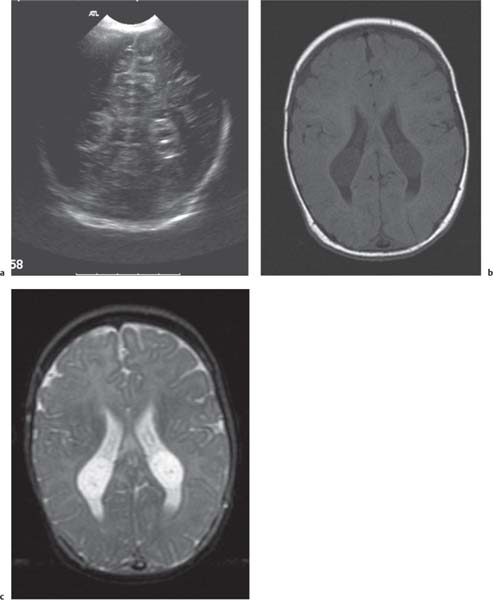
Callosal agenesis
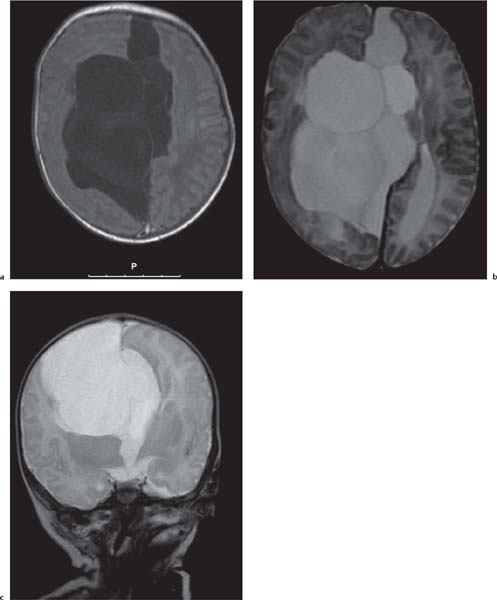
Fig. 4.42a–c
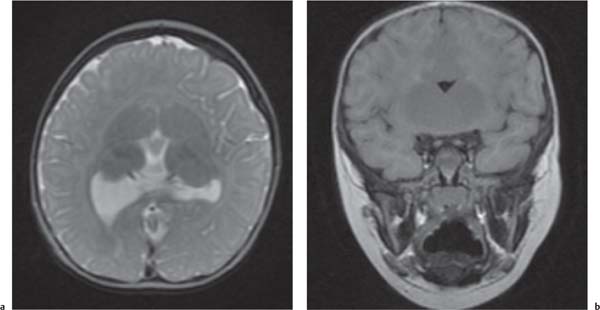
Fig. 4.43a–c |
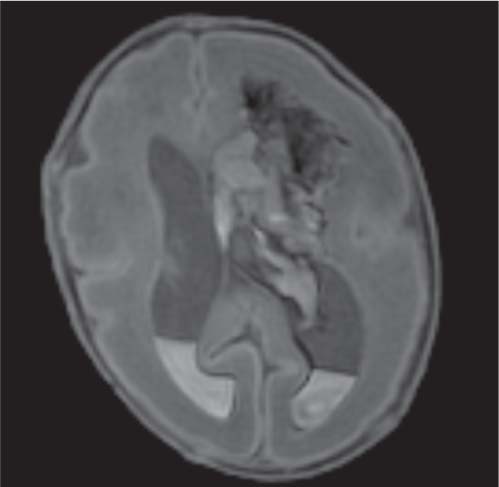
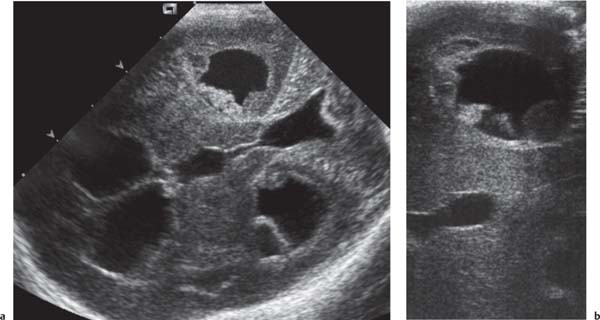
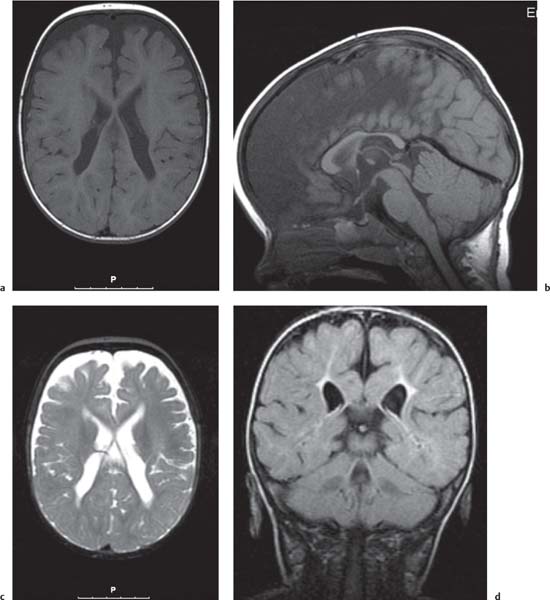
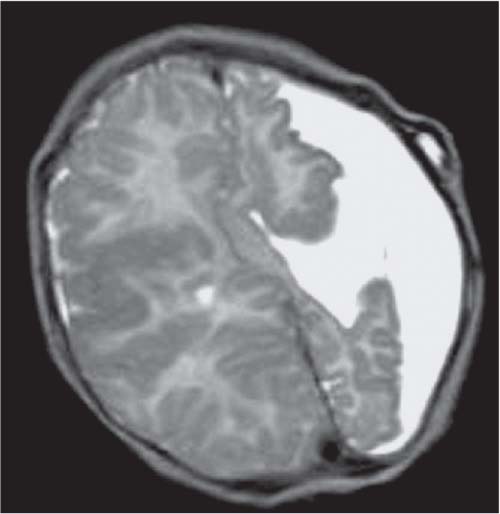
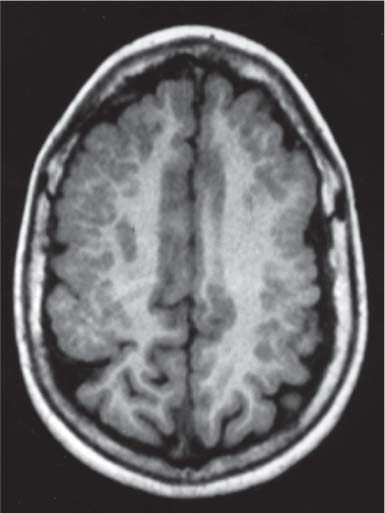
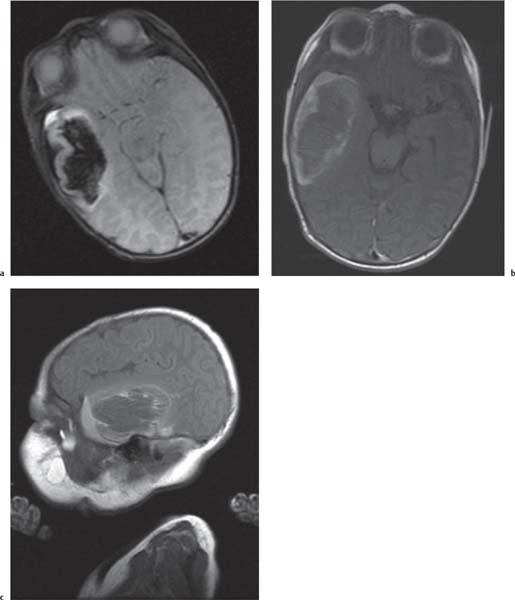
On US, abnormalities of the corpus callosum can be diffcult to identify. Indirect signs of callosal anomalies on US include lack of visualization of the cavum septi pellucidi, enlarged atria and occipital horns resulting in a teardrop configuration of the lateral ventricles, a high-riding third ventricle, and radiating medial hemispheric sulci. On MRI, abnormalities of the corpus callosum are more easily detected. |
More than three-quarters of patients with callosal agenesis have additional CNS anomalies, and two-thirds have additional extra-CNS anomalies. Associations with callosal agenesis include Chiari type II malformation, Dandy-Walker malformation, gray matter heterotopia, holoprosencephaly, schizencephaly, and encephaloceles. |
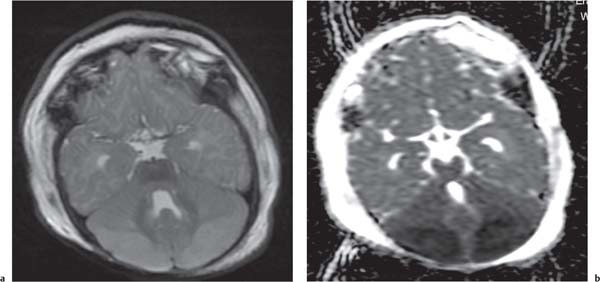
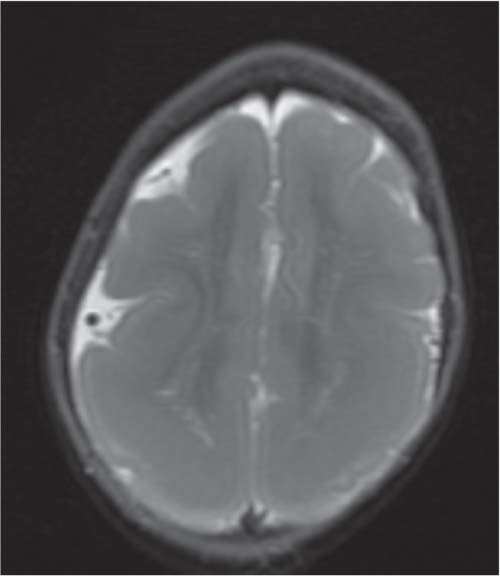
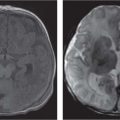
Holoprosencephaly
Fig. 4.44a, b, p. 332 |
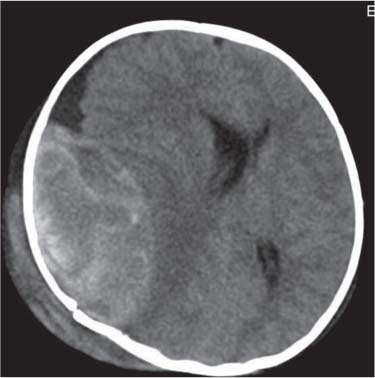
MRI is the imaging modality of choice.
Alobar: Absence of falx, interhemispheric fissure, septum pellucidum, and superior sagittal sinus. Thalami are fused. Single mono-ventricle. Approximately 90% have severe facial abnormalities, the most severe is cyclopia.
Semilobar: Partial development of falx, interhemispheric fis-sure, and superior sagittal sinus. Septum pellucidum is absent. Thalami may be fused. Thirty percent have facial abnormalities. Lobar: Midline structures almost normal. Septum pellucidum is absent. Rostral brain may show some midline deficiencies; posterior aspect of the brain is normal. May have severe facial abnormalities. |
Different types of holoprosencephaly exist, representing a continuous spectrum. The most severe type is alobar, followed (in decreasing severity) by semilobar, and the lobar type.
Semilobar most common type. Alobar usually lethal. |
Septo-optic dysplasia |
Third ventricle and thalami are normal. Also corpus callosum is present. Thin optic chiasm. |
Some consider septo-optic dysplasia as a variant of lobar holoprosencephaly. |
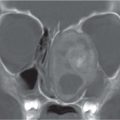
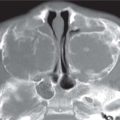
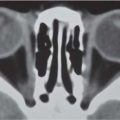
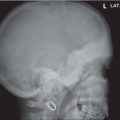
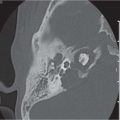
Cephaloceles |
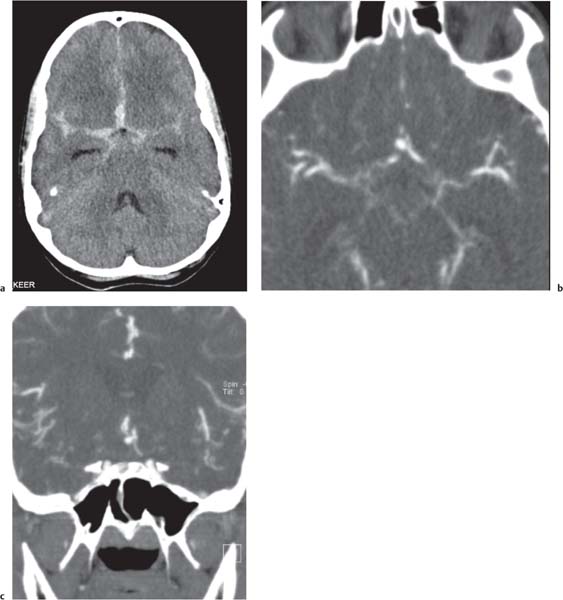
CT is the modality to show the bone defect; MRI is the best technique to confirm presence of brain tissue in a cephalocele. |
Can occur anywhere in the cranial vault, but most commonly in the midline at the occiput, skull base, or vertex. The most common basal cephalocele is the sphenopharyngeal type. |
Chiari malformations
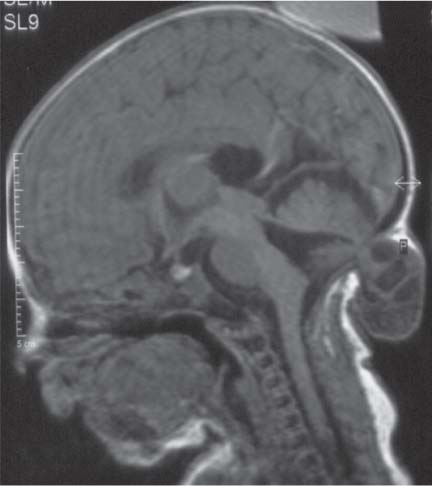
Fig. 4.45 |
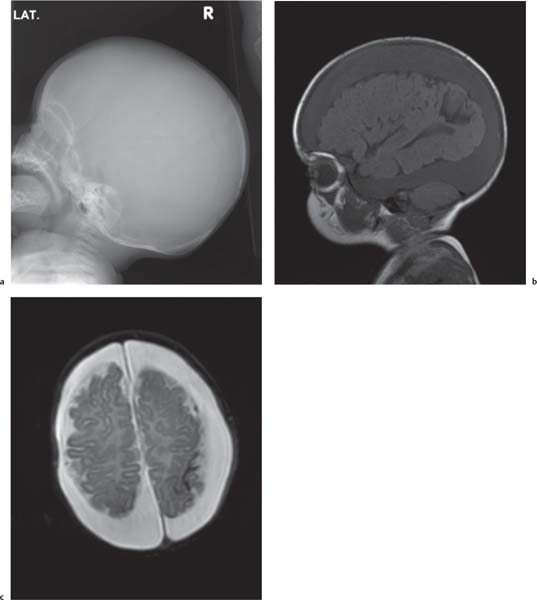
Chiari malformation is more a MRI diagnosis than a US one.
Chiari type I: cerebellar tonsils below foramen magnum > 5 mm, small posterior fossa, 50% asymptomatic, 50% hydromyelia, no myelomeningocele (MMC).
Chiari type II: Cerebellar tonsils and part of vermis below foramen magnum. Dorsal medulla descends behind cervical spinal cord, kinking medullocervical junction. Beaking of tectum, hydrocephalus, small posterior fossa, strawlike fourth ventricle, and 100% associated with MMC.
Chiari type III: occipital cephalocoele involving cerebellar tissue with traction on brainstem.
Chiari type IV: Chiari type II with vanishing cerebellum. |
All Chiari types are the result of lack of expansion of fourth ventricle with consequent hypoplasia of the posterior fossa. |
Dandy-Walker complex |
Hypoplasia of the vermis, a pseudocystic fourth ventricle, upward displacement of the tentorium, and torcular and AP enlargement of the posterior fossa. A Blake pouch cyst has also been referred to as Dandy-Walker variant. Although US can easily identify severe Dandy-Walker malformations, it is generally more limited in distinguishing mild forms of vermian hypoplasia from a mega cisterna magna or an arachnoid cyst than MRI. |
A cerebellar vermis with three groups of lobes and two main fissures, identified on sagittal MRI T2 images, not only has the greatest chance not to be associated with other malformations but also to have a favorable neurocognitive outcome. On the contrary, a deeply dysgenetic vermis with only two or one recognizable lobes is not only constantly associated with other brain malformation but also with poor prognosis. |
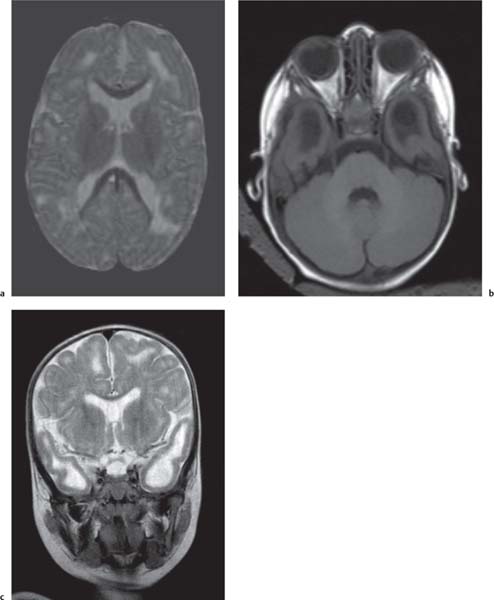
Cerebellar anomalies
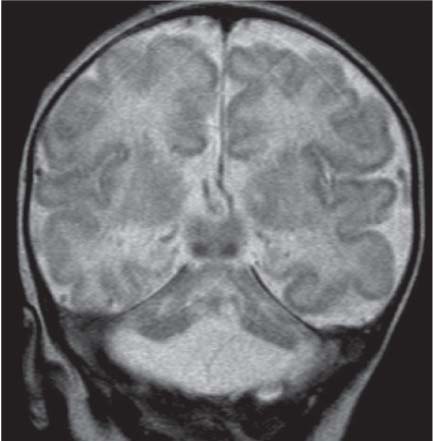
Fig. 4.46
Fig. 4.47a–c, p. 334 |
Cerebellar, vermian hypoplasia: focal and generalized hypoplasia (Dandy-Walker continuum with enlarged fourth ventricle, pontocerebellar hypoplasia with normal fourth ventricle).
Cerebellar dysplasia:
Focal vermian dysplasia with molar tooth sign (Joubert and Joubert-like syndromes)
Rhombencephalosynapsis
Generalized dysplasia: (congenital muscular dystrophies, CMV, lissencephaly with reelin [RELN] gene mutation, lissencephaly with agenesis of corpus callosum and cerebellar dysplasia, associated with diffuse cerebral polymicrogyria and diffusely abnormal foliation).
|
|
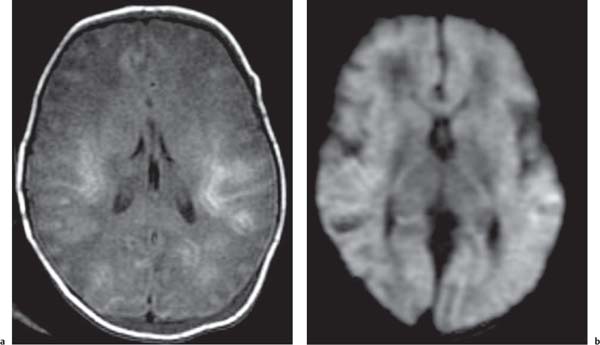
Spectrum of neuronal migration anomalies |
MRI is superior to US in identifying schizencephaly, lissencephaly, polymicrogyria, and gray matter heterotopia. |
Epilepsy is often present in patients with cortical malformations and tends to be severe, although its incidence and type vary in different malformations. |
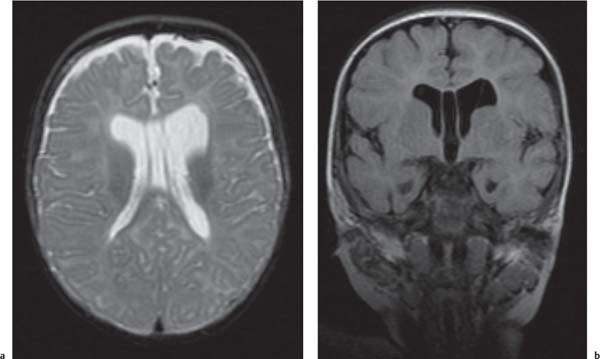
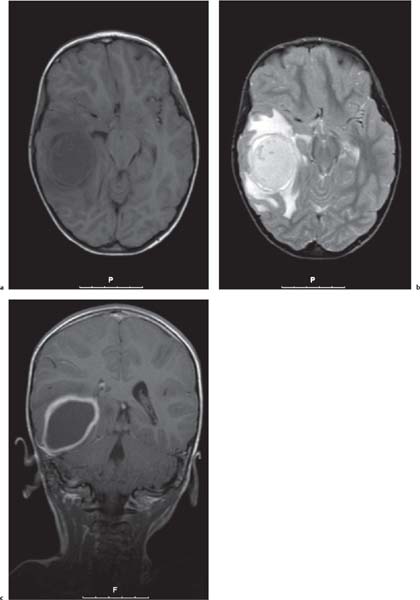
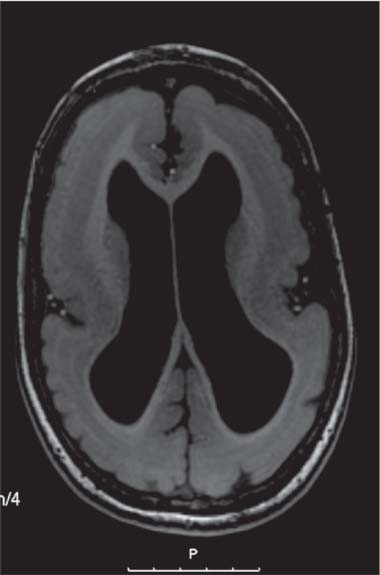
Periventricular nodular heterotopia (PNH)
Fig. 4.48 |
Appears as nodules that are isointense to the gray matter and are located along the ventricular walls. |
PNH is a malformation of neuronal migration in which a subset of neurons fails to migrate into the developing cerebral cortex. X-linked PNH is mainly seen in females and is often associated with focal epilepsy. Filamin A mutations have been reported in all familial cases and in about 25% of sporadic patients. A rare recessive form of PNH due to ARGEF2 gene mutations has also been reported in children with microcephaly, severe delay, and early seizures. |
Lissencephaly (also known as agyria, smooth brain) and subcortical band heterotopia
Fig. 4.49, p. 336
Fig. 4.50, p. 336 |
Classic lissencephaly is associated with the shallow appearance of the sylvian fissures, reduced number or complete absence of additional sulci for the expected gestational age of the fetus, absence of normal multilayered appearance of the brain, and a large thick band of arrested neurons within the developing white matter.
Autosomal recessive lissencephaly with cerebellar hypoplasia, accompanied by severe delay, hypotonia, and seizures, has been associated with mutations of the RELN gene. X-linked lissencephaly with corpus callosum agenesis and ambiguous genitalia. |
Disorders of neuronal migration represent a malformative spectrum resulting from mutations of either LIS1 or DCX genes. LIS1 mutations cause a more severe malformation in the posterior brain regions. Most children have severe developmental delay and infantile spasms, but milder phenotypes are on record, including posterior SBH owing to mosaic mutations of LIS1. DCX mutations usually cause anteriorly predominant lissencephaly in males and SBH in female patients. Mutations of DCX found in male patients with anterior subcortical band heterotopia (SBH) and in female relatives with normal brain MRI in genotypic males are associated with mutations of the ARX gene. Affected boys are severely delayed and show seizures with suppression-burst electroencephalogram. Early death is frequent. Carrier female patients can have isolated corpus callosum agenesis. |
Schizencephaly
Fig. 4.51, p. 336 |
Schizencephaly appears as a gray matter–lined cleft extending from the ventricle to the subarachnoid space. Closed-lip schizencephaly is characterized by gray matter–lined lips that are in contact with each other (type I). Open-lip schizencephaly has separated lips and a cleft of CSF, extending to the underlying ventricle (type II). |
The etiology is unclear, although a primary malformation secondary to a neuronal migrational anomaly is considered most likely. Familial cases of schizencephaly have been reported, suggesting a possible genetic origin within a group of neuronal migration disorders. Heterozygous mutations of the EMX2 have been reported in cases with schizencephaly. However, early prenatal injury, such as that associated with drug abuse or abdominal trauma, has also been reported to be associated with schizencephaly, possibly from a vascular insult or resulting from CMV infection. Therefore, the appearance of schizencephaly is likely to be secondary to multiple factors, leading to a final common manifestation of abnormal neuronal migration. |
Polymicrogyria
Fig. 4.52, p. 336
Fig. 4.53, p. 337 |
Polymicrogyria appears as localized and/or generalized absence of normal sulcation with multiple abnormal infoldings of the affected cortex. |
Among several syndromes featuring polymicrogyria, bilateral perisylvian polymicrogyria shows genetic heterogeneity, including linkage to chromosome Xq28 in some pedigrees, AD or recessive inheritance in others, and an association with chromosome 22q11.2 deletion in some patients. About 65% of patients have a severe form of epilepsy. Recessive bilateral frontoparietal polymicrogyria has been associated with mutations of the GPR56 gene. |