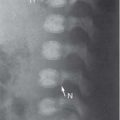
Chronically elevated ICP
Fig. 4.26 |
Enlarged sella without changes in contour and structure. Sometimes with an empty sella appearance. |
Triventricular hydrocephalus due to obstruction at the aquaduct as a result of tumor compression, postinfection, or posthemorrhage. May also occur in (non) syndromal craniosynostosis. |
Parasellar mass effect |
|
|
Glioma of the optic nerve and hypothalamus |
Enlarged sella with changes in contour and structure. Hypothalamic and optic chiasm glioma are sometimes indistinguishable. |
MRI is the imaging modality of choice. |
Suprasellar cysts |
Part of a cystic form of a craniopharyngioma or glioma, or arachnoid cyst. |
MRI is the imaging modality of choice. |
NF/neuroma/schwannoma |
Enlargement is rare. The most frequent schwannoma is of the trigeminal nerve. |
|
Chordoma |
May extend into the sellar region, destructing the floor and dorsum sellae. |
|
Intrasellar mass effect |
|
|
Rathke cleft cyst
Fig. 4.27a–c |
Located between the anterior and intermediate lobes of the pituitary gland. Almost always intrasellar in location. On MRI, the signal intensity depends on its content. If the protein content is less than 15%, the cyst is hypointense on T1 and hyperintense on T2. Between 15%–25%, the cyst may be hyperintense on T1 and T2. In more than 25%, it may be hyperintense on T1 and hypointense on T2. Rim enhancement may be seen. |
Rarely symptomatic, unless larger than 1 cm. MRI is the imaging modality of choice. |
Craniopharyngioma |
Look for density (CT) or signal intensity (MRI) differences in the cystic parts of the mass, due to special “motor oil” content. |
Most common intrasellar tumor. CT may be helpful for identifying calcifications. |
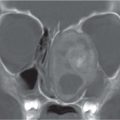
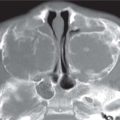
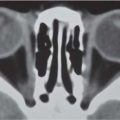
Hypophyseal tumors
Fig. 4.28a–d |
Adenoma is most common sellar/parasellar mass. Macroadenoma (> 1 cm) causes visual disturbance or hypopituitarism. Usually erosion of the bottom of the sella. Rarely invasive with extension into the sphenoid sinus. Macroadenoma may also give parasellar extension into the cavernous sinus. |
Presentation near puberty. MRI is the imaging modality of choice. |
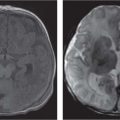
Germinoma
Fig. 4.29a–c |
Thirty-five percent are intra-/suprasellar. Usually large at presentation. On CT, the mass is well-marginated and isodense to hyperdense to brain parenchyma with homogeneous enhancement. On MRI, the mass is hypointense to isointense to gray matter on T1 and hyperintense on T2 and shows intense enhancement after Gd. CSF spread and systemic metastasis is possible. |
Clinical presentation includes diabetes insipidus, visual disturbances, and panhypopituitarism. |
Meningioma |
Rare in children. |
|
Metastasis |
Leukemia and lymphoma do occur. |
Most patients die before becoming symptomatic, but diabetes insipidus may occur. |
Untreated hypothyroidism |
Massive enlargement without destruction. |
Enlargement due to reactive response of hypophysis. |
Empty sella syndrome (ESS)
Fig. 4.26, p. 317 |
MRI shows a flattened gland with increased CSF within the sella turcica. Enlargement and erosion of the sella may be seen. Normal position differentiates ESS from arachnoid cyst. |
The causes of ESS may be high ICP, neglected or improperly treated hydrocephalus, and suprasellar arachnoid cyst. Primary ESS has also been described. |