Cardiac fibrosis, characterized by net accumulation of extracellular matrix in the myocardium, is a common final pathway of heart failure. This myocardial fibrosis (MF) is not necessarily the primary cause of dysfunction; it often results from a reparative process activated in response to cardiomyocyte injury. In light of currently available treatments, late-identified MF could be definitive or irreversible, associated with worsening ventricular systolic function, abnormal cardiac remodeling, and increased ventricular stiffness and arrhythmia. T1 mapping should be used to detect incipient changes leading to myocardial damage in several clinical conditions and also in subclinical disease. This article reviews available techniques for MF detection, focusing on noninvasive quantification of diffuse fibrosis and clinical applications.
Key points
- •
Cardiac fibrosis, characterized by net accumulation of extracellular matrix (ECM) in the myocardium, is a common final pathway of heart failure.
- •
Tissue characterization is a key capability of CMR imaging that reinforces its role as the best noninvasive tool available, allowing detection of MF.
- •
The use of CCT for tissue characterization has been validated, with CCT findings showing good correlation with CMR imaging findings.
- •
T1 mapping should be used to detect incipient changes leading to myocardial damage in several clinical conditions and also in subclinical disease.
Introduction
Cardiac fibrosis, characterized by net accumulation of extracellular matrix (ECM) in the myocardium, is a common final pathway of heart failure. This myocardial fibrosis (MF) is not necessarily the primary cause of dysfunction; it often results from a reparative process activated in response to cardiomyocyte injury. In light of currently available treatments, late-identified MF could be definitive or irreversible, associated with worsening ventricular systolic function, abnormal cardiac remodeling, and increased ventricular stiffness and arrhythmia.
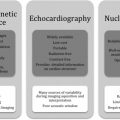
Cardiac magnetic resonance (CMR) imaging has evolved significantly in the last decade from a modality restricted to anatomic imaging to one that allows comprehensive assessment of myocardial anatomy and function with unequaled accuracy and reproducibility. Diverse facets of cardiovascular diseases can be assessed in a single examination, which has significant clinical impact. Tissue characterization is a key capability of CMR imaging that reinforces its role as the best noninvasive tool available, allowing detection of even small areas of MF by late gadolinium enhancement (LGE). In addition, CMR imaging enables differentiation between ischemic and nonischemic patterns according to coherence with the coronary territory and distribution in relation to the subendocardium.
Cardiac computed tomography (CCT) is a significantly faster and more widely available imaging modality that is tolerated well by patients and has been validated for use in the detection of focal myocardial scarring, calcification, and thrombi. The use of CCT for tissue characterization has been validated recently, with CCT findings showing good correlation with CMR imaging findings.
This article reviews available techniques for MF detection, focusing on noninvasive quantification of diffuse fibrosis and clinical applications.
Pathogenesis of myocardial fibrosis
Myocardial Interstitial Space Components
Cardiac tissue is made up of highly differentiated cardiomyocytes and stroma (mainly ECM, with tissue fluid and other cells). Cardiac ECM contains fibrillar collagen, especially types I (80%) and III (11%), which provides a structural base for cardiomyocytes and vessels, as well as the consistency required for cardiac tissue resistance to deformation during the cardiac cycle. Collagen fibers also connect adjacent contractile elements and serve as transducers of muscle contraction.
Fibrosis Causes and Subtypes
Microscopically, fibrosis is characterized by an excess of collagen fibers in the ECM caused by the combined increase in collagen synthesis by fibroblasts and myofibroblasts, and decrease or maintenance of collagen degradation by matrix metalloproteinases, leading to the occupation of spaces that should correspond with specialized parenchymal cells. In these coexisting matrices, a constant flux of tissue and collagen turnover is orchestrated by regulatory cytokines, growth factors, enzymes, hormones, and direct cell-to-cell communication induced by mechanical stress, the hormonal environment, and inflammatory responses. Progressive collagen accumulation accounts for a spectrum of ventricular dysfunctional processes that commonly affect diastole first, and subsequently involve systolic performance.
According to the cause of increased interstitial space, fibrosis has 3 subtypes:
- 1.
Reactive interstitial fibrosis (diffuse interstitial or more specifically perivascular distribution). This fibrosis subtype has a progressive onset. It has been described primarily in hypertension, diabetes mellitus, idiopathic dilated cardiomyopathy (DCM), and chronic aortic valve disease, and in remote noninfarcted myocardium after infarction. Interstitial fibrosis is an intermediate marker of disease severity that precedes irreversible replacement fibrosis.
- 2.
Infiltrative interstitial fibrosis. This fibrosis subtype is induced by progressive deposition of insoluble proteins (amyloidosis) or glycosphingolipids (Anderson-Fabry disease [AFD]) in the cardiac interstitium.
- 3.
Replacement fibrosis: localized (ischemic cardiomyopathy, myocarditis, hypertrophic cardiomyopathy [HCM], sarcoidosis) or diffuse (chronic kidney disease, toxic cardiomyopathies, inflammatory diseases) distribution. This fibrosis subtype is characterized by the replacement of myocytes after cell damage or necrosis by plexiform fibrosis, composed mainly of type I collagen.
Detection by cardiac magnetic resonance imaging
Relaxation Times
In CMR imaging, the pixel signal intensity is based on the relaxation of hydrogen nucleus protons in the static magnetic field and on proton density. Such proton relaxation characterizes the longitudinal (spin-lattice; T1) and transverse (spin-spin; T2) relaxation times (in milliseconds). T1 and T2 relaxation times depend on the water molecular environments in tissues and are thus specific to tissue types, varying significantly among tissues but also within the same tissue depending on physiopathologic status (ie, inflammation, edema, or fibrosis).
T1 Terms
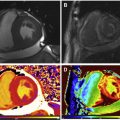
T1 values represent the recovery of longitudinal magnetization. Native T1 refers to a value obtained without or greater than or equal to 24 hours after contrast agent application in a patient with normal renal function. A T1 map of the myocardium is a parametrically reconstructed image in which the intensity of each pixel corresponds directly with the T1 value for the corresponding myocardial voxel; a color table is used to facilitate visual assessment.
Gadolinium Enhancement
Gadolinium contrast agents reduce T1 values in adjacent tissue. Thus, local gadolinium tissue concentrations induce differences in signal intensity on T1-weighted images. LGE use for MF visualization is based on the combined increase in contrast agent distribution volume and prolongation of washout related to decreased capillary density in MF tissue.
Extracellular Volume
The myocardial extracellular volume (ECV; percentage) reflects the volume fraction of heart tissue not occupied by cells. The partition coefficient (λ) reflects the relationship between changes in precontrast and postcontrast myocardium and blood T1:
where R1 is tissue relaxivity (1/T1) and ΔR1 is R1 postcontrast – R1 precontrast . ECV calculation incorporates correction for the blood plasma volume:
ECV maps can be generated on a pixel-wise basis when native and postcontrast T1 images are coregistered, quantified, and adjusted for the hematocrit.
T1 Sequences
In a quantitative myocardial T1 sequence, an initial pulse alters the longitudinal magnetization, followed by image acquisition along the relaxation curve and model fitting to derive T1 values. The initial pulse may induce an inversion recovery (IR; modified look-locker inversion recovery [MOLLI], shortened MOLLI [ShMOLLI], accelerated and navigator-gated look-locker imaging for cardiac T1 estimation [ANGIE], slice-interleaved T1 [STONE] ), saturation recovery (SR; saturation recovery single-shot acquisition [SASHA] ), or combined (saturation pulse–prepared heart rate–independent inversion recovery [SAPHIRE] ) sequence.
MOLLI is the most thoroughly assessed T1 mapping sequence. The original MOLLI sequence used 17 heartbeats with acquisition of 3-3-5 images and 3 heartbeats for recovery between each acquisition [3(3)3(3)5]. Issues with this sequence include its heart rate dependence, long acquisition time, and T1 value underestimation (especially with fast heart rates). To correct for these factors, new combinations of inversion/recovery times and numbers of heartbeats were proposed: native acquisition, 5(3)3 (fewer heartbeats, less heart rate dependence); postcontrast acquisition, 4(1 s)3(1 s)2 (shorter recovery time). These sequences feature rapid acquisition and no heart rate dependence, but the native sequence results in T1 value underestimation because of magnetization transfer effects. Few validation studies for the postcontrast sequence have been conducted. For the blood pool, in which fresh blood enters the image plane, the use of uncorrected T1* images is recommended.
The ShMOLLI sequence requires only 9 heartbeats, using a 5(1)1(1)1 scheme. It has no heart rate dependence and is accurate in precontrast and postcontrast acquisition, but its signal-to-noise ratio is lower than that of MOLLI, it is more artifact prone, and it causes systematic T1 value underestimation at greater than 800 milliseconds (formula corrected).
In the SASHA sequence, 1 image is acquired before saturation, followed by the application of multiple SR pulses with different trigger delay times. This sequence has no T1* effect, heart rate dependence, or T2 sensitivity with a 3-parameter fit, and it is less sensitive to off-resonance effects. However, SR sequences have lower signal-to-noise ratios and less precision when used with a 2-parameter fit compared with IR sequences.
Recently described techniques expand the T1 mapping options. The combined SR/IR SAPHIRE sequence is not sensitive to variations in heart rate but has slightly longer acquisition times. Slavin and colleagues described the SMART1Map SR sequence, in which each R-R interval receives a saturation pulse with the acquisition of longer delay times in the recovery curve, performed across multiple heart beats. This technique obviates T1* correction, as does MOLLI, and is less sensitive to other imaging parameters. Whole-heart T1 mapping with 3D ANGIE and STONE sequences provides full left ventricle (LV) coverage with free-breathing acquisition. In patients with atrial fibrillation, systolic data acquisition using these methods might be more robust than diastolic readout, but it yields lower T1 values.
Specialty societies such as the Society for Cardiovascular Magnetic Resonance/European Association for Cardiovascular Imaging have already made some recommendations that should be followed ( Box 1 ).
- •
Native T1 measured in the absence of contrast agent, greater than or equal to 24 hours from last dose in patients with normal renal function.
- •
Diastolic image acquisition recommended when heart rhythm is regular (specific sequences for tachyarrhythmia are available).
- •
Review of image quality during acquisition; repeat examination when quality is suboptimal or images are nondiagnostic.
- •
Hematocrit for ECV calculation obtained immediately or less than or equal to 24 hours before scanning.
- •
Gadolinium-based contrast doses of 0.1 to 0.2 mmol/kg recommended.
- •
Postcontrast T1 mapping performed 10 to 30 minutes after contrast administration.
- •
Native and postcontrast T1 mapping using the same slice prescription.
- •
For global/diffuse disease, basal and mid short-axis mapping, with optional single long-axis map acquisition. For patchy disease, basal and mid short-axis mapping, with mandatory acquisition of at least 1 long-axis map (4 chamber for amyloid to visualize base-apex gradient, 3 chamber for AFD to assess basal inferolateral scarring).
- •
For global/diffuse assessment, definition of a single region of interest (ROI) in the septum on midcavity short-axis maps to avoid lung, liver, and vein susceptibility artifacts. Additional ROIs possible for areas of visually abnormal appearance. ROIs can exclude infarcts (ie, include remote myocardium) and include nonischemic LGE.
- •
Mapping results include absolute numerical values, Z scores (number of SDs by which results differ from local normal mean) when available, and normal reference ranges.
- •
Interpretations presented as normal or mild, moderate, or severe increase/decrease in ECV.
Detection by cardiac computed tomography
Delayed Enhancement
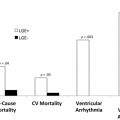
Myocardial delayed enhancement (MDE) CMR imaging and MDE computed tomography (CT) have shown good correlation and additional value to its use in clinical practice. For MF, MDE images are obtained after intravenous administration of iodine contrast using a retrospective electrocardiogram-gating cardiac helical protocol. Senra and colleagues showed that hypoenhancing areas by the presence of calcium on MDE-CMR imaging were better evaluated by multidetector CT using the calcium scoring technique, which shows massive subendocardial calcification, and by MDE-CT, which showed LV apical obliteration with MDE areas associated with calcification. In addition, MDE-CT identified thrombi and calcification matching calcium score images. On MDE-CMR imaging, calcium and thrombi appear indistinctly as large, dark subendocardial areas. A recent study evaluating the prognostic significance of MF detection by CCT in high-risk patients with HCM with implantable cardioverter-defibrillators (ICDs) showed that patients with more severe MF detected by CCT were more likely to have ventricular fibrillation and tachycardia events that were treated appropriately by ICDs.
Extracellular Volume Measurement
Although ECV imaging by CCT lags behind that by CMR imaging, it is an attractive alternative when CMR imaging is contraindicated. CCT-based ECV calculation relies on the same principle as CMR imaging-based calculations:
where ΔHU is the change in Hounsfield unit attenuation between precontrast and postcontrast. Nacif and colleagues validated CCT-based ECV calculation for humans in 2012; postcontrast images are obtained after a delay of 5 to 10 minutes using the same parameters as for the initial precontrast calcium score scan. ECV measured with CCT shows good reproducibility and correlates well with ECV measured with T1-mapping CMR imaging–determined values ( r = 0.82; P <.001) . In addition, greater ECV values were associated with reduced ejection fractions and increased end-systolic and end-diastolic volumes.
The use of dual-energy CT to quantify myocardial ECV might eliminate misregistration errors associated with separate precontrast and postcontrast scans by obviating the need for the precontrast scan.
CT is faster and more widely available, offers greater spatial resolution (particularly in-plane), and permits better isotropic reconstruction than MR imaging. In addition, CCT-based ECV measurement reflects the direct effect of iodine-based contrast agents on the signal (through x-ray absorption), whereas CMR imaging–based assessment relies on measurement of the effect of gadolinium-based contrast agents on protons (assuming the same tissue relaxivity relative to blood, and rapid water exchange between intracellular and extracellular compartments). Furthermore, common contraindications for CMR imaging, such as claustrophobia and some pacemakers, do not apply to CCT.
Clinical applications
The ECV may increase with fibrosis, edema, and/or other protein (amyloid) deposition. Increased capillary density and vasodilatation increase the ECV to a smaller extent. Therefore, ECV changes in isolation require interpretation. Mathematical ECV derivation relies on several assumptions (including the fast-exchange limit), λ measurement, and the patient’s hematocrit, representing the cellular fraction of blood.
LGE provides important diagnostic and prognostic information, but T1 mapping and ECV calculation may better quantify the degree of ECM/interstitial expansion. The use of T1 distributions to identify distinct myocardial patterns, such as diffuse MF, specific myopathies, and the periinfarction (gray) zone, should be evaluated in large clinical studies. Applied rigorously, T1 mapping could be ideal for the assessment and quantification of diffuse MF. It could also improve the accuracy of delayed enhancement and MF characterization.
Peculiarities of T1/T1 mapping/ECV calculation in clinical situations of acute (ischemic and inflammatory) and longer-term myocardial damage are briefly described next.
Myocardial Infarction
LGE-CMR imaging has been the gold standard for myocardial infarction (MI) detection and viability assessment, but T1 mapping and ECV assessment provide complementary diagnostic and prognostic information.
In areas of acute ischemia and infarction, native T1 and T2 relaxation times lengthen and the postcontrast T1 time shortens relative to those of remote myocardium. Native T1 may also provide prognostic information through infarct core identification, which is associated inversely with adverse remodeling and all-cause death or first postdischarge hospitalization for heart failure in patients with ST-elevation MI.
Acute and chronic infarcts present distinct T1 changes; precontrast T1 mapping enables acute MI detection, and chronic MIs are associated with adipose tissue deposition, which significantly reduces the T1 relaxation time. The presence of iron after previous bleeding is reflected by a decrease in the T1 value relative to an increase in the surrounding area.
In chronic MI, ECVs reach 60% to 70% without associated microvascular obstruction. T1 mapping with several standard LGEs showed that within 1 week after acute MI the remote region undergoes ECM expansion associated with systolic dysfunction. In patients with chronic total coronary artery occlusion who had undergone revascularization, CMR imaging–based global baseline ECVs less than 30% predicted significant ejection fraction improvement.
Although LGE will remain the mainstay for clinical detection of chronic and acute MIs, T1 mapping and ECV assessment permit further distinct evaluation of remote and periinfarct zones and additional pathophysiologic understanding.
Myocarditis
Clinical and experimental evidence consistently shows the role of T1 mapping in determining the location, extent, and patterns of acute myocarditis, with significantly greater sensitivity than the Lake Louise criteria (85% vs 74%; P = .025). Native T1 and T2 mapping with LGE significantly improved the diagnostic accuracy of CMR imaging to 96%.
T1 values are significantly increased in patients with acute myocarditis compared with healthy subjects and those with chronic convalescent disease ( Fig. 1 ). Hinojar and colleagues proposed T1 relaxation time cutoffs of greater than 5 standard deviations (SDs) to diagnose acute myocarditis and greater than 2 SDs (native T1) for the convalescent phase. Bohnen and colleagues described the use of noncontrast T1/T2 mapping to monitor the course of myocardial inflammation in healing myocarditis.

Related posts:
 The Role of Cardiac MR Imaging in the Assessment of Patients with Cardiac Amyloidosis
 Applications of Cardiac MR Imaging in Electrophysiology
 The Role of Contrast-Enhanced Cardiac Magnetic Resonance in the Assessment of Patients with Malignant Ventricular Arrhythmias
 State-of-the-Art Quantitative Assessment of Myocardial Ischemia by Stress Perfusion Cardiac Magnetic Resonance
 Assessment of Cardiotoxicity of Cancer Chemotherapy
 The Prognostic Value of Late Gadolinium Enhancement in Nonischemic Heart Disease
Stay updated, free articles. Join our Telegram channel

Full access? Get Clinical Tree


