Frequency (MHz)
Resolution (mm)
Depth (mm)
Axial
Lateral
3.5
7
2
160
5
0.6
1.2
100
7.5
0.4
0.8
50
1.2 Practical Application in US Device
1.2.1 Emission, Transmission, Reception and Amplification
1.2.1.1 Emission
US waves emitted by transducer crystals; contain 64–512 crystals in conventional US:
Specific modern transducer technologies: matrix transducers, 1.5D arrays, 2D arrays; may contain up to several thousand single crystals.
Future specific transducers (developed for 3D-/4DUS) > 10,000 single elements.
Good contact of transducer to skin mandatory for optimal US transmission into tissue; achieved by surface shape of transducer, material of transducer membrane and (sufficient) US gel to eliminate air.
1.2.1.2 Transmission
US waves partially absorbed and partially reflected, the latter particularly at border of different tissues.
1.2.1.3 Reception
After emission of US wave – crystal function changed to receive. Reflected US waves create electric signal within crystal; amount of electric energy depends on amount of reflected sound energy:
More reflected sound – more electric impulse – brighter, more echogenic signal.
Moderate reflection – poor echo.
No reflection – echo free or anechoic.
Spatial location of reflecting structure defined by time interval between emitting and receiving:
The deeper a structure the longer the sound beam needs to travel to it and back.
Measured time between sound emission and reception of certain reflected energy defines position/depth of certain structure within US field/image (in B-Mode US). The longer sound takes to travel, the deeper position of respective structure.
1.2.1.4 Amplification
Electric signals created by incoming reflected US waves in crystals amplified within US system for further processing.
1.2.2 Signal Processing
Raw signal processed using multiple parameters/methods.
1.2.2.1 Preprocessing
Performed during investigation, includes electronic modulation of signal quality during sending (beam forming) as well as modulation of sensitivity of crystal during receiving.
1.2.2.2 Post-processing
Performed once data collected, i.e. on frozen image. Many different electronic modulation tools can be applied to improve image quality, modulate contrast, weight certain gray levels, etc.
1.2.2.3 Time Gain Compensation (TGC)
Reflected echoes from deeper areas have to pass through much more tissue, therefore suffer from more absorption: these signals are proportionally amplified to compensate for signal loss.
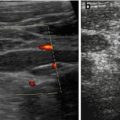
NOTE: TGC should be constantly optimised during investigation, varies with echodensity/absorption of more superficial transmitted structures (Fig. 1.1).
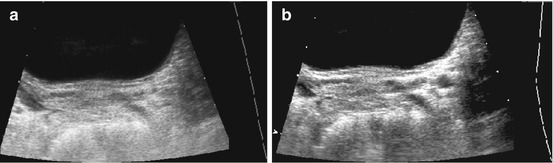
Fig. 1.1
TGC – image example (a) incorrect (b) correct TCG adaptation. (a) Incorrect image of the magnified retrovesical cross-section view without proper TGC adaptation – causes echogenic retrovesical structures reducing differentiation of anatomy; particularly the dilated left ureter cannot be clearly depicted (TCG settings recognisable by the dotted line on the right side of the image). (b) Same section as in (a) – TGC adapted: better image quality – the slightly prominent left ureter clearly visible distal as circular hypoechic structure
1.2.2.4 Sound Energy = Output
Maximum output intensity defined by equipment depending on manufacturer.
To avoid unnecessary overexposure of tissue/deterioration of image: decrease US intensity as much as possible. Definable partially by presets (e.g. fetal exams, transcranial/transfontanellar brain US, US of eye/testis) or individually at beginning of examination. Can (must) be seen on display – usually as percentage of maximum output gain.
NOTE: Every investigation should be performed at lowest possible sound output.
Impact of sound energy on tissue important to maintain safe sound pressure levels:
Parameters depend on many factors such as focal zone, frequency and output gain setting.
New indices established: reflect impact of US energy on tissue (mechanical index = MI, thermal index = TI); should (must) be displayed during every investigation – monitor/observe closely.
In general, MI/TI should be kept below 1 to maintain safe sound exposure levels:
For further details, see biological effects.
1.2.2.5 Gain
Defines overall amplification of incoming signals:
Optimise receive gain individually depending on output gain, patient, anatomy and area of investigation.
1.2.2.6 Frame Rate/Persistence
Persistence: defines speed of image update:
High frame rate – fast series of individual images, reduced susceptibility to motion artefacts – but usually at cost of slightly reduced resolution.
High persistence (information from series of individual images used to create final displayed image) – increased tissue density information and resolution – at cost of slower update of individual displayed image.
Frame rate (Hertz, Hz): usually US investigations operate at 4–60 Hz; faster frame rates are possible, e.g. for cardiac studies.
1.2.3 Components of US Device
Consists of emit and receive partition as well as transducers connected to system via cables.
Also: display monitor, keyboard, memory/data storage and documentation ability.
1.2.3.1 Transducers
Different types depending on underlying technology: mechanical, electronic and combined transducers.
Modern transducers usually use a range of frequencies, with an individually adaptable diagnostic effective middle frequency – called multifrequency transducers.
Sector Transducers
Small active surface (footprint) where sound beams emitted in sector format (Fig. 1.2):
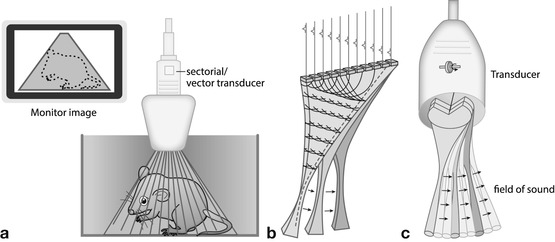
Fig. 1.2
Sector transducers – all creating a sector-like triangular image; good for small footprint access with wide view in far field. (a) Conventional sector: sector-like images created by dedicated array design or wobbling of a normal plane array. The wobbler technique hardly used anymore. Image is in a sector format; the shaded area represents the part of the structure that will be displayed on the monitor. (b) Phased/electronic (vector/sector) transducer: most commonly used format (alternatively mostly micro-curved arrays used). Image created by electronic steering of parallel-placed single elements. (c) Annular array: annular concentric US array which is shaped by specific lenses creating a very homogenous focal zone throughout the image field
Causes poor image quality in near field, improved visualisation of deeper fields.
Particularly useful for structures with only small access area (e.g. echocardiography – access between ribs or brain US – transfontanellar access).
Different techniques used to create sector-like field:
Mechanical devices that make crystal (or series of crystals) rotate or wobble:
Sector angle usually between 60 and 120° used for imaging.
NOTE: Mechanical transducers may deteriorate over time by physical use – not only proper handling but also exact production and alignment important (Fig. 1.2a). Important to freeze image (i.e. transducer) whenever one does not actually investigate to prevent early transducer deterioration/aging.
Electronic-phased array transducers – consist of series of crystals:
By individual steering of consecutive crystals with varying time intervals (presently most common technique), effective US beam can be directed in many directions creating sector-like imaging field (Fig. 1.2b).
Annular array transducers – combination of mechanical and electronic technology:
Various concentric rings of crystals selectively activated during scanning process create sector-like field with homogeneous focus zone throughout entire imaging field.
Linear Array Transducers
Parallel linear US beams created by multiple crystals – create rectangular image frame (Fig. 1.3a):
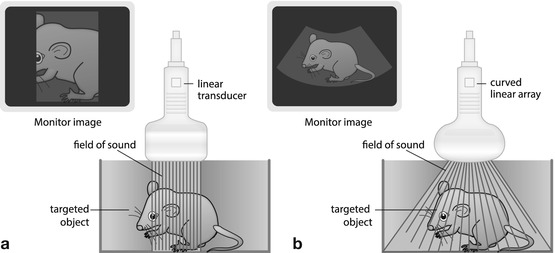
Fig. 1.3
Transducers. (a) Linear transducer: parallel sound waves create a rectangular image. (b) Curved(linear) array transducer: transducer elements assembled in slightly curved fashion; transducer surface thus is bent; the radius may vary creating a more or less trapezoid image that is wider in far field than in near field. Combines benefits of linear and sector transducers
Homogeneous resolution throughout entire imaging field, particularly valuable for near-field assessment.
Generally used for superficial structures (e.g. small-part applications, cervical vessels, infant hips, lymph nodes, soft tissue processes and bowel/appendiceal US).
New techniques allow for “phasing” of electronic linear transducer – creates “virtual sector” image (“trapezoid”) – larger field of view in far field, at cost of frame rate and penetration.
Curved Linear Array
Crystals aligned on curved surface – diverging US waves create sector-like imaging field (angle depends on radius of curvature); the larger surface (than sector transducer) offers good near-field information:
Combines abilities and benefits from sector and linear transducers.
Offer reasonable near-field resolution at large field of view at depth (Fig. 1.3b).
Typical application: abdominal US.
Other Transducers
Matrix – 1.5-/2-dimensional arrays: enable sound emission in two perpendicular planes by assembling elements in parallel rows:
Allow volume scanning (see 3DUS).
Improve lateral (out of plane/elevational plane) resolution by bidirectional focussing of US beam.
Parallel columns of elements allow for simultaneous handling of different tasks (improving frame rate, e.g. for image compounding or colour/duplex/triplex Doppler) by splitting individual operation modes to different parallel rows or cristals.
Intracavitary probes: mainly intravascular or endoscopic probes, transrectal/intravaginal probes:
Usually very small design, thus less elements.
Often higher frequencies – better resolution than with transabdominal/thoracic access but at restricted penetration.
Enable visualisation of areas impossible to properly depict by standard access.
Attached to endoscopic devices/intravascular catheters.
Often limited use for paediatric applications, as other access often works sufficiently and size relatively large for paediatric cavities.
Dedicated small paediatric devices rarely available (e.g. for transoesophageal echocardiography, transrectal pelvic floor US).
Some applications uncommon, non-existent or not accepted in paediatrics (e.g. transvaginal US).
1.2.3.2 Other Parts of US Device
Keypad (may be mobile and flexible).
Monitor (may be mobile and flexible, can and must be adjustable).
Printer/CD recorder.
In-/output options.
Cooling device with filters (need to be cleaned regularly).
Potentially gel bottle warming device and transducer stands.
1.3 US Methods
1.3.1 A (Amplitude)-Mode
Oldest US technique, still used today in ophthalmology (for measuring various small structures of eye).
Technique: emitted US impulse reflected at major interfaces, signal received during transmission break. Graph illustrates travel duration of US beam on x-axis and intensity of reflected echoes as amplitude spikes on y-axis (Fig. 1.4).
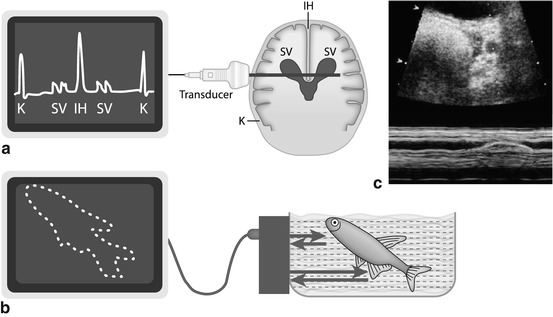
Fig. 1.4
US modes. (a) A (amplitude)-Mode – oldest US technique: US signals emitted along single line, amplitude of reflected echo encodes spike height on y-axis, whereas depth of origin of reflection from individual structures encoded on x-axis (time between emission and receive). (b) B (brightness)-Mode: transducer emits sound waves; the reflected echoes are received. Energy of echo encodes brightness of respective pixel on monitor; position of respective pixel calculated from individual travel time (i.e. time between sound emission and receiving, with known sound speed in tissue). (c) M (motion)-Mode : US image (of a prominent ureter, cross section through bladder) shows a dotted line defining the section where changes (i.e. motion, in this case ureteral peristalsis) over time are displayed as graph in lower part of image (blue). Originally this was applied in echocardiography without orienting B-Mode image, just displaying the lower graph to analyse heart wall or valve movements
1.3.2 (T)M-Mode (Time-Motion-Mode)
Used to show positional changes of reflecting interfaces over time.
Principle: on x-axis of monitor graph, changes in position of individual image pixels displayed; change in intensity of reflected echo is encoded by variation in brightness, whereas time is encoded on y-axis.
Method frequently used in echocardiography and in some dedicated applications, e.g. for assessment of peristalsis or motion (e.g. ureteral peristalsis, diaphragmatic motion) (Fig. 1.4c).
1.3.3 B (Brightness)-Mode
The commonly used real-time US imaging technique (Fig. 1.4b).
Technique: transmitted US waves reflected when encountering various interfaces:
Brightness of individual image pixels defined by intensity of reflected echoes (the stronger the echo the brighter the corresponding pixel).
Position of pixels defined by direction of transmitted beam inducing individual echo (encoded on x-axis) and time between sending and receiving (depth, encoded on y-axis).
All reflected echoes displayed on monitor correspond to travel time within predefined beam direction – calculated sectional image.
Repetitive frequent updates of such sectional images create movie-like impression enabling what is called “real-time US”.
1.3.4 Doppler Sonography
If sound reflected by moving interface, frequency of reflected wave is shifted (Doppler effect).
Frequency shift depends on angle between sound beam direction and direction of motion, as well as velocity of moving particle/interface; shift defined by Doppler calculation (Fig. 1.5a).
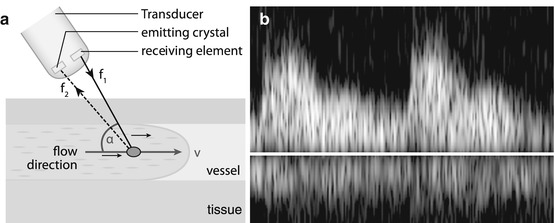
Fig. 1.5
Doppler US. (a) Doppler scheme: US signal emitted; frequency shift of received echo measured, thus flow velocity and flow direction can be calculated using Doppler equation; for correct velocity estimation, angle between incoming US signal and movement direction of reflecting particle (i.e. mostly erythrocytes) must be measured. (b) Doppler display: besides audio signal typically Doppler information displayed as flow graph after spectral analysis using Fourier transformation. All velocities throughout spectrum are displayed at any time (of cardiac circle), with intensity encoding number of reflectors at the individual velocity. Y-axis encodes flow velocity; x-axis encodes time
Frequency shift of received echoes can be measured; thus flow direction and flow velocity can be calculated and displayed in various ways (Fig. 1.5b – also see below in Chap. 1.8).
1.4 Artefacts
1.4.1 General Remarks
Artefacts caused by phenomena that interfere with image formation and cannot be sufficiently corrected:
Impair image (e.g. bowing artefacts, reflection artefacts).
Can also be diagnostically valuable (e.g. posterior enhancement/through transmission for identification of liquids, posterior shadowing for identification of calcifications).
Knowledge of artefacts essential for proper image interpretation.
1.4.2 Common Artefacts
1.4.2.1 Side Loop Artefact
Transducer does not only emit central beam but also side loops – can produce significant echoes when reflected by strong interfaces. Some of these echoes reflected into direction of central beam and received by transducer – these echoes appear projected into main beam, get used for image calculation, although deriving from structures out of main beam direction.
Only cause image impairment when encountering highly reflective surface; respective echoes are displayed as if arisen from central beam (wrong position), usually only recognisable when occurring in fluid-filled or low-echogenicity structure.
Typical example: adjacent bowel gas surface alters image of gall bladder mimicking sludge.
Can be identified by change of transducer position (e.g. tilt transducer).
Can usually be eliminated by repositioning transducer and reducing gain, altering angulation, etc.
1.4.2.2 Bowing Artefact
Arise by wrong projection of reflected echoes into anatomic incorrect position.
Caused by oblique reflections of beam – reflected echo received by “wrong” crystal, position wrongly assigned for further processing.
Can usually be eliminated and identified by tilting of transducer.
1.4.2.3 Noise
Definition: Signal-like monitor appearance throughout image is created by electronic processing and amplification. Background noise is increasingly amplified with reduced signal strength (e.g. TGC adaptation or high-receive gain). Near limits of penetration: differentiation between noise and real signals may become impossible.
Depending on gain settings, noise can also create artificial echoes within anechoic lesions such as fluid or cysts, making differentiation difficult or impossible – particularly when small.
For differentiation/identification: change focus position, output gain and transducer frequency.
1.4.2.4 Marginal Shadowing
Created by spherical structures with clear limit that exhibit significant acoustic impedance interval at its lateral borders – appears as line-like sound mitigation at lateral borders behind object.
Physical cause – tangential impact of sound beam, additional scattering and reflection at lateral wall – then transmitted into deeper image sections.
Helpful for identification of cysts and tubular structures but may be mistaken for acoustic shadowing from small concretions, e.g. in gall bladder or kidneys (Fig. 1.6).
Fig. 1.6
Artefact – marginal shadowing, reverberations. Artificial anechoic lines originating from margins of venous sinus in this axial liver view not corresponding to any specific anatomic or pathologic findings. Note echoic spots with reverberations within liver indicating intrahepatic air/gas
1.4.2.5 Posterior Enhancement – Increased Through Transmission
When sound passes through completely fluid-filled anechoic structure, intensity of US beam is not altered by absorption and reflection: causes different echo intensity of area deep to such fluid-filled structures compared to adjacent area of same depth where US beam has been more attenuated by intervening tissue.
TGC correction artificially adapts for intensity drop by depth – areas behind fluid displayed more echoic than surrounding structures.
Helpful to identify fluid/fluid-filled structures.
NOTE: In order to properly assess tissue behind large fluid-full structures, adaptation of TGC correction to account for this phenomenon is essential (Fig. 1.7).
Fig. 1.7
Artefact – through transmission. Artificially increased echogenicity behind fluid-filled bowel structure due to increased through transmission but deteriorating differentiation of respective structures (i.e. gastric dublication cyst)
1.4.2.6 Reverberation Artefact
Definition: Multiple reflections of sound travelling between two parallel layers with strong acoustic interfaces – create repeated parallel echogenic lines that usually get weaker with depth:
Typically observed parallel to transducer at superficial layers (e.g. skin).
Can be reduced by altering focus and decreasing (output) gain.
“Ring–down artefact” caused by resonance from gas; short ring-down artefacts called comet tail artefact – special form of reverberation phenomenon, usually appears behind gas/air-filled structures.
Created by scattering and reflection of incoming sound beam with irregular reflections and noise behind sonographically non-penetrable surface (Fig. 1.8).
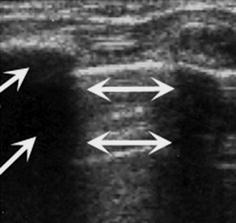
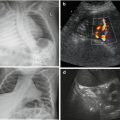
Fig. 1.8
Artefact – reverberation/comet tail artefact and dorsal shadowing. Chest wall US: echogenic reverberations caused by aerated lung surface (↔) and dorsal shadowing (→) caused by ossified rib
1.4.2.7 Increment or Slice Thickness/Beam Width Artefact
Sound beam dimensions vary depending on kind of transducer, frequency and focus settings. Depending on relation of beam width with distance between solid and liquid structures, particularly at curved interfaces, small layer of low-degree echoes may appear. May mimic second/hazy wall structure, can be mistaken for sludge within fluid. A sort of partial volume phenomenon.
Can usually be eliminated by optimising focus setting and changing transducer or frequency.
1.4.2.8 Mirror Image Artefact
Strong reflecting interface (mostly gas – i.e. air at lung base) met by sound beam in an angle around 45°– acts as acoustic mirror – artificial mirror images observed behind reflecting border due to prolonged travel duration of incoming signal (Fig. 1.9a).
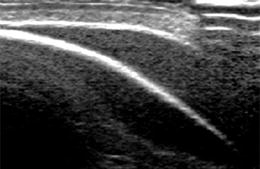
Fig. 1.9
Artefact – mirror image artefact. The echogenic border of skull bone causes mirroring of subcutaneous extracranial collection into subcalvarian intracranial compartment, mimicking a non-existing intracranial collection. NOTE: artifacts from malattachment of tranducer to bowed skin surface in upper right corner of image
Also encountered on colour Doppler sonography (CDS), may be quite confusing.
Can be identified by changing transducer position/tilting transducer.
1.4.2.9 Shadowing
If sound cannot penetrate and does not cause reverberations – area behind does not produce any echoes – i.e. it looks black like a shadow (Fig. 1.8).
Useful for identifying stones, bones and other calcified structures – hinders assessment of area behind.
1.4.2.10 Refraction Artefact
Occurs when sound passes obliquely through an interface between tissues with significantly varying sound speed – thus refraction occurs (mostly solid/fluid interfaces or border between low- and high-echogenicity tissues).
Can cause duplication artefacts (duplicating structures) – also affects length measurements (e.g. kidney).
Refractive shadowing (see above – marginal shadowing artefact) caused by defocusing and variations in beam energy or intensity at edge of fluid-filled structures.
Can usually be eliminated by changing transducer position.
1.4.2.11 Anisotropy
Occurs in tissues composed of very structured strong reflectors (e.g. fibrillar pattern) – echoes vary with insonation angle (typically with muscles and tendons).
Can usually be eliminated by changing transducer position/angulation.
Of utmost importance in muscular US – if unrecognised may lead to incorrect interpretation (i.e. tear, etc.).
1.5 Biologic Effects
1.5.1 General Remarks
Biologic effects of diagnostic US based on physical phenomena caused by interaction of emitted US with tissue depending on frequency, wave length and output energy.
Different devices may cause variable tissue impact with same application – because of different output gain settings/other device-specific presets.
1.5.2 Thermal Effects
1.5.2.1 Tissue Heating
Caused by energy absorption – amount of temperature rise depends on output energy and intensity of sound field. Increases with higher frequency by deposition of higher amounts of energy in smaller volume (less penetration).
Additionally, temperature-handling ability of tissue is important, e.g. vascularised and well-perfused tissue can better tolerate temperature changes than little or non-perfused tissue.
Human tissue with highest thermal absorption is bone; therefore experiences highest temperature rise with secondary biologic effects particularly on neighbouring tissue.
NOTE: some heat generated by transducer itself is also transmitted to skin/tissue
1.5.2.2 Biological Effects, Tissue Heating
Even on routine diagnostic scans using modern diagnostic US devices, measurable increase in temperature may occur; particularly important for fetal examinations and (trans)cranial US. However, temperature that causes degeneration of proteins (i.e. >45 °C) or potentially cell death (>41.5 °C) does usually not occur in diagnostic applications.
This effect must be considered when examining patients with high fever to avoid potential dangerous heat production; e.g. relatively short insonation of individual areas advisable. Commonly used parameter = thermal index (TI). Three different types of TI defined depending on tissue examined: TIS – small part, TIB – bone, TIC – cranial (see below):
General rule of thumb: TI never >3, TIC <1.7, in neonatal brain TIC <1 (or better <0.7) advisable.
1.5.3 Mechanical Effects and Resonance
Resonance of molecules proportional to applied frequency depends on output energy, separate from mechanical impact on tissue by sound pressure.
In order to maintain safety, diagnostic US devices initially did not allow energies >100 mW/cm2. According to newer experimental observations, intensity measure changed – at present sound pressure levels considered more important:
Relative upper limit of negative peak pressure is defined by 1 mPa; no relevant mechanical and resonance-induced tissue damage should occur below this level.
(Sound)Pressure waves have positive and negative partition; the latter is called suction force. This negative pressure causes a sort of vacuum – has highest potential for tissue damage by implosion or cavitation.
Danger/risk of mechanic effects estimated by mechanical index (MI): in general MI should be kept below 1.7; in more risky areas <1; in very sensitive areas <0.7: (e.g. neonatal brain) and for low-MI contrast-enhanced US (ce-US) MI around 0.1–0.3 (see below).
1.5.3.1 Cavitation
Acoustic Cavitation
Sound-induced occurrence of hollow areas as well as gas bubbles in insonated material – may undulate and change size. These small cavities and their activity cause wide spectrum of physical, chemical and biological effects.
Negative Peak Pressure
Crucial parameter for estimation of cavitation effect: negative peak pressure within insonation field. Additionally need cavitation seed – usually microscopic gas bubbles that explosively increase in size during negative sound pressure.
NOTE: Cavitation effects are independent from thermal effects; e.g. US impulse with high pressure and low frame rate can cause cavitation without any significant thermal changes.
In human tissue, inert cavitation is no major problem – practically no cavitation seeds, except for tissue containing air or gas such as lung or intestines. However, if US contrast media (based on stabilised microbubbles) used, cavitation effects may become relevant, as for US of target adjacent to aerated structures:
When respecting given limits/application guidelines, no clinical relevant damage by diagnostic US (even using US contrast media) is currently reported.
1.5.4 Potential Risks of Diagnostic US
Significant effects can be produced by US on all kinds of tissues. This potential is used therapeutically (e.g. lithotripsy, sonophoresis and treatment of tendinous calcifications).
Diagnostic US uses much lower energy levels than therapeutic US, though – using maximum output gain and long sound exposure on single site – biological effects can be demonstrated in animal experiments (cavitation, mechanic and thermal effects added, duration of exposure essential).
With prudent use, no significant impact in human medical diagnostic use in terms of carcinogenesis, teratogenesis or higher mutation rates found.
1.5.4.1 Specific Risks
Long duration of pulsed duplex-Doppler and amplitude-coded CDS (aCDS) investigations with stationary US beam, particularly in vicinity to bone (for these applications higher sound energy with focused focal pulse is usually used); i.e. transcranial US, echocardiography – particularly in border areas with vicinity to aerated lung:
M-Mode: slightly higher-output energies used for depicting clear M-Mode signal.
NOTE: Try to avoid focused pulsed duplex Doppler and M-Mode for fetal echocardiography (risk-benefit ratio to be considered).
1.5.4.2 Guidelines and Recommendations
In order to maintain biologic sound-induced risks as low as possible, some aspects need to be considered:
1.
Diagnostic US – medical imaging; there should be clear indications on firm medical grounds for every investigation (with some exceptions for scientific and educational needs).
2.
Always try to minimise output gain by using maximum receive gain.
3.
Keep exposure times of specific area as short as possible; make use of frozen images for analysis instead of looking at same structure for long times under real-time US conditions (unless you need dynamic-functional observation).
4.
Always first optimise image, particularly for Doppler investigations: only activate your colour box or PW-duplex gate after area of interest has been defined, measurement point/gate has been adjusted, angle correction has been defined, etc.
5.
Try to avoid cavitation seeds or bones in vicinity of duplex-Doppler beam.
6.
Further recommendations can be found in literature and with various US societies (e.g. EFSUMB; AIUM; OEGUM/DEGUM).
1.5.5 Various Methods and Indices That Allow Estimation of Biological Risks
1.5.5.1 Mechanical Index (MI)
Introduced to describe peak pressure in tissue (in mPa); depends on output gain. The used frequency and focus pre-describe potential risk of sound pressure-induced tissue damage as well as cavitation risk.
Mostly used in B-Mode sonography and should be kept below 1; short increases (if diagnostically necessary) up to 1.5 mPa acceptable in individual situations.
NOTE: MI should be lower for fetal exams, for examination of the neonatal brain (transfontanellar), for eye US and for ce-US to avoid damage of specifically sensitive structures or to minimise danger in t presence of cavitation seeds (see also above).
1.5.5.2 Thermal Index (TI)
Describes risk of tissue heating with consecutive tissue damage:
1.
TIS (soft tissue thermal index) – used for soft tissue.
2.
TIB (bone thermal index) – used for bone.
3.
TIC (cranial thermal index) – used for transcranial applications.
Mainly depends on tissue, output gain, focal zone and frequency used.
TI – most important in Doppler sonography as well as for fetal US. TI should be kept below 1 – brief increase accepted if diagnostically necessary in individual examinations (e.g. Doppler sonography usually works with higher TI values).
1.5.5.3 Display of Actual Indices
Indices must be displayed by equipment throughout investigation and constantly updated depending on individually altered settings (gain, focus zone, frequency, etc.); should also be documented on saved images.
1.6 How to Perform Paediatric US
1.6.1 Requisites
1.6.1.1 Indications
Every investigation must rely on thorough indication. Referring physician has to provide detailed question; US investigation must potentially offer diagnostically relevant result with therapeutic or prognostic consequence.
Only exceptions:
Screening investigations (e.g. urinary tract and hip) – should have significant preventive effects:
Increasingly under discussion, with widespread fetal US and new knowledge on impact of screening approaches in last decade.
For scientific or educational purpose.
1.6.1.2 Environmental Requisites
Proper and comfortable positioning facilities.
Quiet room with sufficient light dimming.
Proper and ergonomic positioning of investigator.
Ergonomic styling of surrounding working area – includes separate reading facility with monitors and separate sitting area for consultation with patients and parents.
NOTE: Sufficient chairs must be available, as there are usually more people than just the patient.
Proper room temperature with additional heating available for neonates and infants.
Even with children, privacy must be respected; therefore proper changing rooms and towels mandatory, furthermore cleaning facilities, and adjacent restroom desirable.
1.6.1.3 Specific Needs in Children
Usually accompanying persons are present during investigation and for consultation afterwards – rooms must be adequately sized and equipped.
Accompanying parents and brothers or sisters can help pacify infant during investigation, additionally monitors for displaying either US image or movies and toys are helpful. Other pacifying measures: books, music.
Warm US gel, but prevent bacterial and fungal growth in gel bottle.
Initial introductory comment understandable to child and accompanying persons is helpful – enables them to understand investigation, what is going to happen and to reduce fears. Explain equipment as well as procedure.
Effort of establishing good relation prior to starting investigation – often essential to enable peaceful and diagnostically valuable investigation.
NOTE: Empathetic action is important! Try to avoid strong and abrupt transducer pressure as well as fast movements. Sometimes also helpful to keep skin contact with hand/finger that holds transducer.
1.6.1.4 Specific Needs in Infants and Newborns
Higher room temperature, additional heating and swaddling facilities are mandatory.
Helpful to have some warm tea/formula and pacifiers ready at hand:
Pacifiers can furthermore be enhanced by specific tastes such as glucose and fruit extracts.
1.6.2 Positioning
Abdominal US: usually lying supine, sometimes prone or lateral decubitus position is helpful. Some abdominal areas can also be investigated with baby lying in arms of mother – e.g. urinary tract screening in anxious and excited infants, provided acceptable position for the investigator is granted, too.
Urinary tract US: same as abdominal US standard; additional prone positioning for examining kidneys from dorsal approach is advisable. Additional approach: perineal US.
US of neonatal brain/transtemporal US: any position where head can be kept still and stable with sufficient acoustic access for US probe; for posterior fossa investigation, transoccipital or transnuchal access in lateral decubitus position with flexed cervical spine is helpful.
US of neonatal spine and spinal canal: prone or lateral decubitus – try to avoid hyperextended back to assure sufficient access to spinal canal.
Echocardiography: usually supine position with slight lateral rotation; additional pillows underneath back may be helpful. For suprasternal access, neck extension with some support of shoulder and side turning of head is helpful – provided the baby can tolerate positioning.
Hip US: standardised procedure with standardised positioning partially using dedicated positioning devices; depends on technique applied (see Chap. 11).
Small-part and neck US: sometimes helpful to comfortably position targeted area by help of supporting pillows and towels (see Chap. 4).
NOTE: In adults and bigger children, positioning manoeuvres or breath holding and flexion or rotation is routinely used to optimise US window for proper access to diagnostically relevant deeper regions. In children, particularly infants and neonates, this is practically impossible, therefore “golden rule for US in infants”: do not move child towards transducer trying to depict pathology, but try to move transducer to sonographic window that allows optimal access to targeted areas.
Related posts:
Stay updated, free articles. Join our Telegram channel

Full access? Get Clinical Tree


