11
Therapy Response
Eugene C. Lin and Abass Alavi
This is a general overview of positron emission tomography (PET) for therapy response. Information about the role of PET in relation to specific tumors is found in the following chapters.
Therapy response imaging can be divided into two categories: early and late prediction.
- Early prediction. The goal of imaging is to predict response early during therapy. In this case, the cancer should be one in which viable alternative therapies are available if the first-line therapy is ineffective. If there is a lack of response, the initial therapy can be changed early during the course of therapy. PET is particularly valuable, as an early response to therapy often does not result in change on conventional imaging modalities.
- Late prediction. The goals of imaging are to evaluate response after the completion of therapy and to predict future outcome. PET is particularly valuable, as conventional imaging techniques are often not able to differentiate tumor from scar tissue.
- Definition of response
- There are no accepted general criteria for defining response that are applicable to all tumors. Proposed general criteria are1
- Progressive metabolic disease: > 25% increase in standardized uptake value (SUV), or new lesions
- Stable metabolic disease: between < 25% SUV increase and < 15% SUV decrease
- Partial metabolic response: 15 to 25% SUV decrease after one cycle of chemotherapy, or > 25% SUV decrease after more than one treatment cycle
- Complete metabolic response: complete resolution of fluorodeoxyglucose (FDG) uptake. This is usually associated with a good prognosis, even though microscopic disease cannot be excluded.
- However, the definition of response may be specific to the particular tumor and the specific point in therapy. Published thresholds (amount of decrease in activity) to define response are usually specific to particular tumors, time intervals, and treatment methods. These are likely applicable only in those scenarios. If published thresholds are used, the method of SUV determination used and the time intervals of imaging after therapy should be duplicated as closely as possible.
- What is a significant change in SUV?
- The mean difference in serial SUV measurements is around 10%.2–4
- For most lesions, changes in SUV > 20% are outside the 95% range for spontaneous fluctuation and can be considered to reflect true changes in glucose metabolism.3
- However, the range of spontaneous fluctuation depends upon the initial SUV. The higher the SUV, the less the range of fluctuation.3
- In practice, report SUV differences of 20 to 25% as significant unless the initial SUV is very high, in which case report 10 to 15% changes as significant.
- Measurement of response.5 SUV measurements are feasible for the measurement of tumor response in the majority of cases and are the easiest method to implement in a busy clinical practice.
- Discussion of tracer kinetic approaches is beyond the scope of this chapter. However, patients with diabetes mellitus in particular may benefit from tracer kinetic approaches, as clearance and distribution of FDG may be altered.
- It is very important to standardize the imaging protocol in patients being followed for therapy response. Patients should ideally be scanned at the same institution on the same equipment. SUV values between institutions and between PET and PET/computed tomography (CT) may be poorly reproducible.
- Midtreatment versus posttreatment results.6 A given treatment dose of radiation or chemotherapy will typically kill the same fraction rather than the same number of cells, regardless of the size of the tumor. Therefore, small tumors may still require multiple cycles of therapy to cure. This has implications for the interpretation of PET results in therapy response. As the resolution of PET is limited for small tumor volumes, PET can likely detect only the first few log units (90% reduction in tumor mass) of tumor cell killing. Thus, a tumor that is PET negative after therapy may still require multiple cycles of therapy to eliminate. Midtreatment and posttreatment PET results often have different implications.
- Midtreatment. Midtreatment PET scans provide information on the rate of tumor cell killing. A negative PET scan after a few cycles of therapy implies that the rate of tumor cell killing is sufficient to produce cure if the therapy is completed. Although the negative PET scan could be seen with a few or many log units of tumor cell killing, even a few log units of response early in the therapy cycle implies a rapid rate of response. A positive PET scan implies that the rate of tumor cell killing may be inadequate to produce cure if the entire cycle is completed.
- Posttreatment. A positive PET scan after completion of therapy usually indicates a slow rate of tumor cell killing and a resistant cancer, as many cycles of therapy have not resulted in even a few log units of tumor cell killing. However, a negative posttreatment PET scan could have two possible implications. Due to limited resolution, a negative posttreatment PET scan cannot differentiate between a few log units and many log units of tumor cell killing (i.e., between minimal residual disease and complete response). Thus, a negative posttreatment PET scan typically has a lower predictive value than a negative midtreatment scan.
- High sensitivity is usually preferred to specificity in the posttherapy setting, as false-negative results are usually less desirable than false-positive results.
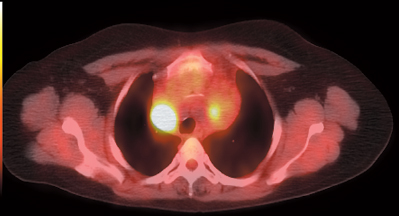
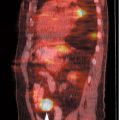
- Variable response in different lesions in the same patient (Fig. 11.1) indicates tumor heterogeneity, which may contribute to tumor treatment resistance.
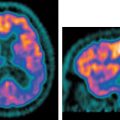
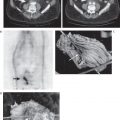
- However, if there is a lack of response in one region and response in all other regions, a nonneoplastic etiology in the nonresponding region should be considered (Fig. 11.2).
- Normal tissue response. Increased inflammatory uptake in normal tissue postradiation positively correlates with tumor response. Normal tissue radiosensitivity may correlate with tumor radiosensitivity.7

