Chapter 1 Thoracic Radiology
Imaging Methods, Radiographic Signs, and Diagnosis of Chest Disease
EXAMINATION TECHNIQUES AND INDICATIONS
Chest Radiography
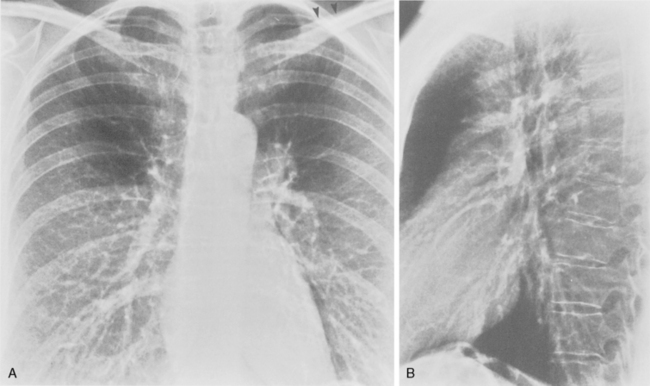
The target film distance is 6 feet. Chest radiographs should be exposed using a high kilovoltage peak (kvp) technique, usually in the range of 100 to 140 kvp (Fig. 1-1). With this technique, a grid or air gap is required to reduce scatter radiation. The main advantage of this technique is that the bony structures appear less dense, permitting better visualization of the underlying parenchyma and the mediastinum. The only drawbacks are the decreased detectability of calcified lesions and loss of bony detail.
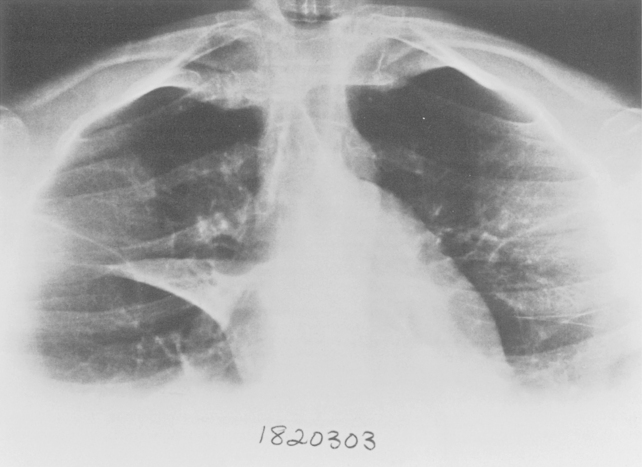
Additional views of the chest may be required in special instances (Table 1-1). Shallow oblique radiographs (15 degrees) may be useful in confirming the presence of a suspected nodule. Forty-five-degree oblique radiographs are recommended for the detection of asbestos-related pleural plaques. Apical lordotic views (Fig. 1-2) project the clavicles above the chest, improving visualization of the apices and the middle lobe, particularly in cases of middle lobe atelectasis. Expiration chest radiographs can be used to detect air trapping or to confirm small pneumothoraces. Lateral decubitus radiographs are commonly used to determine the presence or mobility of pleural effusion. These views can also be obtained to detect small pneumothoraces, particularly in patients who are confined to bed and unable to sit or stand erect. Bedside portable examinations may account for up to 50% of chest radiographs obtained for hospital patients.
Table 1-1 Indications for Nonstandard Chest Radiography
| Projection | Indications |
|---|---|
| Oblique | |
| Lordotic | Apical and middle lobe disease |
| Expiration | |
| Lateral decubitus |
Fluoroscopy
Fluoroscopy has become rather obsolete with the widespread application of computed tomography (CT) (Table 1-2). Fluoroscopy is mainly restricted to the evaluation of diaphragmatic motion. The patient is placed in an oblique position so that both hemidiaphragms can be visualized simultaneously. In patients with diaphragmatic paralysis, the affected hemidiaphragm moves up during a rapid inspiratory maneuver (e.g., a sniff).
Table 1-2 Indications for Chest Fluoroscopy
| Technique | Indications |
|---|---|
| Fluoroscopy | Diaphragmatic movement |
| Major airways, trachea |
Computed Tomography
Computed tomography typically is used as a diagnostic study, usually after a standard chest radiograph is obtained or when the chest radiograph result is considered to be abnormal (Box 1-1). Indications for CT include staging of lung carcinoma; a solitary pulmonary nodule, mass, or opacity; diffuse infiltrative lung disease; widened mediastinum, a mediastinal mass, or other abnormality of the mediastinum; an abnormal hilum; pleural abnormalities or the need to differentiate pleural from parenchymal abnormalities; chest wall lesions; trauma; and diagnosis of pulmonary embolism. CT may also be used for the detection of occult disease. Indications include detection of metastatic disease in tumors with a propensity for metastases to the lungs; hemoptysis or suspected bronchiectasis; evaluation of the thymus in patients who have myasthenia gravis; evaluation of patients with endocrine abnormalities that are associated with a suspected lung tumor or parathyroid adenoma; search for an unknown source of infection, especially in the immunocompromised population; evaluation of the pulmonary parenchyma in patients with normal chest radiographs and suspected diffuse infiltrative lung disease or emphysema; and suspicion of aortic dissection and other vascular abnormalities.
Box 1-1 Common Indications for Computed Tomography
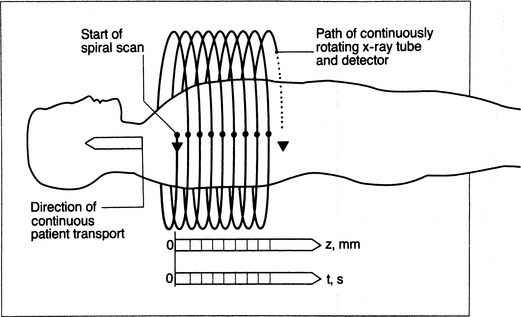
Improvement in scanner technology has led to the introduction of spiral or helical volumetric CT (Box 1-2). These CT scanners acquire data continuously and as the patient is transported through the scanner during a single breath hold (Fig. 1-3). Multidetector helical CT (MDCT) revolutionized thoracic imaging by providing near-isocubic volumetric scanning. Initial multidetector imaging involved four slice detectors that are still popular today. However, this technology has expanded to 16- and 64-slice detectors as well as dual source scanners allowing even shorter scan times. With the newer technology, a patient’s entire thorax is scanned in less than 10 seconds. MDCT slice acquisition provides a thinner slice thickness of an entire original dataset, with the elimination of interscan gaps and minimal respiratory motion. Capabilities include multiplanar imaging with little or no stair-stepping artifact on coronal, sagittal, and three-dimensional images. The greatest impact of MDCT in imaging the thorax involves reconstruction of the vasculature system and airways, and it provides comprehensive imaging of trauma patients (Fig. 1-4). Pulmonary embolism studies are obtained in shorter imaging sessions, improving on motion artifact and resolution of smaller subsegmental vessels.
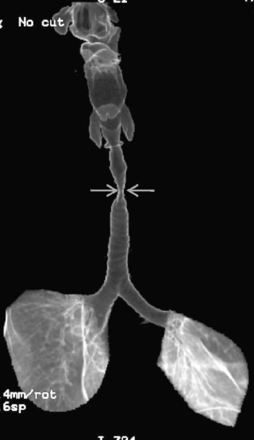
Figure 1-3 Helical CT scan principle.
(From Kalender WA, Seissler W, Klotz E, Vock P: Spiral volumetric CT with single-breath-hold technique, continuous transport, and continuous scanner rotation. Radiology 176:181–183, 1990).
Positron Emission Tomography
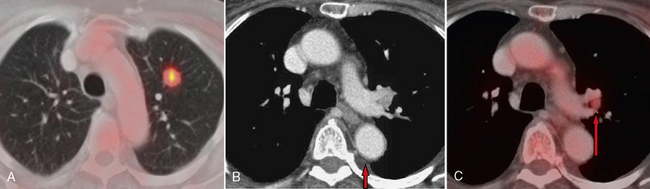
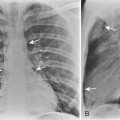
The implementation of FDG-PET has significantly improved the radiologic staging of lung cancer (Fig. 1-5). The characterization of lymph node disease by CT is limited by the use of size criteria to detect abnormal nodes. Lymph nodes are interpreted as abnormal if their short-axis diameter exceeds 1 cm. Because of reliance on size criteria, enlarged lymph nodes due to inflammatory or infectious disease are frequently misinterpreted as neoplastic. Early metastases in small nodes are not detected by CT. FDG-PET improves the specificity of lymph node disease detection by better identifying tumor involvement based on increased metabolic activity rather than anatomic enlargement. However, PET also has limitations when it comes to lymph node size. Detection of metastatic foci may also be limited by PET because of camera resolution. Lymph nodes with metastases that measure 5 mm in diameter or less may go undetected. False-positive results can be obtained in cases of granulomatous disease or silicosis. In the staging of lung cancer, mediastinoscopy should be performed on any patient with positive lymph nodes on FDG-PET to avoid erroneously overstaging a patient who has “hot” reactive nodes.
Magnetic Resonance Imaging
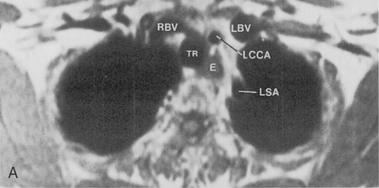
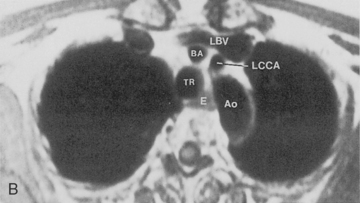
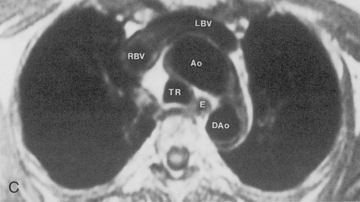
Magnetic resonance imaging (MRI) has not had extensive application in imaging the thorax, mainly because of problems due to motion artifacts caused by cardiac and respiratory movements. The normal lung does not produce an MR signal because of magnetic susceptibility effects. However, MRI does provide excellent images of the mediastinum and the chest wall, and it does permit direct imaging in the coronal, sagittal, and axial planes. General indications for MRI in the chest include evaluation of the mediastinum or vascular structures in patients in whom contrast media is contraindicated; diagnosis of aortic dissection and congenital abnormalities of the aorta; evaluation of superior sulcus tumors; imaging of chest wall lesions and brachial plexus abnormalities; staging of lung carcinoma with particular reference to direct chest wall and mediastinal invasion; and evaluation of posterior mediastinal masses (Box 1-3).
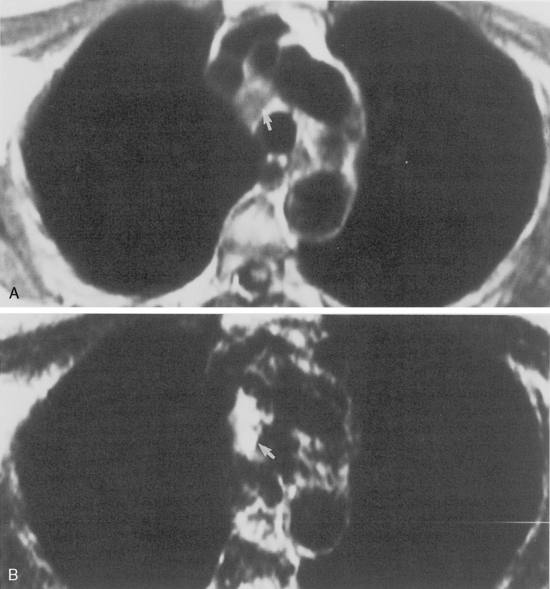
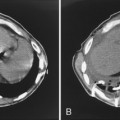
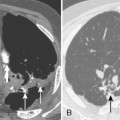
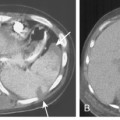
Some general recommendations can be made in regard to technique. Techniques can be varied according to the clinical indication. Typically, a body coil is used, and images are obtained in the axial plane using two different spin-echo sequences. With high field-strength magnets, electrocardiographic (ECG) gating should be employed. T1-weighted, multislice, single-echo (i.e., echo time [TE] values of 15 to 30 msec) sequences are always obtained, and a T2-weighted sequence with two echoes (i.e., TE of 60 to 100 msec) is obtained in most instances. T1-weighted images give information concerning diagnosis of masses and provide the best information about vascular anatomy. The T2-weighted images may render fluid collections distinguishable from solid masses and may help separate tumor from fibrosis (Fig. 1-6). Gadolinium contrast administration is often helpful in distinguishing benign from malignant conditions.
ANATOMY
Airways
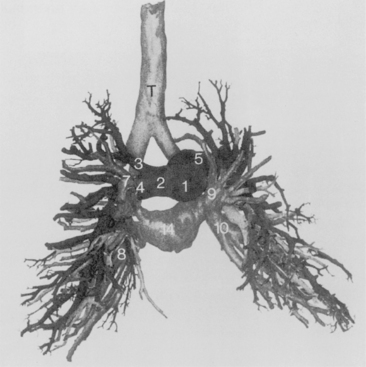
Trachea and Main Bronchi
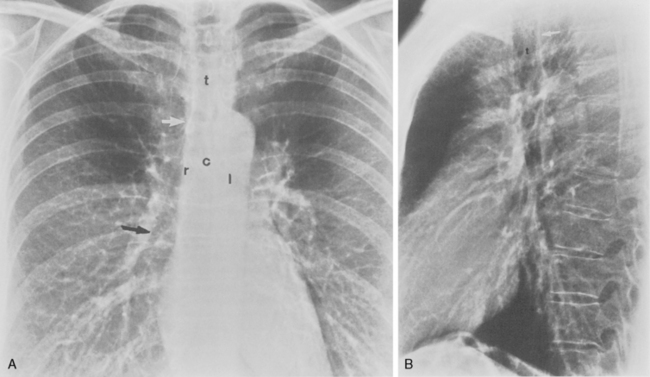
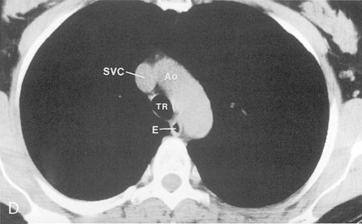
The trachea is a midline structure that usually is 6 to 9 cm long. The wall contains horseshoe-shaped cartilage rings at regular intervals, but the posterior wall is membranous. The upper limits for coronal and sagittal diameters are 25 and 27 mm for men and 21 and 23 mm for women. The lower limit of normal in both dimensions is 13 mm in men and 10 mm in women. The trachea divides into two major bronchi at the carina. The carinal angle usually is about 60 degrees, but a wide range of 40 to 75 degrees can be seen in normal adults. The right main bronchus has a more vertical course than the left, and its length is considerably shorter. The air columns of the trachea, both major bronchi, and the intermediate bronchus are usually visible on well-exposed standard radiographs of the chest in the frontal projection (Figs. 1-7 and 1-8). The right lateral and posterior walls of the trachea are identifiable on posteroanterior and lateral chest radiographs as vertically oriented linear opacities, called the right paratracheal and posterior tracheal stripes. They are described in more detail in the “Mediastinum” section.
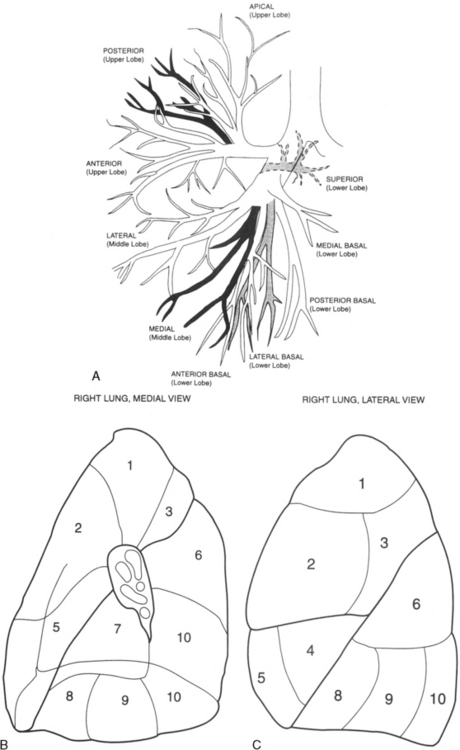
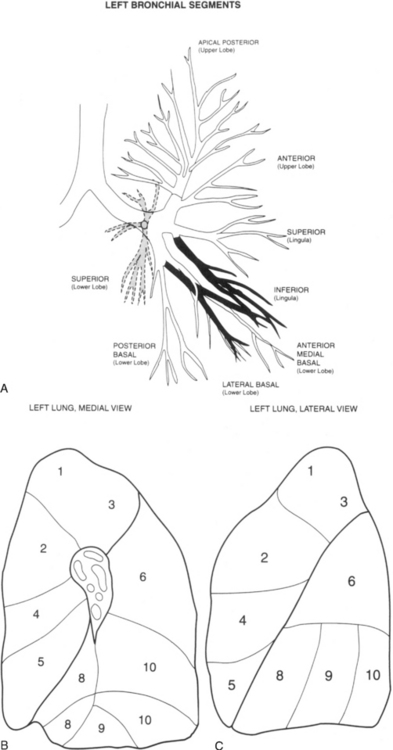
Lobar Bronchi and Bronchopulmonary Segments
Table 1-3 summarizes the bronchopulmonary segments of the right and left lung.
Table 1-3 Bronchopulmonary Segments
| Right Lung Segments | Left Lung Segments |
|---|---|
| Upper Lobe | Upper Lobe |
| 1. Apical | 1 and 2. Apical posterior |
| 2. Anterior | 3. Anterior |
| 3. Posterior | 4. Superior lingula |
| Middle Lobe | 5. Inferior lingula |
| 4. Lateral | Lower Lobe |
| 5. Medial | 6. Superior |
| Lower Lobe | 7 and 8. Anteromedial basal |
| 6. Superior | 9. Lateral basal |
| 7. Medial basal | 10. Posterior basal |
| 8. Anterior basal | |
| 9. Lateral basal | |
| 10. Posterior basal |
Right Side
The bronchus to the right upper lobe (Fig. 1-9) arises from the lateral aspect of the mainstem bronchus, approximately 2.5 cm from the carina. It then divides into three branches—the anterior, posterior, and apical—each supplying a segment of the right upper lobe. The intermediate bronchus continues distally for 3 to 4 cm from the takeoff of the right upper lobe bronchus and bifurcates to become the bronchi to the middle and lower lobes. The middle lobe bronchus arises from the anterolateral wall of the intermediate bronchus almost opposite the origin of the superior segmental bronchus of the lower lobe. It then bifurcates into lateral and medial segments.
Left Side
The left upper lobe bronchus (Fig. 1-10) arises from the left main bronchus and then bifurcates or trifurcates. The upper division is the main left upper lobe bronchus and the lower division is the lingular bronchus. The upper division almost immediately divides into two segmental branches, the apical posterior and anterior. The lingular bronchus is analogous to the middle lobe bronchus of the right lung. The lingular bronchus then bifurcates into superior and inferior divisions or segments.
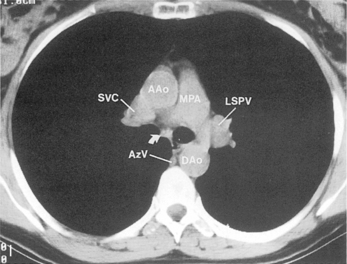
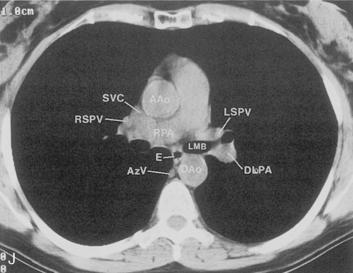
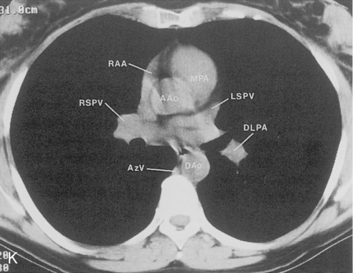
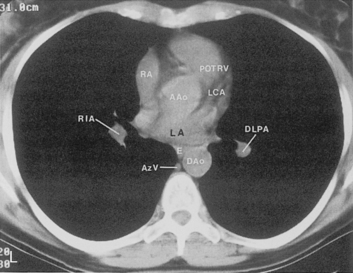
Pulmonary Vessels
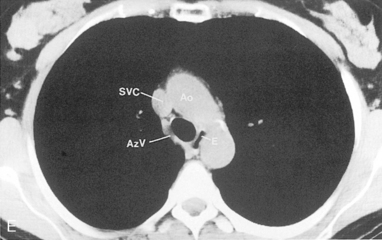
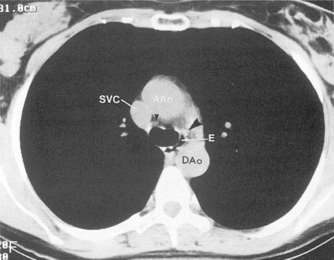
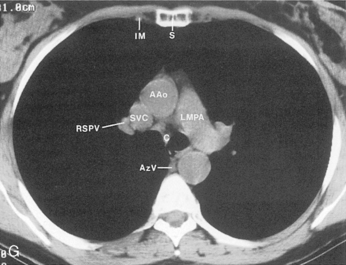
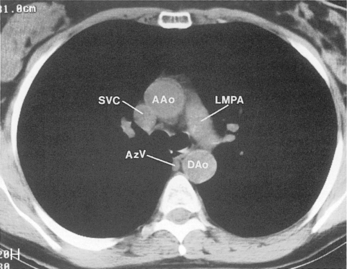
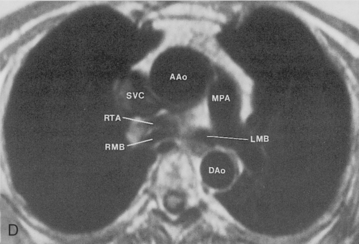
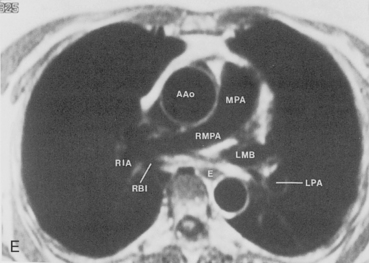
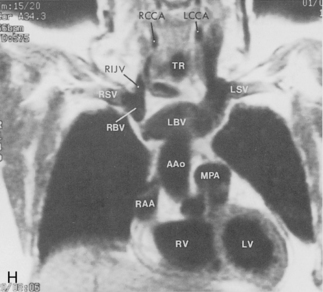
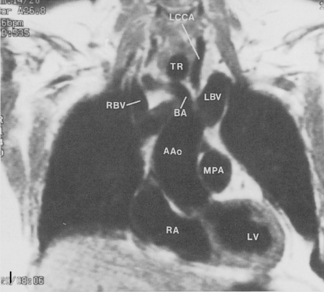
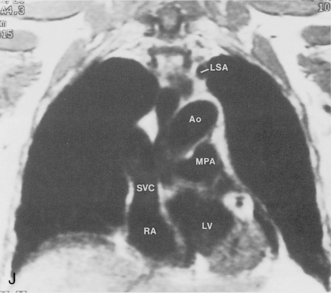
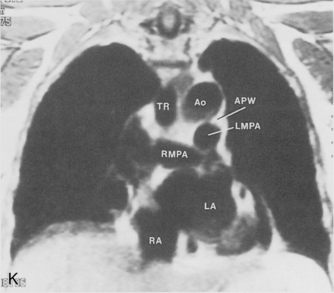
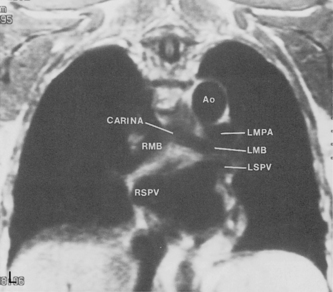
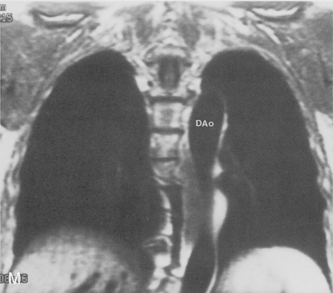
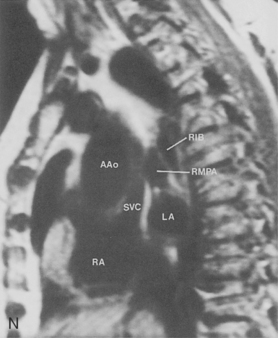
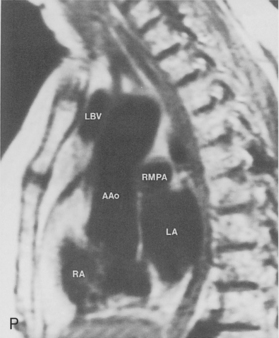
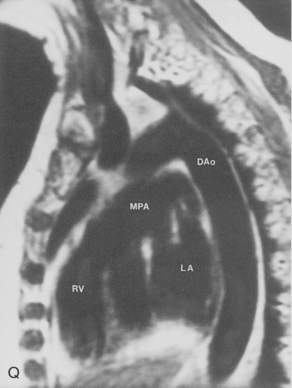
The main pulmonary artery originates in the mediastinum at the pulmonic valve and passes upward, backward, and to the left before bifurcating within the pericardium into the short left and long right pulmonary arteries (Figs. 1-11 and 1-12). The right pulmonary artery courses to the right behind the ascending aorta before dividing behind the superior vena cava and in front of the right main bronchus into a right upper branch (i.e., truncus anterior) and the descending or interlobar branch. The interlobar artery subsequently divides into segmental arteries to the right middle and right lower lobes. The higher left pulmonary artery passes over the left main bronchus. It may give off a separate branch to the left upper lobe or, more commonly, continues directly into a vertical left interlobar or descending pulmonary artery from which the segmental arteries to the left upper and lower lobes arise directly. The left descending or interlobar artery lies posterior to the lower lobe bronchus.
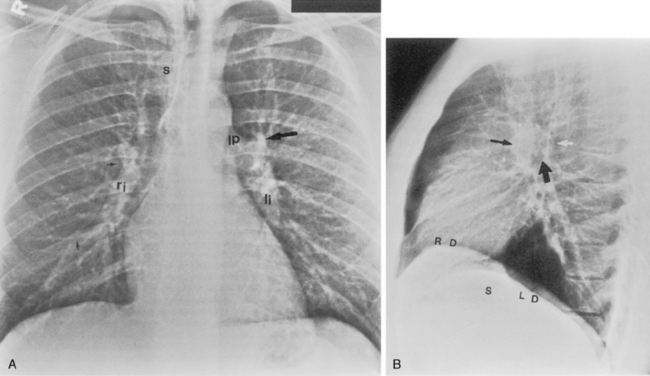
Pulmonary Hila
Standard Posteroanterior and Lateral Chest Radiography
The hila can be conveniently divided into upper and lower zones, and specific anatomic structures can be identified in each area (see Fig. 1-12). The upper part of the right hilum consists of the right superior pulmonary vein and the truncus anterior branch of the right pulmonary artery. A short segment of the upper lobe bronchus and the end-on anterior segmental artery and bronchus can often be identified. The lower portion of the right hilum is formed by the interlobar artery, which descends in a vertical manner and lies lateral to the intermediate bronchus. The horizontally oriented inferior pulmonary vein lies posteroinferior to the hilum. On the left side, the upper part of the left hilum is formed by the distal left pulmonary artery and the left superior pulmonary vein. The proximal left pulmonary artery is almost always higher than the highest point of the right interlobar artery, with the left hilum therefore being higher than the right. The lower portion of the left hilum is formed by the distal interlobar or descending artery and more caudally by the left inferior pulmonary vein. The air columns of the lingular and left lower lobe bronchus may be identified.
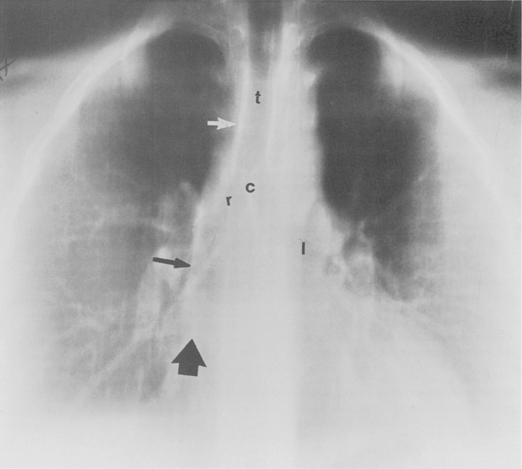
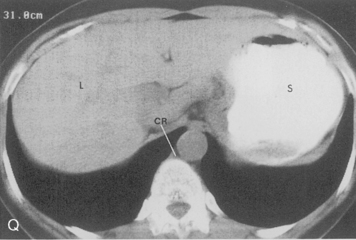
Occasionally, the venous confluences may be extremely prominent and produce vascular pseudotumors. This is particularly common in the right retrocardiac area when the inferior right venous confluence is prominent (see Fig. 1-8).
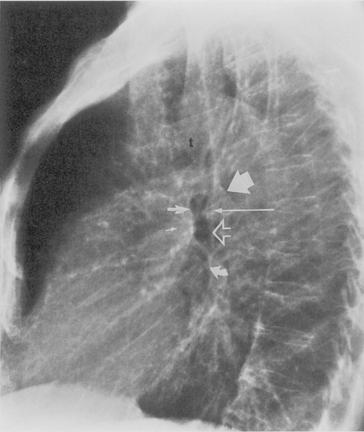
Understanding hilar anatomy on the lateral projection is critical (Fig. 1-13). The tracheal air column is always clearly visible and ends caudally in a rounded radiolucency that represents the distal mainstem or proximal left upper lobe bronchus seen end on. The right pulmonary artery is projected as a circular opacity anterior to this bronchus. The left pulmonary artery is tubular in configuration and arches over the left mainstem or left upper lobe bronchus. The right upper lobe bronchus can be identified approximately 1 cm above the left upper lobe bronchus. Between the right and left upper lobe bronchi, which are seen end on, is a thin, vertical, white line representing the posterior wall of the bronchus intermedius that courses inferiorly. It separates the lumen of the bronchus intermedius from the aerated right lung and the azygoesophageal recess posteriorly. The area beneath the left mainstem bronchus is sometimes referred to as the inferior hilar window. It should be clear and radiolucent. An opacity, particularly a rounded opacity, in this area suggests the presence of hilar or subcarinal adenopathy. Abnormalities of the hilum on standard radiographs may be increased opacity or changes in size, shape, or lobulation.
Computed Tomography
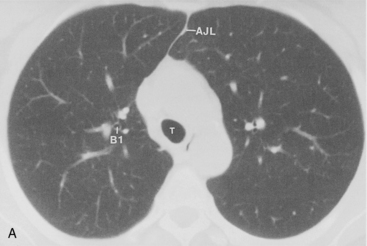
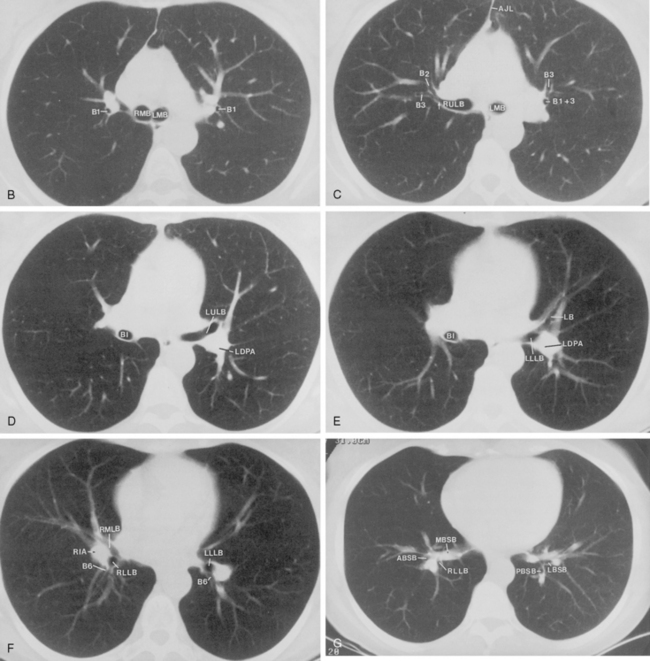
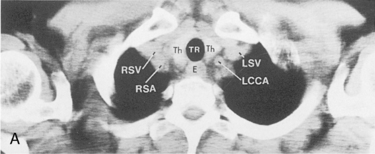
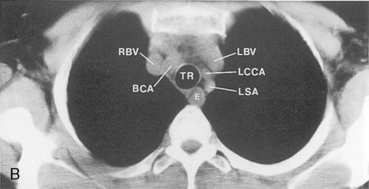
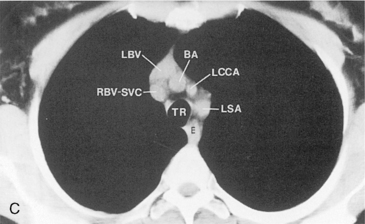
The pulmonary hila are probably best evaluated with CT. They can be visualized with or without the use of intravenous contrast medium. However, dense opacification of the pulmonary or the hilar vessels simplifies interpretation. The bronchial tree is best assessed at wide windows (i.e., 1500 to 2000 Hounsfield units [HU]). Visualization of hilar structures is also improved by thin (2-3 mm) sections. The anatomy of the hila is illustrated in Figure 1-14, and mediastinal anatomy is shown later (see Figs. 1-23 and 1-24).

Pulmonary Parenchyma
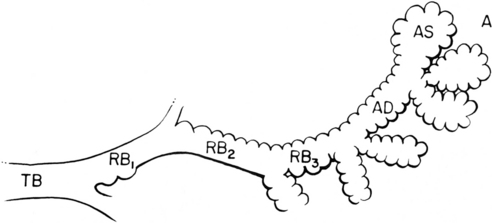
Pulmonary Acinus
The pulmonary acinus is often considered an anatomic and functional unit of the lung parenchyma (Fig. 1-15). It refers to the gas-exchanging unit of the lung and is defined as that portion of the lung distal to the terminal bronchiole (i.e., the last purely conducting airway), which is composed of the respiratory bronchioles, alveolar ducts, alveolar sacs, and alveoli. There has been considerable debate about whether the acinus is radiologically visible. Experimentally, the acinus can be filled with bronchographic contrast medium, and the radiographic opacities that are produced are nodular opacities with a rosette appearance and a diameter of approximately 6 to 10 mm. However, it is debatable whether such “acinar shadows” can be identified with confidence in disease processes creating opacification in the lungs in living patients.
Secondary Lobule
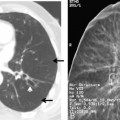
The secondary lobule is defined as the smallest discrete portion of the lung that is surrounded by connective tissue septa (Fig. 1-16). It is composed of three to five terminal bronchioles with their accompanying airways and parenchyma. The shape is usually polyhedral, and it usually is 1 to 2.5 cm in diameter. The secondary lobule has been recognized by some investigators as the radiographically visible basic structural unit of the lung. It is certainly the unit of the lung that is readily identified on HRCT. However, the distribution of lobules is not uniform throughout the lung, and the septa are better developed and more numerous in the lateral and anterior surfaces of the lower lobes. The secondary pulmonary lobule consists of core structures, which are the bronchus and accompanying pulmonary artery, and peripheral structures within the interlobular septa, which are the pulmonary veins and lymphatics.
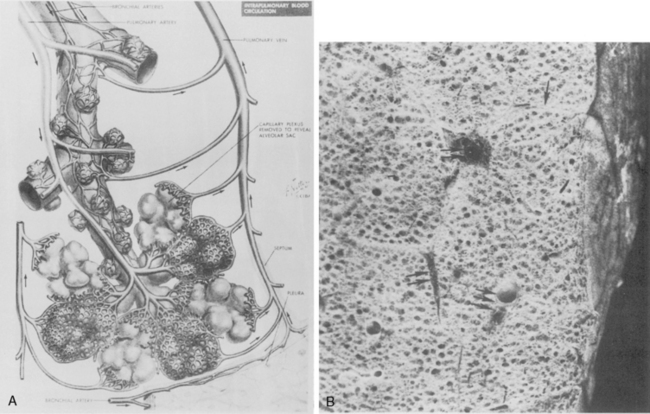
In diffuse infiltrative (interstitial) lung diseases (see Chapter 7), the lobular architecture can often be readily identified on HRCT, and the relationship of the disease process to the center or the periphery of the lobule may be helpful in the diagnosis. However, lobular architecture is impossible to appreciate on standard chest radiographs.
Pleura
Interlobar Fissures
Between the lobes, contiguous layers of visceral pleura, called the interlobar fissures, separate individual lobes and can be visualized on standard chest radiographs (Fig. 1-17) and on CT. The fissures may or may not be complete, and incomplete fissures allow collateral air drift or spread of disease from one lobe to the other. The major or oblique fissures separate the upper and, on the right, the middle lobe from the lower lobes. They extend from about the level of the fifth thoracic vertebra obliquely downward and forward, roughly paralleling the sixth rib to the diaphragm a few centimeters behind the anterior costophrenic angle. The minor or horizontal fissure separates the anterior segment of the right upper lobe from the middle lobe and lies in a horizontal plane at about the level of the fourth rib anteriorly. On a lateral chest radiograph, the posterior extent of the minor fissure is sometimes projected behind the hilum and the right major fissure due to the undulating course of the fissures. The position of the interlobar fissures is critical in the diagnosis of pulmonary volume changes such as lobar collapse. It is uncommon to see the normal major fissure on a frontal projection, and if it is visualized, it usually indicates thickening or fluid within the fissure or an abnormal position of the fissure due to volume loss and atelectasis.
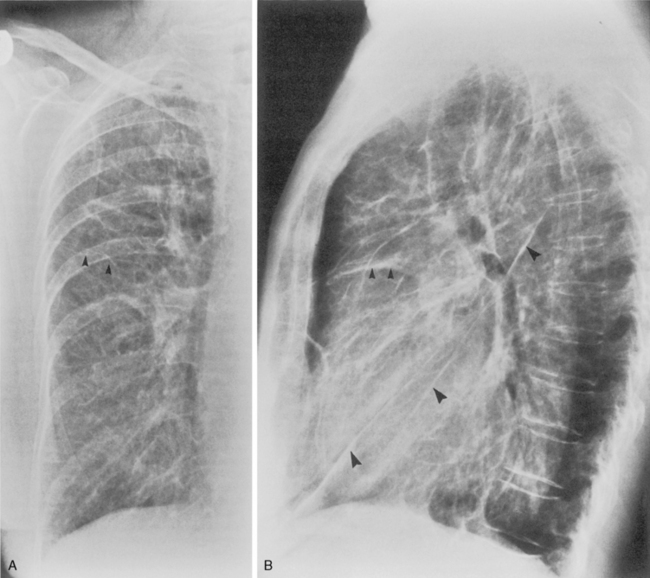
The pleural fissures can usually be identified on CT (Figs. 1-18 and 1-19
Stay updated, free articles. Join our Telegram channel

Full access? Get Clinical Tree


