Three-Dimensional Conformal Radiation Therapy
19.1. Introduction
By three-dimensional conformal radiotherapy (3-D CRT), we mean treatments that are based on 3-D anatomic information and use dose distributions that conform as closely as possible to the target volume in terms of adequate dose to the tumor and minimum possible dose to normal tissue. The concept of conformal dose distribution has also been extended to include clinical objectives such as maximizing tumor control probability (TCP) and minimizing normal tissue complication probability (NTCP). Thus, the 3-D CRT technique encompasses both the physical and biologic rationales in achieving the desired clinical results.
Although 3-D CRT calls for optimal dose distribution, there are many obstacles to achieving these objectives. The most major limitation is the knowledge of the tumor extent. Despite the modern advances in imaging, the clinical target volume (CTV) is often not fully discernible. Depending on the invasive capacity of the disease, what is imaged is usually not the CTV. It may be what is called the gross tumor volume (GTV). Thus, if the CTVs drawn on the cross-sectional images do not fully include the microscopic spread of the disease, the 3-D CRT loses its meaning of being conformal. If any part of the diseased tissue is missed or seriously underdosed, it will inevitably result in failure despite all the care and effort expended in treatment planning, treatment delivery, and quality assurance. From the TCP point of view, accuracy in localization of CTV is more critical in 3-D CRT than in techniques that use generously wide fields and simpler beam arrangements to compensate for the uncertainty in tumor localization.
In addition to the difficulties in the assessment and localization of CTV, there are other potential errors that must be considered before planning 3-D CRT. Patient motion, including that of tumor volume, critical organs, and external fiducial marks during imaging, simulation, and treatment, can give rise to systematic as well as random errors that must be accounted for when designing the planning target volume (PTV). If sufficient margins have been allowed for in the localization of PTV, the beam apertures are then shaped to conform and adequately cover the PTV (e.g., within 95%–105% isodose surface relative to prescribed dose). In the design of conformal fields to adequately treat the PTV, consideration must be given to the cross-beam profile, penumbra, and lateral radiation transport as a function of depth, radial distance, and tissue density. Therefore, sufficient margins must be given between the PTV outline and the field boundary to ensure adequate dose to the PTV at every treatment session.
Even if the fields have been optimally designed, biologic response of the tumor and the normal tissues needs to be considered in achieving the goals of 3-D CRT. In other words, the optimization of a treatment plan has to be evaluated not only in terms of dose distribution (e.g., dose volume histograms), but also in terms of dose-response characteristics of the given disease and the irradiated normal tissues. Various models involving TCP and NTCP have been proposed, but the clinical data to validate these models are scarce. Until more reliable data are available, caution is needed in using these concepts to evaluate treatment plans. This is especially important in considering dose-escalation schemes that invariably test the limits of normal tissue tolerance within or in proximity to the PTV.
Notwithstanding the formidable obstacles in defining and outlining the true extent of the disease, the clinician must follow an analytic plan recommended by the International Commission on Radiation Units and Measurements (ICRU) (1). Various target volumes (GTV, CTV, PTV, etc.) should be carefully designed considering the inherent limitations or uncertainties at each step of the process. The final PTV should be based not only on the given imaging data and other diagnostic studies, but also the clinical experience that has been obtained in the management of that disease. Tightening of field margins around image-based GTV, with little attention to occult disease, patient motion, or technical limitations of dose delivery, is a misuse of the 3-D CRT concept that must be avoided at all cost. It should be recognized that 3-D CRT is not a new modality of treatment, nor is it synonymous with better results than successful and well-tested conventional radiation therapy. Its superiority rests entirely on how accurate the PTV is and how much better the dose distribution is. So, instead of calling it a new modality, it should be considered as a superior tool for treatment planning with a potential of achieving better results.
19.2. Treatment-Planning Process
The main distinction between treatment planning of 3-D CRT and that of conventional radiation therapy is that the former requires the availability of 3-D anatomic information and a treatment-planning system that allows optimization of dose distribution in accordance with the clinical objectives. The anatomic information is usually obtained in the form of closely spaced transverse images, which can be processed to reconstruct anatomy in any plane, or in three dimensions. Depending on the imaging modality, visible tumor, critical structures, and other relevant landmarks are outlined slice by slice by the planner. The radiation oncologist draws the target volumes in each slice with appropriate margins to include visible tumor, the suspected tumor spread, and patient motion uncertainties. This process of delineating targets and relevant anatomic structures is called segmentation.
The next step is to follow the 3-D treatment-planning software to design fields and beam arrangements. One of the most useful features of these systems is the computer graphics, which allow beam’s-eye-view (BEV) visualization of the delineated targets and other structures. The term BEV denotes display of the segmented target and normal structures in a plane perpendicular to the central axis of the beam, as if being viewed from the vantage point of the radiation source. Using the BEV option, field margins (distance between field edge and the PTV outline) are set to cover the PTV dosimetrically within a sufficiently high isodose level (e.g., ≥95% of the prescribed dose). Ordinarily a field margin of approximately 2 cm is considered sufficient to achieve this, but it may need further adjustments depending on the given beam profile and the presence of critical structures in the vicinity of the PTV.
Nonetheless, it is important to remember that each beam has a physical penumbra (e.g., region between 90% and 20% isodose level) where the dose varies rapidly and that the dose at the field edge is approximately 50% of the dose at the center of the field. For a uniform and adequate irradiation of the PTV, the field penumbra should lie sufficiently outside the PTV to offset any uncertainties in PTV.
Optimization of a treatment plan requires not only the design of optimal field apertures, but also appropriate beam directions, number of fields, beam weights, and intensity modifiers (e.g., wedges, compensators, dynamic multileaf collimators, etc.). In a forward-planning system, these parameters are selected iteratively or on a trial-and-error basis and therefore, for a complex case, the whole process can become very labor intensive if a high degree of optimization is desired. In practice, however, most planners start with a standard technique and optimize it for the given patient using 3-D treatment-planning tools such as BEV, 3-D dose displays, noncoplanar beam options, intensity modulation, and dose volume histograms. The time required to plan a 3-D CRT treatment depends on the complexity of a given case, experience of the treatment-planning team, and speed of the treatment-planning system. The final product, the treatment plan, is as good as its individual components, namely the quality of input patient data, image segmentation, image registration, field apertures, dose computation, plan evaluation, and plan optimization.
A. Imaging Data
Anatomic images of high quality are required to accurately delineate target volumes and normal structures. Modern imaging modalities for treatment planning include computed tomography (CT), magnetic resonance imaging (MRI), ultrasound (US), single photon emission tomography (SPECT), and positron emission tomography (PET). Although CT and MRI are the most commonly used procedures, other modalities offer special advantages in imaging certain types of tumors. A brief review of image characteristics of these modalities is presented to elucidate particular advantages and limitations with regard to their use in treatment planning.
A.1. Computed Tomography
As discussed in Chapter 12, a CT image is reconstructed from a matrix of relative linear attenuation coefficients measured by the CT scanner. The matrix typically consists of 1,024 × 1,024 picture elements, called pixels. Each pixel is a measure of relative linear attenuation coefficient of the tissue for the scanning beam used in the CT scanner. By appropriate calibration of the CT scanner using phantoms containing tissue substitutes (CT phantoms), a relationship between pixel value (CT numbers) and tissue density can be established. This allows pixel-by-pixel correction for tissue inhomogeneities in computing dose distributions.
One of the important features of 3-D treatment planning is the ability to reconstruct images in planes other than that of the original transverse image. These are called the digitally reconstructed radiographs (DRRs). An example is shown in Figure 19.1. To obtain high-quality DRRs, not only are images of high contrast and resolution required, but also the slice thickness must be sufficiently small. A slice thickness of 2 to 10 mm is commonly used depending on the need, for example, thinner slices for tumor localization or high-quality DRRs and thicker slices for regions outside the tumor volume. The spiral or helical CT scanners allow continuous rotation of the x-ray tube as the patient is translated through the scanner aperture. This substantially reduces the overall scanning time and therefore allows acquisition of a large number of thin slices required for high-quality CT images and DRRs.
Besides high-image-quality CT scanning, treatment planning requires special considerations such as patient positioning, immobilization, and external markings that are visible in the images. For treatment planning, the CT couch must be flat and the patient must be set up in the same position as for actual treatment. Immobilization devices are essential for 3-D CRT and should be the same as those for CT as used in the treatment. Fiducial points marked on the patient’s skin or masks should be visible in the CT images by using radiopaque markers such as plastic catheters.
Because CT images can be processed to generate DRRs in any plane, conventional simulation may be replaced by CT simulation. A CT simulator is a CT scanner equipped with some additional hardware such as laser localizers to set up the treatment isocenter, a flat table or couch insert, and image registration devices. A computer workstation with special software to process CT data, plan beam directions, and generate BEV DRRs allows CT simulation films with the same geometry as the treatment beams. For a practical detail of CT simulation, the reader is referred to Coia et al. (2).
A.2. Magnetic Resonance Imaging
Principles of MRI are discussed in Chapter 12. In treatment planning, MRI images may be used alone or in conjunction with CT images. In general, MRI is considered superior to CT in soft-tissue discrimination such as central nervous system tumors and abnormalities in the brain. Also, MRI is well suited to imaging head and neck cancers, sarcomas, the prostate gland, and lymph nodes. On the other hand, it is insensitive to calcification and bony structures, which are best imaged with CT. Although important differences exist between CT and MRI image characteristics, the two are considered complementary in their roles in treatment planning.
The most basic difference between CT and MRI is that the former is related to electron density and atomic number (actually representing x-ray linear attenuation coefficients), while the latter shows proton density distribution. Although the best spatial resolution of both modalities is similar (∼1 mm), MRI takes much longer than CT and, therefore, is susceptible to artifacts from patient movement. On the advantageous side, MRI can be used to directly generate scans in axial, sagittal, coronal, or oblique planes.
One of the most important requirements in treatment planning is the geometric accuracy. Of all the imaging modalities, CT provides the best geometric accuracy and, therefore, CT images are considered a reference for anatomic landmarks, when compared with the other modality images. Functional MRI (fMRI) also has potential to be useful in treatment planning by showing physiologic activity as it happens and, therefore, may be useful in outlining of the target volumes and critical structures for highly conformal radiation therapy such as in the brain.
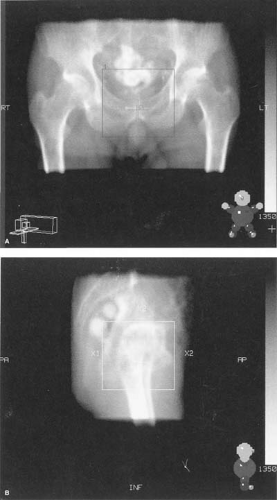 Figure 19.1. An example of digital reconstructed radiographs created from transverse computed tomography scans. Image A is frontal and image B is lateral. |
B. Image Registration
The term registration as applied to images connotes a process of correlating different image data sets to identify corresponding structures or regions. Image registration facilitates comparison of images from one study to another and fuses them into one data set that could be used for treatment planning. For example, computer programs are now available that allow image fusing, for example, mapping of structures seen in MRI onto the CT images. Various registration techniques include point-to-point fitting, interactively superimposing images in the two data sets, and surface or topography matching. An example of image fusion of a CT and MRI study is shown in Figure 19.2. For further discussion on image registration, the reader is referred to Kessler et al. (3), Pelizzari et al. (4), and Austin-Seymour et al. (5).
C. Image Segmentation
The term image segmentation in treatment planning refers to slice-by-slice delineation of anatomic regions of interest, for example, external contours, targets, critical normal structures, anatomic landmarks, etc. The segmented regions can be rendered in different colors and can be viewed in BEV configuration or in other planes using DRRs. Segmentation is also essential for calculating dose volume histograms (DVHs) for the selected regions of interest.
Image segmentation is one of the most laborious but important processes in treatment planning. Although the process can be aided for automatic delineation based on image contrast near the boundaries of structures, target delineation requires clinical judgment, which cannot be automated or completely image based. Nor should it be delegated to personnel other than the physician in charge of the case, the radiation oncologist. Figure 19.3 shows an example of a segmented image for prostate gland treatment planning.
D. Beam Aperture Design
After image segmentation has been completed, the treatment planner gets to the task of selecting beam direction and designing beam apertures. This is greatly aided by the BEV capability of the 3-D treatment-planning system. Targets and critical normal structures made visible in different colors through segmentation can be viewed from different directions in planes perpendicular to the beam’s central axis. Beam directions that create greater separation between targets and critical structures are generally preferred unless other constraints such as obstructions in the path of the beam, gantry collision with the couch or patient, etc., preclude those choices. BEV capability, combined with DRRs, is a powerful tool in selecting beam directions and shaping fields around the target.
Beam apertures can be designed automatically or manually depending on the proximity of the critical structures and the uncertainty involved in the allowed margins between the CTV and PTV. In the automatic option, the user sets a uniform margin around the PTV. A nonuniform margin requires manual drawing of the field outline. A considerable give and take occurs between target coverage and sparing of critical structures in cases where the spaces between the target and critical structures are tight, thus requiring manual design of the beam apertures. In simpler cases, automatic margins may be assigned between the PTV and field edges, taking into account the field penumbra and the required minimum isodose coverage of the PTV. Generally, a 2-cm margin between the PTV and the field edge ensures better than 95% isodose coverage of the PTV, but this must be ascertained through actual computation of the dose distribution. Figure 19.4 shows examples of BEV of beam apertures and dose distributions in transverse, sagittal, and coronal planes. The sagittal and coronal images are derived from DRRs.
Related posts:

Stay updated, free articles. Join our Telegram channel

Full access? Get Clinical Tree


