Tissue Contrast: Some Clinical Applications
Introduction
In the previous chapter, we talked about T1 and T2 weighting in terms of the time parameters TR and TE. Now let’s discuss the T1 and T2 characteristics of the following tissues and see what physical properties affect them:
H2O
Solids
Fat
Proteinaceous material
T2 Characteristics
The T2 characteristics of a tissue are determined by how fast the proton spins in that tissue dephase. If they dephase rapidly, we get a short T2. If they dephase more slowly, we get a longer T2.
H2O. Because of the structure of the water molecule (H-O-H) and because of the sparsity of these molecules, spin-spin interaction among the hydrogen protons is minimal. Therefore, dephasing occurs at a much slower rate in water compared with other tissues. The T2 relaxation time for H2O is, therefore, long. Remember that T2 decay is caused either by external magnetic field inhomogeneities or by spin-spin interactions within or between molecules. In H2O, the effect of one hydrogen proton on another is relatively small. The distance between hydrogen protons both within each molecule and between adjacent molecules is relatively large, so there is little spin-spin interaction and, therefore, less dephasing.
Solids. The molecular structure of solids is opposite to that of pure water. It is a very compactly structured tissue, with many interactions between hydrogen protons. This large number of spin-spin interactions results in more dephasing. Thus, the T2 for solids is short.
Fat and Proteinaceous Material. The structure of these materials is such that there is less dephasing than in solids but more dephasing than in water. Therefore, T2 for proteinaceous material or fat is intermediate.
T1 Characteristics
The T1 of a tissue has to do with the way the protons are able to give off their energy to the surrounding lattice, or to absorb the energy from the lattice. It turns out that the most efficient energy transfer occurs when the natural motional frequencies1 of the protons are at the Larmor frequency (ω0). Recall that the Larmor frequency is proportional to the strength of the magnetic field: ω0 = γBo
In other words, the precessional frequency of a hydrogen proton is 42.6 MHz in a 1-Tesla
magnetic field. However, the natural motional frequency of hydrogen protons depends on the physical states of the tissue. It is influenced by the atoms to which they are attached or to which they are proximal.
magnetic field. However, the natural motional frequency of hydrogen protons depends on the physical states of the tissue. It is influenced by the atoms to which they are attached or to which they are proximal.
H2O. Hydrogen protons in the small H2O molecule have higher natural motional frequencies than, for example, hydrogen protons in a solid structure. The natural motional frequency of hydrogen protons in water is also much faster than the Larmor frequency for hydrogen.
ω (H2O)  ω0
ω0
ω0Solids. Hydrogen protons in solids have lower natural motional frequencies than do water protons. The natural motional frequencies of hydrogen protons in solids are somewhat slower than the Larmor frequency for hydrogen.
ω (solids) < ω0
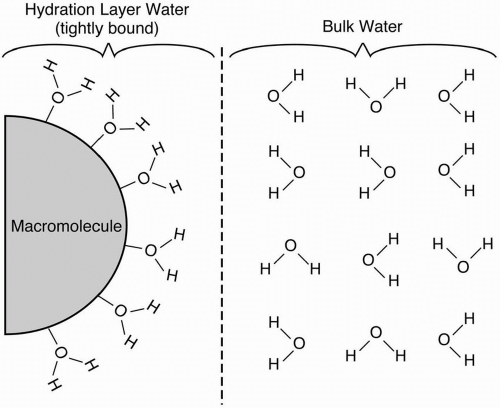 Figure 6-1. Hydration layer water. |
Fat. Hydrogen protons in fat have natural motional frequencies that are almost equal to the Larmor frequencies used for MRI.
ω (fat) ≈ ω0
This result is caused by the rotational frequency of the carbons around the terminal C-C bond. Because this frequency is near the Larmor frequency, the efficiency of energy transfer from the protons to the lattice or from the lattice to the protons is increased, thus decreasing T1.
Proteinaceous Solutions. The foregoing discussion on the T1 and T2 characteristics of fluids such as water applies only to pure water (or bulk phase water). However, most of the water in the body is not in the pure state but is bound to a hydrophilic macromolecule such as a protein.
Such water molecules form hydration layers around the macromolecule and are called hydration layer water (Fig. 6-1). These bound H2O molecules lose some of the freedom in their
motion. As a result, the natural motional frequencies of the H2O molecules get closer to the Larmor frequency, thus yielding a more efficient energy transfer. The net result is a shortening in the T1 relaxation. Therefore, proteinaceous fluids, that is, hydration layer water, are brighter than pure water on T1-weighted images.
motion. As a result, the natural motional frequencies of the H2O molecules get closer to the Larmor frequency, thus yielding a more efficient energy transfer. The net result is a shortening in the T1 relaxation. Therefore, proteinaceous fluids, that is, hydration layer water, are brighter than pure water on T1-weighted images.
If the protein content is high enough, hydration layer water can cause some T2 shortening. This shortening is generally seen in gels and in mucinous fluids. Such proteinaceous fluids may be darker than pure fluids on T2-weighted images.
For H2O and solid tissue, the energy transfer is not efficient, and the T1 for H2O and solid tissue is long. Also, the T1 for H2O is longer than the T1 for solid tissue because the difference between the Larmor frequency and the natural motional frequencies of hydrogen protons in H2O is much greater than the difference between the Larmor frequency and the motional frequencies of hydrogen protons in solid tissue.
For the sake of argument, we’ll assume that they all have the same proton density. Actually, the proton density of H2O is higher because there are more hydrogen protons per volume in water than either fat or solid tissue, and intensity is based not only on T1 and T2 but also on the proton density N(H):
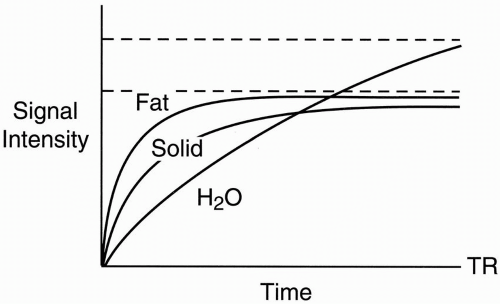 Figure 6-2. T1 recovery curves of fat, water, and a solid tissue. |
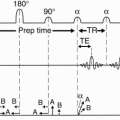
At a time TR, we transmit another radio frequency (RF) pulse. Let’s superimpose the T2 decay curve on the T1 recovery curve (Fig. 6-3):
Solid tissue has short T2 and will thus decay fairly rapidly.
Fat has an intermediate T2.
Proteinaceous fluid may have a short or intermediate T2 depending on the protein content.
Therefore, we see that if we pick a long enough TE (TE3) in Figure 6-3, the signals that we measure from each tissue show the following:
H2O has the highest signal intensity (point a, Fig. 6-3).
Solid tissue has the lowest signal intensity.
Fat has an intermediate signal intensity.
Proteinaceous fluid has an intermediate or low signal intensity depending on its protein content.
If we take a shorter TE (TE2), we might pick a point where fat and H2O might have the same signal intensity. This is a crossover effect (point b, Fig. 6-3).
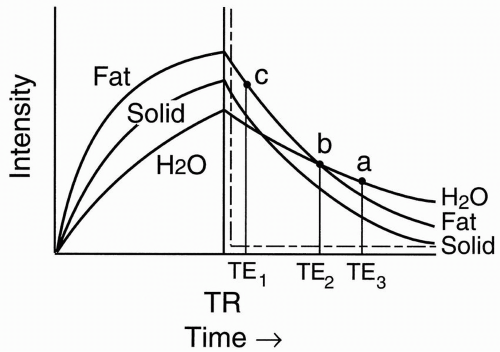 Figure 6-3. T2 decay curves of fat, water, and a solid tissue. |
If the TE is really short (TE1), we just get a T1 or proton density effect (it depends on the TR), where
Fat has the highest intensity (point c, Fig. 6-3).
Proteinaceous fluid also has high intensity similar to fat.
Solid tissue has intermediate intensity.
H2O has the lowest intensity.
So, we can see from the curve that
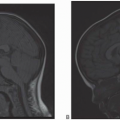
Let’s now look at three different tissues in the brain: (i) gray matter, (ii) white matter, and (iii) cerebrospinal fluid (CSF; Fig. 6-4). On a T1 recovery curve:
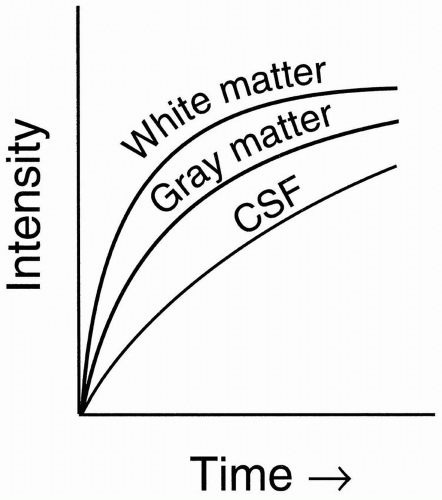 Figure 6-4. T1 recovery curves of CSF, white matter, and gray matter. |
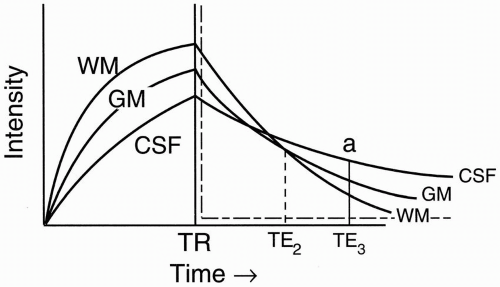 Figure 6-5. T2 decay curves of CSF, white matter, and gray matter. |
White matter is bright. The myelin sheath acts like fat; with more efficient energy exchange, it has a shorter longitudinal relaxation than does gray matter.
Gray matter is intermediate: without myelin, it acts more like a typical solid tissue.
CSF is dark: like water, it has inefficient energy exchange and thus the same long longitudinal relaxation, T1.
CSF, like H2O, has the least dephasing, and thus the longest T2.
If we use a long TE (TE3), then we’ll get a typical T2-weighted image. Therefore, at TE = TE3, we have (Fig. 6-6):
Let’s pick a shorter TE = TE2 (Fig. 6-6). At this point, white matter and CSF are isointense (crossover point). We want to achieve this isointensity on a proton density image. We can see the advantages by considering what tumors and demyelinating plaques do on a T1 recovery curve, or on a T2


Related posts:
Stay updated, free articles. Join our Telegram channel
Full access? Get Clinical Tree
