Mortality
Any death due to approximate cardiac cause (e.g., MI, cardiac tamponade, worsening heart failure)
Unwitnessed death and death of unknown cause
All procedure-related deaths, including those related to complication of the procedure or treatment for a complication of the procedure
Death caused by noncoronary vascular conditions of the cerebrovascular disease, pulmonary embolism, ruptured aortic aneurysm, dissecting aneurysm, or other vascular disease
Periprocedural myocardial infarction (<72 h)
New ischemic symptoms (e.g., chest pain or shortness of breath) or new ischemic signs (e.g., ventricular arrhythmias, new or worsening heart failure, new ST segment changes, hemodynamic instability, or imaging evidence of new loss of viable myocardium or new wall motion abnormality)
Elevated cardiac biomarkers (preferably CK-MB) within 72 h after the index procedure, consisting of two or more post-procedure samples that are >6–8 h apart with a 20 % increase in the second sample and a peak value exceeding 10× the 99th percentile upper reference limit (URL) or peak value exceeding 5× the 99th percentile URL with the new pathological Q waves in at least two contiguous leads
Spontaneous myocardial infarction (>72 h)
Detection of rise and/or fall of cardiac biomarkers (preferably troponin) with at least one value above the 99th percentile URL, together with evidence of myocardial ischemia with at least one of the following:
(a) ECG changes indicative of new ischemia (new ST-T changes or new left bundle branch block)
(b) New pathological Q waves in at least two contiguous leads
(c) Imaging evidence of new loss of viable myocardium or new wall motion abnormality
Sudden unexpected cardiac death, involving cardiac arrest, often with symptoms suggestive of myocardial ischemia, and accompanied by presumably new ST elevation, or new left bundle branch block, and/or evidence of fresh thrombus by coronary angiography and/or at autopsy, but death occurring before blood samples could be obtained or at a time before the appearance of cardiac biomarkers in the blood
Pathological findings of an acute myocardial infarction
Stroke
Rapid onset of focal global neurological deficit with a change in level of consciousness or hemiplegia or hemiparesis or numbness or sensory loss affecting one side of the body or dysphagia or aphasia or hemianopia or amaurosis fugax or other neurological signs or symptoms consistent with stroke
Duration also focal or group of neurological deficit ≥24 h or <24 h, if therapeutic interventions were performed (e.g., Thrombolytic therapy, or intracranial angioplasty) or available new imaging documents a new hemorrhage or infarct or the more logical deficit results in death
No readily identifiable non-stroke cause for the clinical presentation (e.g., brain tumor, trauma, infection, hypoglycemia, peripheral lesion, pharmacological influences)
Confirmation of the diagnosis by at least one of the following:
(a) Neurology or neurosurgical specialist
(b) Neuroimaging procedure (MR or CT scan or cerebral angiography)
(c) Lumbar puncture (i.e., spinal fluid analysis diagnostic of intracranial hemorrhage)
Acute kidney injury
Change in serum creatinine (up to 72 h) compared to baseline
1. Stage I: increase in serum creatinine to 150–200 % (1.5–2× increase compared with baseline) or increase of ≥0.3 mg/dL
2. Stage II: increase in serum creatinine to 200–300 % (2–3× increase compared with baseline) or increase between >0.3 and <4.0 mg/dL
3. Stage III: increase in serum creatinine to ≥300 % (>3× increase compared with baseline) or serum creatinine of ≥4 mg/dL with an acute increase of at least 0.5 mg/dL. Patients receiving renal replacement therapy are considered to meet stage III criteria irrespective of other criteria
Life-threatening/disabling bleeding
Fatal bleeding OR
Bleeding in a critical area are organ, such as intracranial, intraspinal, intraocular, pericardial necessitating pericardiocentesis, or intramuscular with compartment syndrome
Bleeding causing hypovolemic shock or severe hypotension requiring vasopressors or surgery
Overt source of bleeding with drop in hemoglobin of ≥5 g/dL or whole blood or PRBC transfusion ≥4 units
Major bleeding
Overt bleeding either associated with a drop in hemoglobin level of at least 3 g/dL or requiring transfusion of 2 or 3 units of PRBC AND
Does not meet criteria for life-threatening or disabling bleeding
Minor bleeding
Any bleeding worthy of clinical mention (e.g., access site hematoma) that does not qualify as life-threatening, disabling, or major
Major vascular complications
Any thoracic aortic dissection
Access site or access-related vascular injury (dissection, stenosis, perforation, rupture, arteriovenous fistula, pseudoaneurysm, hematoma, irreversible nerve injury, or compartment syndrome) leading to either death, need for significant blood transfusions (≥4 units), unplanned percutaneous or surgical intervention, or irreversible end-organ damage (e.g., hypogastric artery occlusion causing visceral ischemia and spinal artery injury causing neurological impairment)
Distal embolization (non-cerebral) from a vascular source requiring surgery or resulting in amputation or irreversible end-organ damage
Minor vascular complications
Access site or access-related vascular injury (dissection, stenosis, perforation, rupture, arteriovenous fistula or pseudoaneurysm requiring compression or thrombin injection therapy, or hematoma requiring transfusion of ≥2 but <4 units) not requiring unplanned percutaneous or surgical intervention and not resulting in irreversible end-organ damage
Distal embolization treated with embolectomy and/or thrombectomy and not resulting in amputation or irreversible end-organ damage
Failure of percutaneous access site closure resulting in interventional (e.g., stent graft) or surgical correction and not associated with death, need for significant blood transfusions (≥4 units), or irreversible end-organ damage
Vascular complications and bleeding-related events are considered important safety endpoints in TAVR. The use of large sheaths in a predominantly elderly population has led to non-negligible rates of major vascular complications during TAVR [19]. Of note, “access site” is defined as any location (arterial or venous) traversed by a guide wire, catheter, or a sheath (including the left ventricular apex and the aorta). “Access-related” complications are defined as any adverse clinical events that could possibly be associated with any of the access sites used during the procedure.
Besides the solitary endpoints discussed above, VARC proposes three composite endpoints (Table 3.2). “Device success” is an intra-procedural composite endpoint; “combined safety endpoint” is a composite endpoint up to 30 days; and “combined efficacy endpoint” is a composite endpoint at 1 year or longer.
Table 3.2
Consensus definition of composite endpoints per Valve Academic Research Consortium (VARC)
Outcome | Definition |
|---|---|
Device success | Successful vascular access, delivery, and deployment of the device and successful retrieval of the delivery system |
Correct position in the proper anatomical location | |
Intended performance of the prosthetic heart valve (aortic valve area greater than 1.2 cm2 and mean aortic valve gradient <20 mmHg or peak velocity <3 m/s, without moderate or severe prosthetic valve aortic regurgitation) | |
Only one valve implanted in the proper anatomical location | |
Combined safety endpoint (at 30 days) | All-cause mortality |
Major stroke | |
Life-threatening (or disabling) bleeding | |
Acute kidney injury stage III (including renal replacement therapy) | |
Periprocedural MI | |
Major vascular complication | |
Repeat procedure for valvular dysfunction (surgical or interventional therapy) | |
Combined efficacy endpoint (at 1 year or longer) | All-cause mortality (after 30 days) |
Failure of current therapy for aortic stenosis, requiring hospitalization for symptoms or valve-related or cardiac decompensation | |
Prosthetic heart valve dysfunction (aortic valve area less than 1.2 cm2 and mean aortic valve gradient ≥20 mmHg or peak velocity ≥3 m/s, or moderate or severe prosthetic valve aortic regurgitation) |
Multicenter Registries of TAVR
TAVR was introduced to clinical practice in 2002 by the commercial use of the Edwards valve, with the CoreValve available for use beginning 2007. The earliest experience with the Edwards valve was reported in the Canadian registry comprising experience between 2005 and 2009 and the SAPIEN Aortic Bioprosthesis European Outcome (SOURCE) registry comprising experience between 2007 and 2009 [20, 21]. The earliest experience with the CoreValve was reported in the multicenter expanded evaluation registry comprising experience between 2007 and 2008 [22]. To date, several multicenter registries of TAVR have been assembled and described [20–30], with a large majority of them reported from several European countries. These registries provide the results after commercialization of the available devices and reflect “real-world” experience worldwide. Despite the “real-world” effectiveness data provided by these registries, there are several important limitations that should be kept in mind. Most of the registry data is derived from hospital-reported data to a central agency. The data are compiled in a retrospective fashion and thus are prone to biases inherent to observational cohort studies, such as selection and ascertainment biases. In most circumstances, the outcomes are not adjudicated by a central agency, and source documentation is not verified, leading to heterogeneity in definitions as well as interpretation of clinical scenarios.
Table 3.3 describes the characteristics of 11 large representative registries that have been described in the literature. The number of participating centers range from nine centers in the PARTNER-EU registry [24] to 51 centers in the multicenter expanded evaluation registry [22]. Of these 11 registries, 3 have exclusively described CoreValve experience [22, 25, 30], 3 have exclusively described Edwards valve experience [20, 21, 24], and the rest have reported combined experiences with both valves [23, 26–29]. Transfemoral approach to TAVR has been reported as the favored approach in most registries and was adopted in 46.9–95.8 % of all reported cases. In the current era, most centers adopt a “transfemoral first” selection policy, with the criteria for a non-transfemoral approach based on the multidisciplinary team’s consideration of several factors including degree of calcification, size, tortuosity, and atheroma burden of the aortoiliofemoral arterial system. In recent years, there has been an emphasis on the establishment of “global TAVR” program (comprising of both transfemoral and non-transfemoral approaches), which would allow for the treatment of more than three-fourths of the patients who are denied SAVR [31].
Table 3.3
Characteristics of multicenter registries of transcatheter aortic valve replacement
Author/publication year | Registry | N | Period of study | Number of centers | Edwards valve (n) | CoreValve (n) | Transfemoral approach (%) | Transapical approach (%) | Other approaches (%) |
|---|---|---|---|---|---|---|---|---|---|
Gilard/2012 | FRANCE 2 | 3,195 | 1/2010–10/2011 | 34 | 2,107 | 1,043 | 2,361 (73.9) | 567 (17.7) | 267 (8.4) |
Rodes-Cabau/2010 | Canadian | 339 | 1/2005–6/2009 | 6 | 339 | 0 | 167 (49.2) | 172 (50.8) | 0 |
Lefevre/2011 | PARTNER-EU | 130 | 4/2007–1/2008 | 9 | 130 | 0 | 61 (46.9) | 69 (53.1) | 0 |
Meredith/2011 | Australia New Zealand | 118 | 8/2008–7/2010 | 10 | 0 | 118 | 113 (95.8) | 0 | 5 (4.2) |
Moat/2011 | UK-TAVI | 870 | 12/2007–12/2009 | 25 | 410 | 452 | 599 (68.9) | 271 (31.1) | |
Bosmans /2010 | Belgian | 328 | Till 4/2010 | 15 | 187 | 141 | 232 (70.8) | 88 (26.8) | 8 (2.4) |
Eltchaninoff/2010 | FRANCE | 244 | 2/2009–7/2009 | 16 | 166 | 78 | 161 (66.0) | 71 (29.1) | 12 (4.9) |
Thomas/2010 | SOURCE | 1,038 | 11/2007–1/2009 | 34 | 1,038 | 0 | 463 (44.6) | 575 (55.4) | 0 |
Piazza/2008 | Multiple European countries | 646 | 4/2007–4/2008 | 51 | 0 | 646 | NR | NR | NR |
Zahn/2010 | German | 697 | 1/2009–12/2009 | 22 | 109 | 588 | 644 (92.4) | 26 (3.7) | 27 (3.9) |
Tamburino/2011 | Italian | 663 | 6/2007–12/2009 | 14 | 0 | 663 | 599 (90.3) | 0 | 64 (9.7) |
Table 3.4 demonstrates the baseline characteristics of patients included in individual multicenter registries. The mean age in all registries was consistently greater than 80 years, and the proportion of males varied from 44.0 to 59.3 %. There was a significant heterogeneity in the risk profile of patients in various registries. The lowest risk profile was reported in the Australian New Zealand registry reporting a mean (SD) logistic EuroSCORE of 18.4 (11.9)% [25]. In addition to this registry, the UK-TAVI registry also had similar risk profile patients with a median (interquartile range) logistic EuroSCORE of 18.5 (11.7–27.9)% [26]. On the contrary, the other registries had a mean logistic EuroSCORE of >20. The highest risk patients were reported in the PARTNER-EU registry with a mean (SD) logistic EuroSCORE of 30.0 (13.7 %) [24]. With the due consideration of the logistic EuroSCORE in the decision making for TAVR, it is important to remember that a large proportion of patients are refused for surgical AVR and undergo TAVR on the basis of risk factors like porcelain aorta or frailty, neither of which are a part of traditional surgical risk calculators. The prevalence of CAD varied from 41.3 % in the FRANCE registry to 69.0 % in the Canadian registry [20, 28]. Similarly, the history of stroke or cerebrovascular accidents was present in 7.2–22.7 % of the included subjects. Majority of the patients included in the multicenter registries were reported to be symptomatic. The proportion of patients with reported class 3 or class 4 New York Heart Association (NYHA) symptoms varied from 65.5 % in the Italian registry to 90.9 % in the Canadian registry [20, 30].
Table 3.4
Characteristics of included patients in various registries
Registry/N | Mean (SD) age (years) | Males (%) | Mean (SD) logistic EuroSCORE | Mean (SD) STS score | Prevalence of CAD (%) | Prevalence of stroke (%) | NYHA Class III/ IV (%) | Mean (SD) aortic valve area (cm2) | Mean (SD) transaortic gradient | Mean (SD) LVEF |
|---|---|---|---|---|---|---|---|---|---|---|
FRANCE 2/3,195 | 82.7 (7.2) | 51.0 | 21.9 (14.3) | 14.4 (11.9) | 47.9 | 10.0 | 75.9 | 0.7 (0.2) | 48.1 (16.5) | 53.2 (14.1) |
Canadian/339 | 81.0 (8.0) | 44.8 | – | 9.8 (6.4) | 69.0 | 22.7 | 90.9 | 0.6 (0.2) | 46.0 (17.0) | 55.0 (14.0) |
PARTNER-EU/130 | 82.1 (5.5) | 44.6 | 30.0 (13.7) | 11.6 (6.5) | 60.0 | – | 84.6 | 0.6 (0.2) | 47.3 (18.9) | 52.8 (16.1) |
Australia New Zealand/118 | 82.3 (7.7) | 59.3 | 18.4 (11.9) | 5.6 (2.7) | – | – | 83.9 | 0.7 (0.2) | 50.6 (16.2) | 57.8 (13.0) |
UK-TAVI/870 | 81.9 (7.1) | 52.4 | 18.5 (11.7–27.9)a | – | 47.6 | – | 77.0 | – | – | – |
Belgian/328 | 83.0 (6.0) | 54.0 | 28.0 (16.0) | – | 58.0 | 15.0 | 79.0 | 0.6 (0.2) | 49.0 (16.0) | 55.0 (14.0) |
FRANCE/244 | 82.3 (7.3) | 56.6 | 25.6 (11.4) | 18.9 (12.8) | 41.3 | 10.2 | 74.5 | 0.7 (0.2) | 46.0 (16.0) | 51.0 (14.0) |
SOURCE/1,038 | 81.1 (6.9) | 44.6 | 27.6 (15.6) | – | 51.9 | – | – | – | – | – |
European registry/646 | 81.0 (6.6) | 46.1 | 23.1 (13.8) | – | 56.8 | 7.4 | 82.4 | 0.6 (0.2) | 49.4 (13.9) | 51.5 (13.9) |
German/697 | 81.4 (6.3) | 44.2 | 20.5 (13.2) | – | 60.5 | 8.2 | 87.2 | 0.6 (0.2) | 47.0 (37–60)a | 52.1 (15.0) |
Italian/663 | 81.0 (7.3) | 44.0 | 23.0 (13.7) | – | 48.3 | 7.2 | 65.5 | 0.6 (0.2) | 51.8 (17.0) | 52.1 (25.5) |
Procedural Success
The procedural success in the representative registries has varied from 88.5 to 98.4 % (Fig. 3.1). There are potential explanations for the wide range of procedural success across various registries. One primary explanation is the differences in definition of “procedural success” across the various registries. Secondly, these registries represent different time periods in the development of TAVR technology. The patients included in the registries representing the initial TAVR experience and the use of very early versions of transcatheter valve delivery systems have expectedly reported lower success rates. In addition, the learning curve phenomenon likely exerts a negative influence on the procedural success rates. Most of the contemporary registries describe pooled outcomes from all aspects of the learning phase, including patient selection and imaging as well as procedural finesse and development of bailout strategies. However, in the more recent experience with more contemporary valve and delivery systems, the procedural success rates as well as the post-procedural efficacy rates have seemed to improve significantly. The outlook for TAVR-related outcomes and procedural success appears optimistic with improved iterations of the technology with an anticipated improvement in long-term survival rates in the coming years.
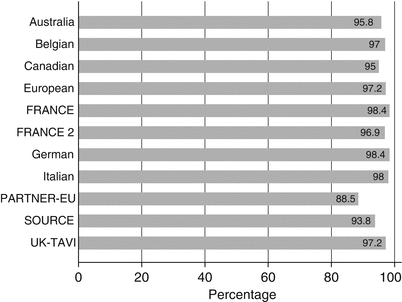

Fig. 3.1
Procedural success across various registries
Mortality
The incidence of all-cause mortality and cardiovascular-related mortality across various multicenter registries is demonstrated in Table 3.5. The 30-day all-cause mortality rates ranged from 5.6 to 13.8 % in the representative registries. The lowest 30-day all-cause mortality rates were encountered in the Australian New Zealand registry (5.6 %) and the Italian registry (5.9 %) [25, 30], while the highest 30-day all-cause mortality rates were observed in the PARTNER-EU registry (13.8 %) and the FRANCE registry (12.7 %) [24, 28]. It should be noted that the 30-day mortality rates documented in a large majority of the registries compare favorably to the contemporary surgical reports of high-risk patients undergoing surgical AVR [32]. The estimated mortality among octogenarians undergoing SAVR is approximately 6.1–9.3 % [9, 33–35]. Since the patients undergoing TAVR as a part of multicenter registries are those that are often denied surgical AVR, it remains difficult to directly compare the effectiveness of these two procedures against each other. A comparison of moderate-risk patients amenable to TAVR or SAVR—with two parallel nested registries for patients suitable for only TAVR or surgical AVR in PARTNER II—will be useful in understanding the true effect of each procedure.
Table 3.5
All-cause mortality and cardiovascular mortality across various registries
Registry/N | 30 days | 6 months | 1 year | >1 year |
|---|---|---|---|---|
All–cause mortality | ||||
FRANCE 2/3,195 | 9.7 | 18.6 | 24.0 | – |
Canadian/339 | 10.6 | – | 22.1a | – |
PARTNER-EU/130 | 13.8 | 26.9 | 36.9 | – |
Australia New Zealand/118 | 5.6 | 10.5 | – | – |
UK-TAVI/870 | 7.1 | – | 21.4 | 2 years: 26.3 |
Belgian/328 | 11.3 | – | 24.1 | – |
FRANCE/244 | 12.7 | – | – | – |
SOURCE/1,038 | 8.5 | – | – | – |
European registry/646 | 8.0 | – | – | – |
German/697 | 12.4 | – | – | – |
Italian/663 | 5.9 | – | 14.9 | 2 years: 30.3 |
3 years: 34.8 | ||||
Cardiovascular mortality | ||||
FRANCE 2/3,195 | 7.0 | 11.7 | 14.3 | – |
Canadian/339 | 9.4 | – | – | – |
PARTNER-EU/130 | 11.5 | – | 24.6 | – |
Australia New Zealand/118 | 5.6 | 7.1 | – | – |
Belgian/328 | 6.1 | – | 8.5 | – |
European registry/646 | 5.9 | – | – | – |
Italian/663 | – | – | 11.2 | 2 years: 12.1 |
3 years: 13.5 | ||||
The 6-month mortality rates following TAVR have been reported in three registries: Australia New Zealand (10.5 %), FRANCE 2 (18.6 %), and PARTNER-EU (26.9 %) [24, 25, 28]. The 1-year mortality rates varied from 14.9 % reported in the Italian registry to 36.9 % in the PARTNER-EU registry [24, 30]. Only two registries have published data for follow-up longer than 1 year [26, 36]. The 2-year mortality rate was observed to be 26.3 and 30.3 % in the UK-TAVI and the Italian registries, respectively [26, 30]. The 3-year mortality rate has been reported to be 34.8 % in the Italian registry [36]. These data may be of little surprise given the high-risk profile of the included subjects that have undergone TAVR in these registries.
The distribution of cardiovascular-related deaths in these large-scale registries is of particular interest (Table 3.5). A large majority of all deaths occurring within 30 days period after TAVR have been related to procedural cardiovascular deaths (5.6–11.5 %). However, this proportion of majority shifts rather quickly, with a significant proportion of all deaths occurred due to non-cardiovascular causes at 1-year follow-up. For example, in the FRANCE 2 registry, the incidence of all-cause mortality and non-cardiovascular mortality at 1 year was reported to be 24.0 and 9.7 %, respectively [23]. Similarly, in the Belgian registry, about 65 % of all deaths at 1-year follow-up were attributable to non-cardiovascular causes [27]. The results are equally striking at the 2- and 3-year follow-up reported in the Italian registry [36]. Roughly 60 % of the all deaths occurring at 2- and 3-year follow-up intervals were attributable to non-cardiovascular causes [36]. Most of these patients die as a result of comorbidities or secondary to conditions associated with advanced age. In accordance with the 2008 European position statement on TAVR—which stated that this procedure should not be performed on patients with a life expectancy <1 year—enhanced patient selection is needed for approximately half of all considered patients who may imminently die due to non-cardiovascular causes [37]. In the future, one crucial task will be to identify a patient population that is likely to derive the most advantage from application of TAVR technology, in the perspective of long-term efficacy and cost-effectiveness.
In an analysis performed by Ussia et al., no significant differences in cardiovascular mortality were observed between the moderate-risk and the high-risk cohorts, although a significant difference was noted in the non-cardiovascular mortality in the high-risk population [36]. These findings indirectly suggest that the application of TAVR technology to lower-risk groups may demonstrate improved cardiovascular survival and quality of life with an added advantage of a lower non-cardiovascular-related mortality.
Several studies have identified pre-procedural variables, which may be useful in predicting short-term as well as long-term mortality. The SOURCE registry identified that patients with logistic EuroSCORE between 30 and 35 were significantly more likely to die at 30 days, when compared to those with lower scores [21]. Although the logistic EuroSCORE is a strong predictor of short-term and medium-term post-TAVR mortality, it tends to overestimate the mortality in most patients undergoing TAVR [38–40]. The findings may suggest a relative lack of utility of this scoring system in uniformly predicting risk and outcomes in patients undergoing TAVR and confirm the need for more sophisticated and procedure-specific (rather than generic) scoring systems. Generally, baseline cardiovascular factors like low ejection fraction, pulmonary hypertension, and severe mitral regurgitation along with periprocedural complications seem to have a major role in short-term mortality and mortality occurring during 1-year follow-up [19]. However, noncardiac comorbidities, like chronic obstructive pulmonary disease, chronic kidney disease, and liver disease, are important predictors of mortality during the follow-up period, rather than of the acute mortality [19]. Interestingly, the Canadian registry demonstrated similar 30-day mortality rates in frail patients as compared to the rest of the study group. In addition, the procedural and short-term mortality rates were similar between patients with and without porcelain aorta in this registry [20].
Several recent studies have identified that the degree of post-implant aortic regurgitation (AR) was an important predictor of the 1-year mortality [23, 26]. This is an important observation and requires further systematic assessment. Whether the degree of AR is responsible for an early mortality or is merely a marker for adverse outcomes is not currently clear.
Myocardial Infarction and Stroke
Table 3.6 demonstrates the incidence of MI and stroke in the various registries. The incidence of MI at 30 days has ranged from 0 to 4.6 % across the registries. The intermediate-term incidence of MI in the registry cohort has been observed to be between 1.2 and 6.2 %. This generally wide variability in the MI rates stems from the lack of uniformity in the definition of periprocedural MI among the various TAVR registries.
Table 3.6
Incidence of myocardial infarction and stroke at 30-day and long-term follow-up in the various registries
Registry/N | Myocardial infarction | Stroke | ||
|---|---|---|---|---|
30 days | Follow-up | 30 days | Follow-up | |
FRANCE 2/3,195 | – | 1 year: 1.2 | – | 1 year: major (2.3), minor (1.8) |
Canadian/339 | 1.2 | – | 2.3 | – |
PARTNER-EU/130 | 4.6 | 6 months: 6.2 | 2.3 | 6 months: 5.4 |
1 year: 6.2 | 1 year: 6.9 | |||
Australia New Zealand/118 | – | – | 1.7 | – |
UK-TAVI/870 | 1.3 | – | 4.1 | – |
Belgian/328 | – | – | Stroke: 4.4 | – |
TIA: 0.9 | ||||
FRANCE/244 | – | – | 3.6 | – |
SOURCE/1,038 | – | – | 2.6 | – |
European registry/646 | 0.6 | – | 1.9 | – |
German/697 | 0.3a | – | 2.8a | – |
Italian/663 | 0a | 1 year: 1.2 | 1.2a | 1 year: 2.6 |
3 years: 3.9 | ||||
3 years: 1.2 | ||||
Strokes during and after TAVR may occur due to embolic phenomena, ensuing (or preexisting) atrial fibrillation, aortic dissection, prolonged hypotension, or hemorrhagic complications in the setting of anticoagulants and/or antiplatelet agents. Although the transcranial Doppler studies have demonstrated that cerebral emboli may occur at any time during TAVR, most have been shown to occur during positioning and implantation of valve prosthesis [41, 42]. This clearly indicates that embolization of valve particles from the native calcified aortic valve leaflets might be an important mechanism for cerebral embolization during TAVR. A few studies have demonstrated the feasibility of using embolic protection devices during TAVR [43]. The safety and efficacy of these devices in prevention of cerebral embolic events during TAVR procedures remains to be definitively established. The randomized PROTAVI trial has recently been started in Europe and will help us understand the effect of emboli protection devices in decreasing cerebrovascular pathology detected by MRI.
The 30-day stroke rate across the various registries has ranged between 1.2 and 4.4 %. A few registries have reported stroke rates upon medium-term follow-up. The FRANCE 2 registry reported that the incidence of major and minor strokes at 1-year follow-up was 2.3 and 1.8 %, respectively [23]. Similarly, the Italian CoreValve registry reported the incidence of stroke to be 2.6 and 3.9 % at 1- and 3-year follow-up, respectively [30, 36]. The PARTNER-EU registry reported a slightly higher rate of stroke than the FRANCE 2 and the Italian registries (6 months, 5.4 %; 1 year, 6.9 %) [24]. Although the incidence rate of major stroke is largely consistent between several European registries, there appears to be a discrepancy in the rates between the registry data and the randomized PARTNER trial data [14]. In the cohort A of the PARTNER trial, there was a higher rate of major stroke reported and almost 40 % of the neurological events occurred between 1 month and 1 year of follow-up [14]. There are several possible explanations for these discrepant findings [14]. Firstly, the prevalence of preexisting cerebrovascular disease (almost 30 %) in the PARTNER trial could play a role in the higher incidence of stroke in the trial as compared to the registry data. Secondly, the devices used were first-generation devices and may have been responsible for somewhat higher stroke rates. Thirdly, the diagnosis of stroke was adjudicated by CEC in the PARTNER trial as compared to cardiologists and anesthesiologists assessing neurological function after TAVR in most registries. This may result in underestimation of clinically relevant neurological events in the registry-derived data. Magnetic resonance imaging-based studies have demonstrated cerebral perfusion defects in approximately 70–80 % of the patients undergoing TAVR [44]. Although the majority of these patients are asymptomatic from a neurological standpoint, the MRI and clinical findings nevertheless highlight the need for a systematic assessment of neurological function including cognitive abilities [44].
Arrhythmias, Conduction Abnormalities, and Pacemaker Implantation
Arrhythmias and conduction abnormalities are important concerns after TAVR. Although supraventricular and ventricular arrhythmias have been observed after TAVR at varying frequencies, they are also encountered in roughly 20–30 % of patients after SAVR. Thus, any valid comparison of frequency of arrhythmias between the two strategies would need to include a careful analysis of post-therapy arrhythmias [45]. These findings are of particular relevance as the occurrence of new-onset left bundle branch block after SAVR has been associated with an increased risk of death and subsequent life-threatening arrhythmias during follow-up [46, 47]. New-onset intraventricular conduction abnormalities, particularly the new-onset left bundle branch block, are encountered frequently after TAVR (7–18 % after Edwards valve implantation; 30–83 % after CoreValve implantation) [45, 48–52]. Direct mechanical injury of the left bundle branch and the inflammation due to the stent prosthesis are likely offenders to the conduction system. However, the implications of a new-onset left bundle branch block after TAVR upon long-term adverse outcomes are not well understood.
Stay updated, free articles. Join our Telegram channel

Full access? Get Clinical Tree


