Fig. 1
Vascular and vesicoureteral anastomoses. The renal vein is attached to the external iliac vein. The arterial anastomosis is variable: end-to-side to the primary iliac artery (a) or to the external iliac artery (b), most often above the venous implantation
The type of vesicoureteral anastomosis chosen depends on the initial radiological images, the condition of the graft’s ureter, and intraoperative observations. As a general rule, the vesicoureteral anastomosis is made using the Lich–Gregoir technique, with an extravesicular approach. The Leadbetter–Politano technique, which corresponds to an intravesicular reimplantation with the creation of a submucosal tunnel, is preferred when the bladder is small.
4 Radiological Assessment of the Graft
US is the most useful technique for early and late transplant follow-up. Implantation of the graft within the iliac fossa improves its accessibility and makes possible the use of high-frequency probes, which provide high resolution and high Doppler sensitivity. On grayscale US, the normally functioning grafted kidney shows the same corticomedullary differentiation (CMD) as a native kidney (Fig. 2a , b). High-frequency probes (10–15 MHz) show clear separations of all the kidney compartments, the cortex, the outer medulla, and the inner medulla, with a decreasing echogenicity gradient from the capsule to the papilla (Fig. 2c). Color Doppler is now essential for the detection of intra- or extrarenal arterial or venous abnormalities. The entire graft, venous and arterial anastomoses, can be imaged with a 3.5–5 MHz probe (Fig. 3). A high-frequency (7.5–14 MHz) probe allows examination by generating high-resolution images of the anterior distal intrarenal vasculature (interlobular and arcuate arteries), which are better delineated with the power mode. Spectral sampling of renal artery flow and interlobar arteries at two or three levels of the graft is also mandatory in all cases. The renal artery velocity profile is analyzed, and the peak systolic velocity, after angle correction, is measured. Flow sampling of interlobar arteries enables calculation of the resistive index (RI).
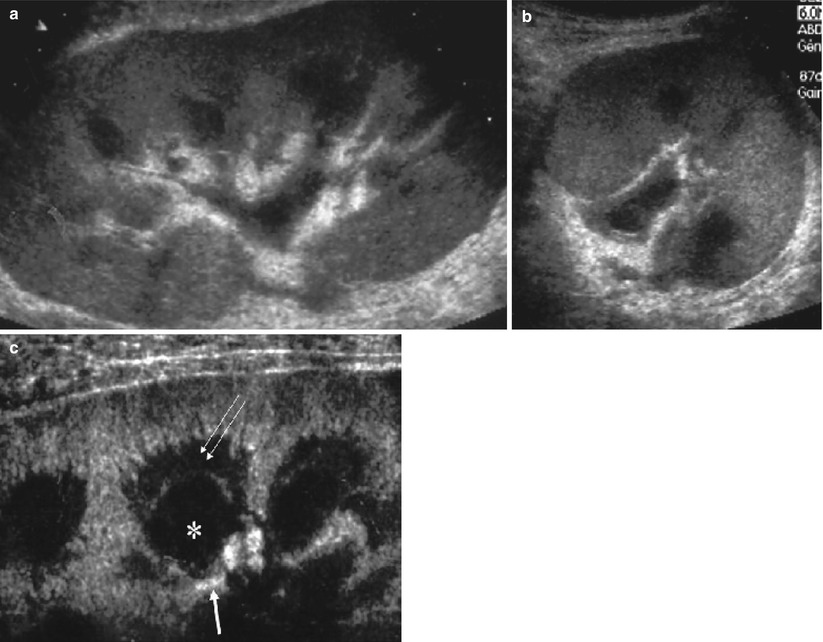
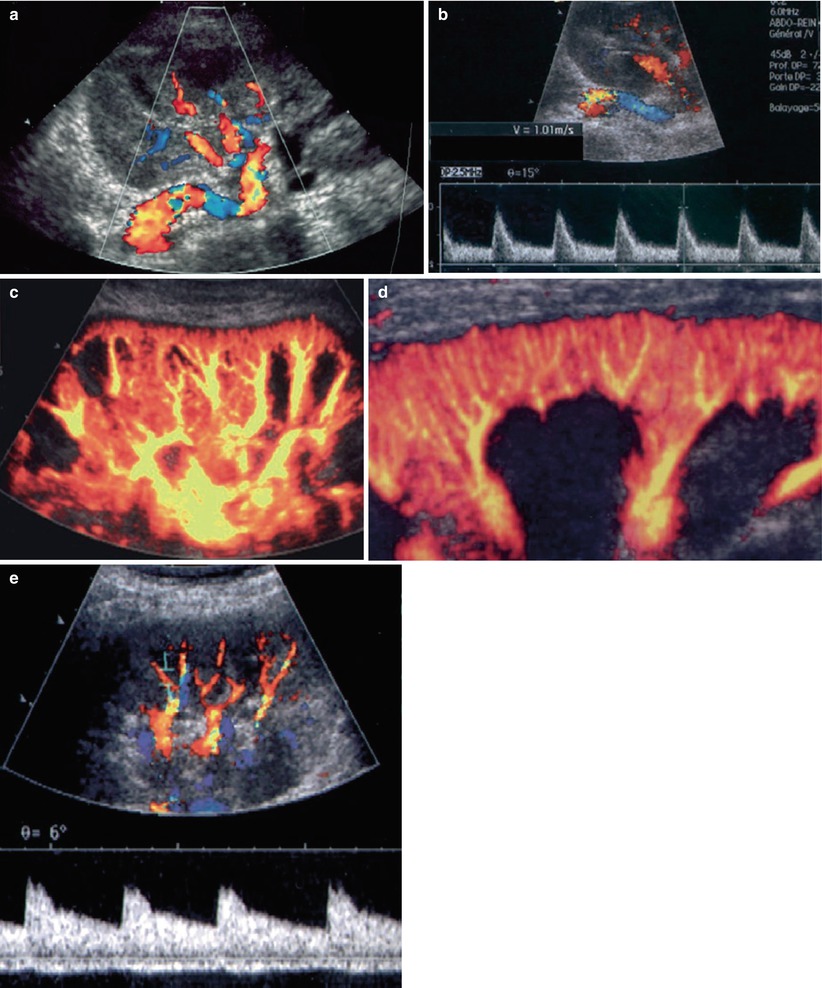
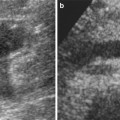
Fig. 2
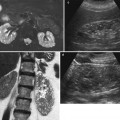
Grayscale ultrasonography of a normal transplant. Low-frequency probes show the normal corticomedullary differentiation on the long (a) and short axes (b) and the wall of pyelocaliceal system within sinus. Using high-frequency probes (c), differentiation between outer medulla (double arrow) and inner medulla (asterisk) above the papilla (thick arrow) becomes possible
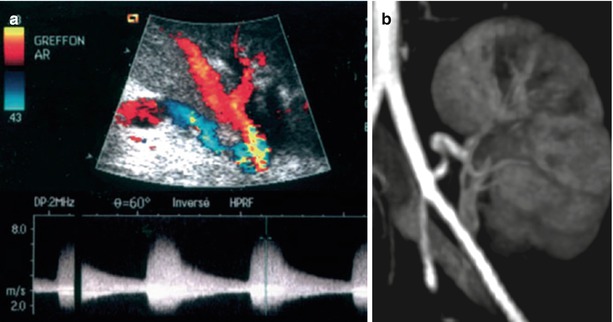
Fig. 3
Color flow ultrasonography of normal transplant: the renal pedicle with a unique renal artery implanted on the primary iliac artery (a). The flow is characterized by low resistance and systolic velocities between 80 and 120 cm/s (b). Using a low-frequency probe (c), intrarenal vasculature must be harmonious, without any defect. With a high-frequency probe (d), the cortical interlobular vessels must be visualized until the capsule. Spectral sampling of interlobar arteries shows a low resistivity of the flow (e)
MRI of the renal graft is performed with body phased-array coils, using adequate sequences for visualizing successively the renal parenchyma and its environment, the vascular tree, and the excretory system (Figs. 4 and 5). On T1-weighted (T1W) (spin-echo or gradient-echo) sequences, the normal CMD is visible on normally functioning kidneys: the medulla generates a lower signal intensity (SI) than the cortex. On T2-weighted (T2W) sequences (usually obtained with a fast spin-echo technique), the medulla generates a higher SI. Gadolinium (Gd) injection gives an accurate delineation of perfused and nonperfused areas of the graft, and high-resolution 3D MR angiograms can be obtained for the entire arterial tree—from the iliac axis to the third- or fourth-order branches. However, the distal vascular tree (from interlobar to interlobular arteries) cannot be visualized. The same 3D sequence must be repeated 5 min after Gd injection (or later if necessary) to obtain MR urograms, and furosemide injection is generally not necessary for that purpose. For patients with severe renal failure, non-contrast-enhanced sequences are now available.
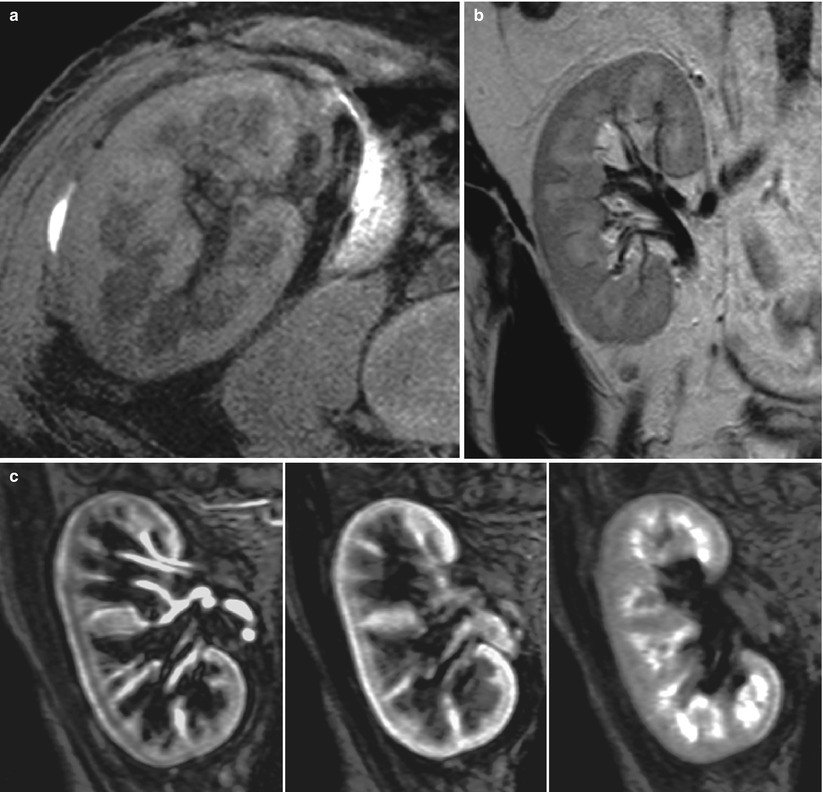
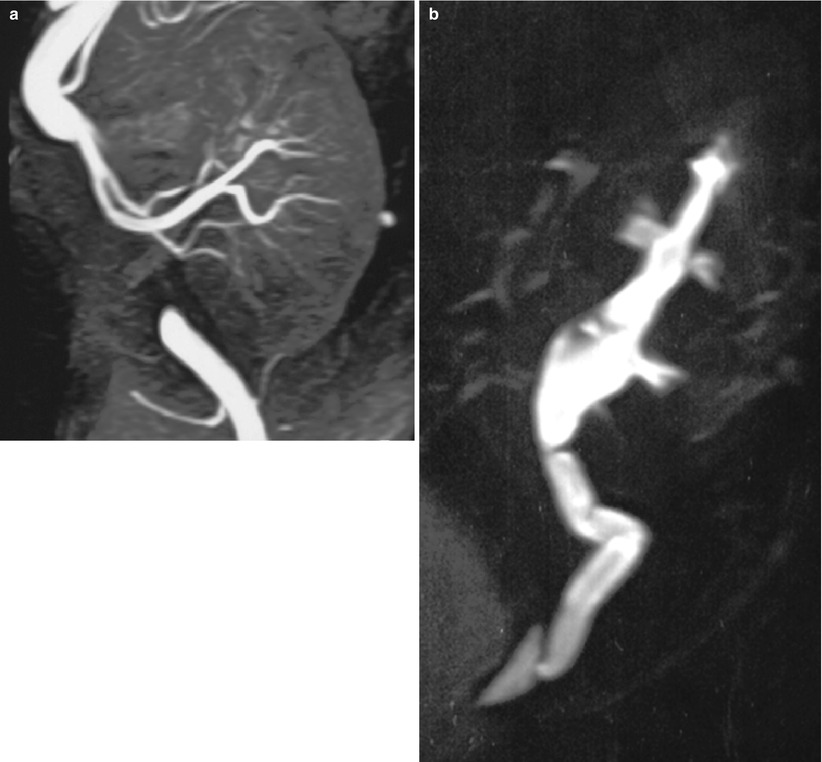
Fig. 4
MR imaging of normal transplant with fat-saturated T1-weighted (a) and T2-weighted (b) sequences. Postgadolinium renal enhancement can be demonstrated dynamically with gradient-echo T1 sequences (c)
Fig. 5
3D contrast-enhanced MR angiography (a) showing renal arteries and anastomotic site and, at a later phase (b), showing upper excretory system (MR urography)
CT has always played a minor role in kidney transplant imaging because it requires normal renal function for the analysis of the renal parenchyma or renal vessels.
5 Early Graft Complications (First Year)
5.1 Urological Complications
Urological complications, often of technical origin, can be a source of morbidity and sometimes mortality after kidney transplantation. The current urological complication rate ranges from 4 to 7 % (Gogus et al. 2002; Kocak et al. 2004) and death is highly unusual.
5.1.1 Urinary Fistulas
The urinary fistula frequency ranges from 1 to 5 %, the most common early complication, occurring during the first 2 weeks after transplantation. The majority of urinary leaks are attributed to ureteral ischemia. The other causes of urinary leaks are failure of vesicoureteral anastomosis or a missed ureteral duplication. Leakage may be suspected when increasing volumes of a clear liquid are collected by drains, while diuresis tends to decline during the days following surgery. Determination of fluid electrolytes, ingestion of methylene blue thereafter found in the fluid collected and US showing a perirenal fluid collection can confirm the diagnosis. US usually finds a well-defined anechoic collection at the lower pole of the kidney (Fig. 6). This fluid appears hypointense on unenhanced T1-weighted MR images and hyperintense on T2W sequences. T2W MR urography shows the collection and the entire dilated excretory system. The differential diagnosis includes lymphoceles, which usually occur later. Chemical analysis of the fluid may suggest the diagnosis if the creatinine concentration is higher than that in the blood. However, the definitive diagnosis of urinoma is based on the demonstration of an extravasation of contrast medium into the collection after intravenous injection. This can be obtained with Gd-enhanced MRI, iodine-enhanced CT, or radionuclides. Urine collection contamination by the contrast agent or the radiotracer often requires delayed imaging (5–15 min after injection) (Fig. 6d, e).
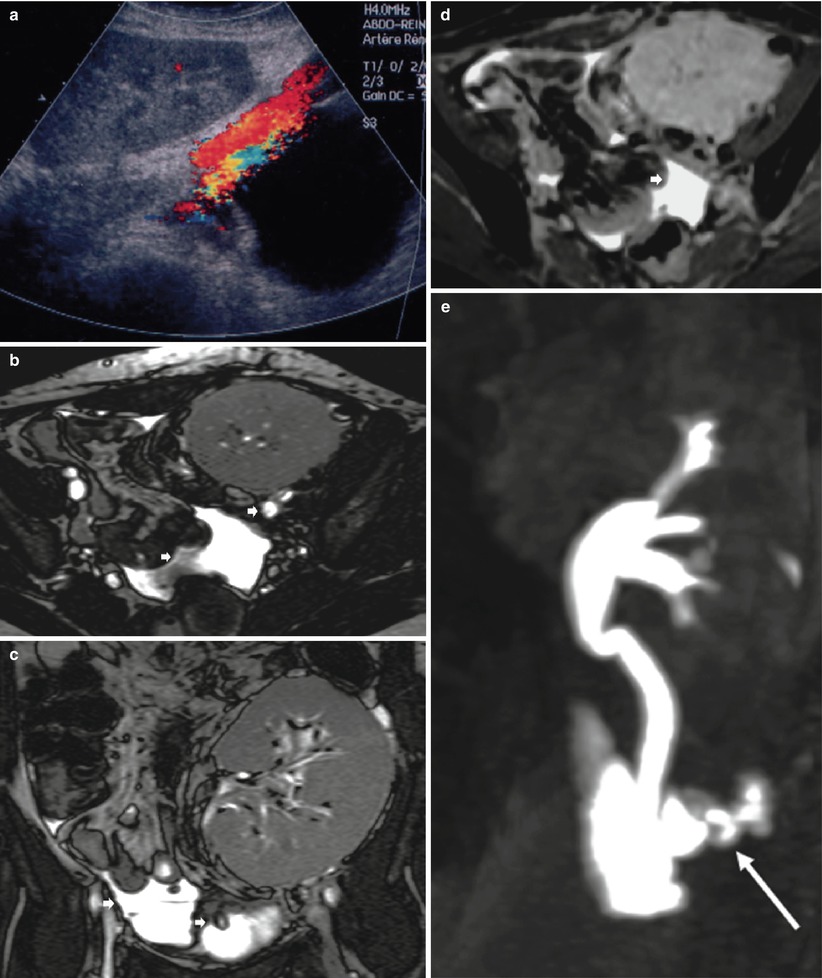
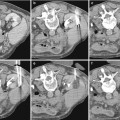
Fig. 6
Urinary leak secondary to ureteral ischemia. Ultrasonography (a) shows a fluid collection between the lower pole of the transplant and the bladder. On T2-weighted axial (b) and coronal (c) images, fluid (short arrow) is noted below the graft and within the peritoneal cavity. The pelvic fluid collection enhances at a late phase (d) after injection of contrast medium. The MR urographic image shows the leak (long arrow) at the ureter–bladder junction (e)
Whereas the treatment of most of these leaks is surgical, small ones can be treated by nephrostomy and/or ureter stenting. Open surgery consists of reimplanting the ureter, with the technique to be used chosen as a function of its remaining healthy length.
5.1.2 Ureteral Stenosis
This complication develops later (several months), and its frequency tends to increase with time, 5 % at 1 year and 10 % at 5 years. In 80 % of the cases, it is the consequence of progressive fibrosis of the vesicoureteral anastomosis, but it can also result from inflammatory infiltration of the ureter wall during rejection. The differential diagnosis includes intraluminal causes of obstruction, such as lithiasis or blood clot, and extraluminal compression by perigraft fluid collections.
The diagnosis is suspected when decreased renal function is associated with dilatation of the collecting system on US (Fig. 7a, b). Differentiation between obstructive and nonobstructive pyelocaliectasis remains difficult, and Doppler RI measurement is neither sensitive nor specific in transplanted kidneys (Platt et al. 1991). Renal scintigraphy may characterize the obstruction when the tracer accumulates within the collecting system on delayed images and by measuring increased clearance time after furosemide injection.
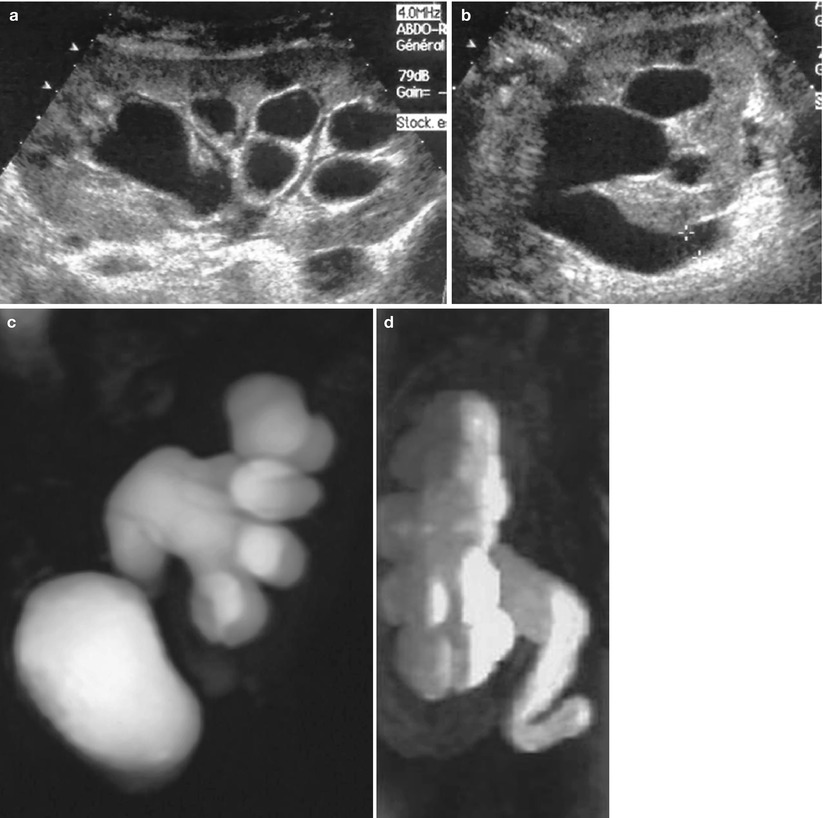
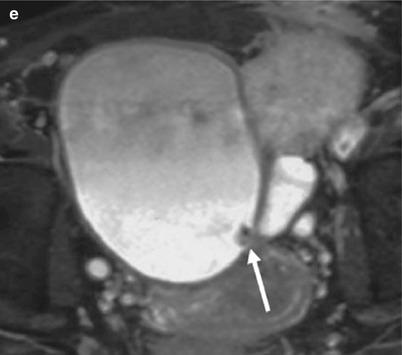
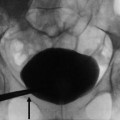
Fig. 7
Urinary obstruction at the level of the vesicoureteral anastomosis. Sonography shows a dilatation of pyelocaliceal system (a) and ureter (b) of renal graft. Ureteropyelectasis is well visualized on 3D T2W (c) and Gd-enhanced T1-weighted (d) MR images. T2W axial section (e) shows a thickened anastomosis due to fibrotic tissue (arrow)
When obstruction is suspected, visualization of the entire upper urinary tract is mandatory to determine its exact location and cause. The least invasive method for that purpose is MR urography because most of these patients have decreased renal function (Fig. 7). Both types of sequences (T2W and Gd-enhanced T1-weighted) have to be obtained. When dilatation is sufficient, T2W sequences demonstrate the entire collecting system up to the anastomosis or the site of obstruction. If not, T1-weighted Gd-enhanced sequences, with delayed acquisitions, usually do.
5.1.3 Graft Infection
Urinary infections are common during the first month following transplantation. They are usually nosocomial bacterial infections, sometimes facilitated by the presence of catheters, which can lead to real pyelonephritis of the graft or the development of renal or perirenal abscesses. Sometimes, perigraft abscesses may be secondary to bacterial contamination of a preexisting fluid collection (hematoma, lymphocele, or urinoma).
US, using B-mode and Doppler techniques, should be performed first and will show a perigraft collection (Fig. 8), often extending toward superficial planes, which, in this context, must always be considered infected. Thin or coarse echoes, sediment, and septa and a thickened hypervascularized peripheral wall are evocative of infection. When infection of a perigraft collection is suspected, contrast-enhanced MRI or CT will help to assess their exact extension before treatment. Fluid aspiration from these collections, under US control, may be necessary for confirmation of the diagnosis, and optimal treatment combines percutaneous or surgical drainage and systemic antibiotic therapy.
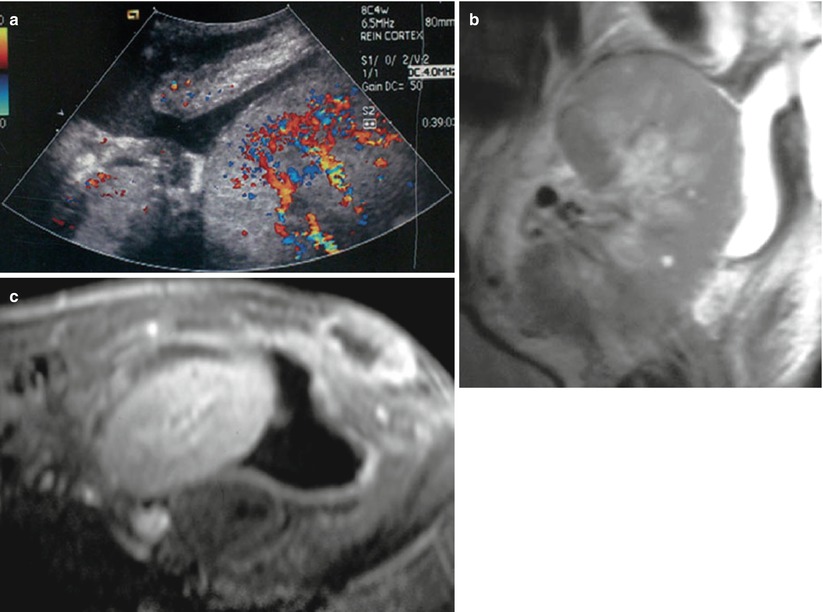
Fig. 8
Perirenal abscess in a patient with graft tenderness and fever. A fluid collection is seen around the graft on color flow sonography, extending through the disrupted abdominal wall to subcutaneous tissues (a). This fluid collection is confirmed by MR imaging on coronal (b) T2W sequence. Peripheral wall of the collection and superficial soft tissue are enhancing after Gd injection (c)
Renal parenchyma infection may be seen as an increased graft volume and/or areas of decreased or increased echogenicity with decreased flow on color Doppler examination (Fig. 9). Gd-enhanced MRI and enhanced CT are able to distinguish between infection and infarction in most of cases, because enhancement is observed in the former and not in the latter, except for a thin peripheral capsular rim.
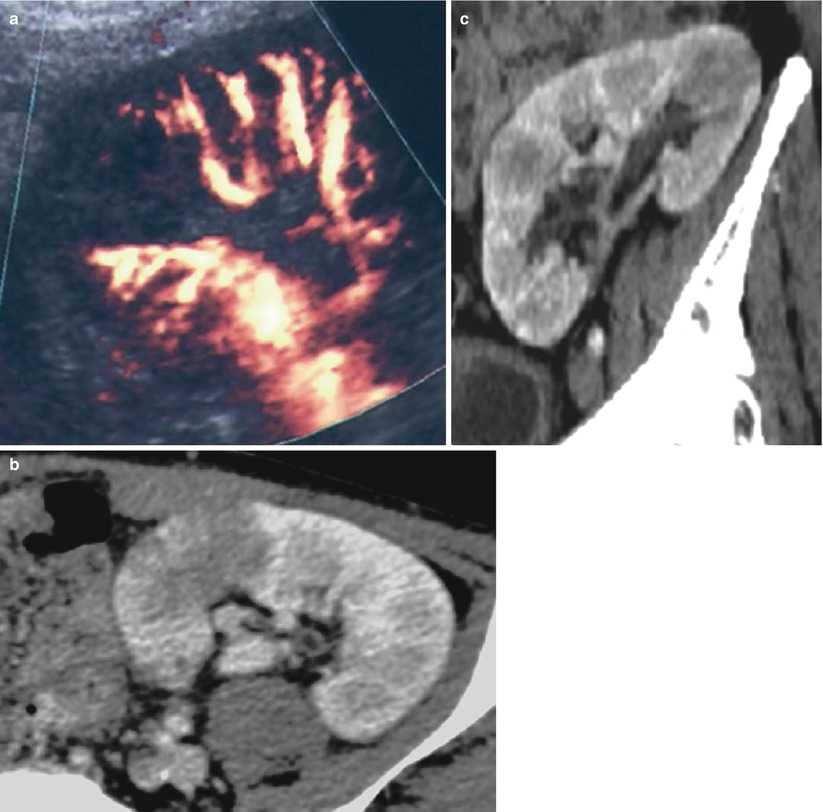
Fig. 9
Pyelonephritis of the transplant. A hypoechoic triangular area is detected at the upper pole of the graft with a hypoperfusion on the color Doppler mode (a). Contrast-enhanced CT (b, c) shows two foci of parenchymal infection
Urinary infections with Corynebacterium urealyticum is uncommon, but can expose the transplant to complications, such as ureteral obstruction, renal abscess formation, or progressive destruction of the graft (Dominguez-Gil et al. 1999). Color Doppler US detects these urothelial calcifications that produce a twinkling artifact within the bladder and/or the upper urinary tract (Fig. 10).
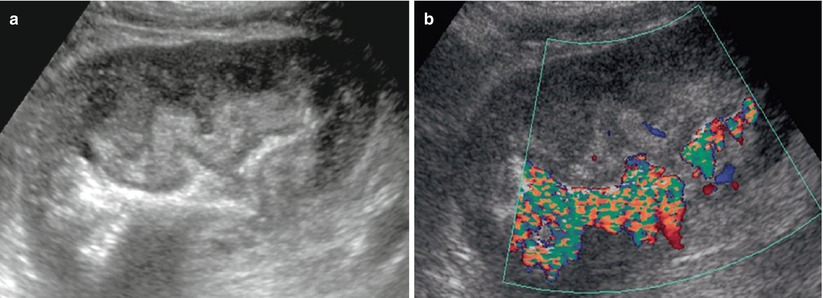
Fig. 10
Corynebacterium infection of the transplant. On the B-mode image, the pyelocaliceal system appears as a hyperechoic linear structure within the sinus fat, without acoustic shadowing (a). The color Doppler mode shows a twinkling artifact along this linear structure (b) (Courtesy of Dr. Derchi, Genoa)
5.1.4 Perigraft Fluid Collections
In addition to those associated with fistulas and perigraft abscesses discussed above, these fluid buildups can be constituted of blood and/or lymph. Postsurgical lymphorrhea causing a lymphocele remains the most frequent cause of perigraft collections, occurring in 1–20 % of renal graft recipients, usually after the fourth week posttransplantation. Sometimes, their volume may cause ureteral or venous compression. On ultrasonograms, a lymphocele appears as a well-defined anechoic collection (Fig. 11a). CT density values and SI on MR sequences (Fig. 11) are typical of simple fluids, without any enhancement after contrast injection. When a lymphocele is responsible for ureteral or venous compression, radical therapy is essential. Simple aspiration and drainage are ineffective because they do not prevent lymph leakage. Therefore, percutaneous drainage must be combined with sclerosis of the cavity by repeated instillations of doxycycline, tetracycline, acetic acid, alcohol, or povidone–iodine. Multiple sessions until daily drainage falls below 10 mL are necessary for larger ones (Karcaaltincaba and Akhan 2005).
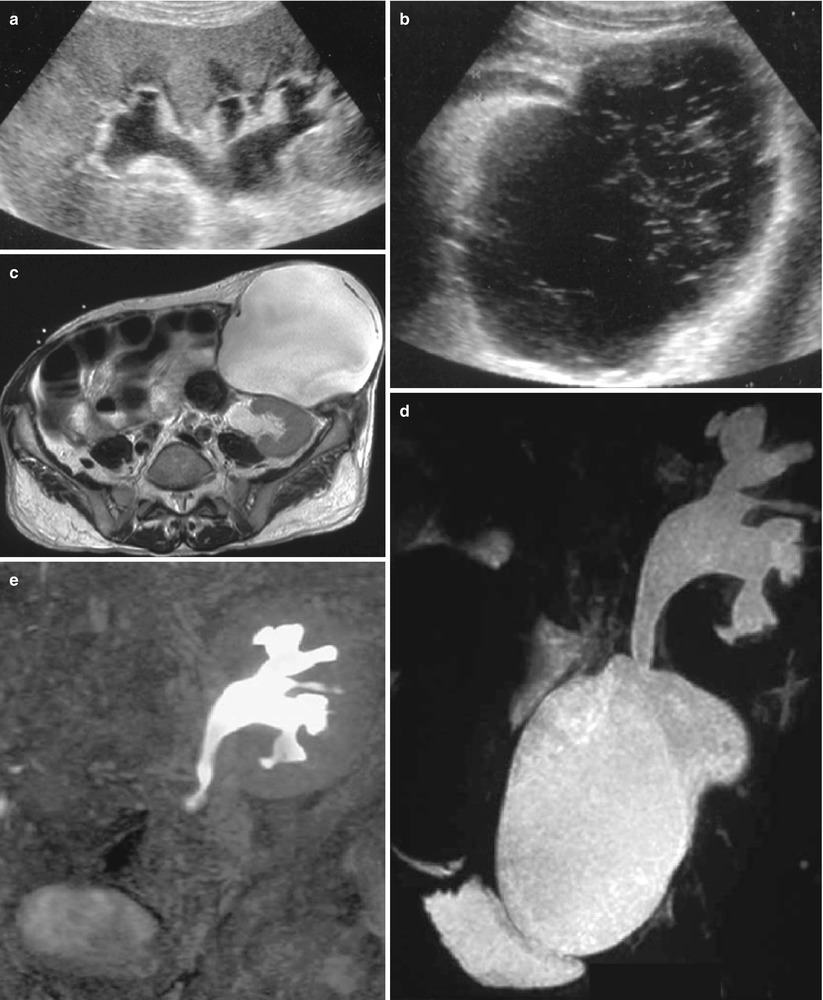
Fig. 11
Perigraft lymphocele responsible for urinary obstruction. On sonography, the pyelocaliceal system (a) and the ureter (b) are dilated due to a pelvic fluid collection showing thin septa. On T2W axial (c) MR images, the collection seats below and in front of the lower pole of the kidney, compressing the ureter. The lymphocele and the obstructed excretory cavities are superimposed on the T2W MR urographic image (d), whereas only the latter appear on the Gd-enhanced T1-weighted MR urographic image (e)
Hematomas account for approximately 9 % of peritransplant collections and usually occur during the immediate postoperative period, due to surgery. The other main causes are as follows: (1) early renal biopsy complicated by a cortical pseudoaneurysm, which may increase in size and subsequently rupture in the perirenal space, occurring immediately (24–48 h) or several weeks after biopsy, and (2) graft rupture secondary to severe acute rejection, which occurs in 3–6 % of renal transplants and during the first 2 weeks after transplantation. During the early postoperative period, hematomas are echogenic collections without flow on US images and are hyperattenuated on unenhanced CT images (Fig. 12). MRI is more specific, showing high intensity on both T1-weighted and T2W sequences (Neimatallah et al. 1999).
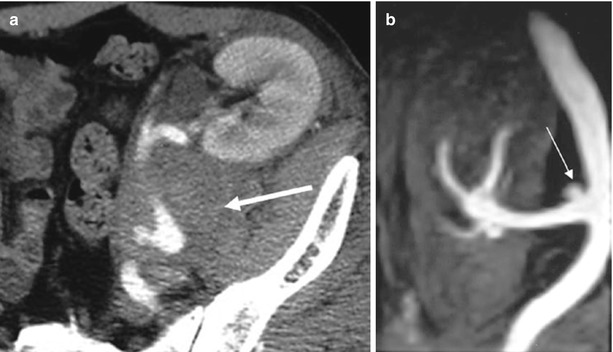
Fig. 12
Perigraft hematoma secondary to the rupture of a mycotic aneurysm. (a) Contrast-enhanced CT shows a dense collection (arrow) at the lower pole of the transplant surrounding the renal artery. (b) Gd-enhanced MR angiography shows the aneurysm (arrow) close to the arterial anastomosis (Reprinted with permission from Trillaud et al. (1998))
5.2 Vascular Complications
5.2.1 Renal Artery Thrombosis
Arterial thrombosis is very unusual, occurring in <1 % of renal graft recipients, but is extremely severe, leading in most cases to graft loss. It occurs early, caused by a hypercoagulable state, hypotension, hyperacute rejection, immunosuppressive therapy, or a surgical complication: anastomotic occlusion, arterial dissection, renal artery kinking when it is too long, or torsion of the renal artery when implanted intraperitoneally. Its diagnosis is suspected soon after transplantation, when severe renal impairment is associated with anuria. Confirmation is easily obtained with color flow Doppler US (Fig. 13) showing arterial flow in the iliac artery; the absence of flow within the entire graft, which is swollen and hypoechoic; and a persistent “to-and-fro” flow pattern within the renal veins (Grenier et al. 1991, 1997). If confirmation is necessary, Gd-enhanced MRI examination can demonstrate the complete devascularization of the graft (Hélénon et al. 1992). Only rapid reintervention, within 12 h for surgical thrombectomy, can save the graft and does so in half of the cases. Percutaneous endovascular revascularization has been described for allograft salvage, but only for late thrombosis (Juvenois et al. 1999).
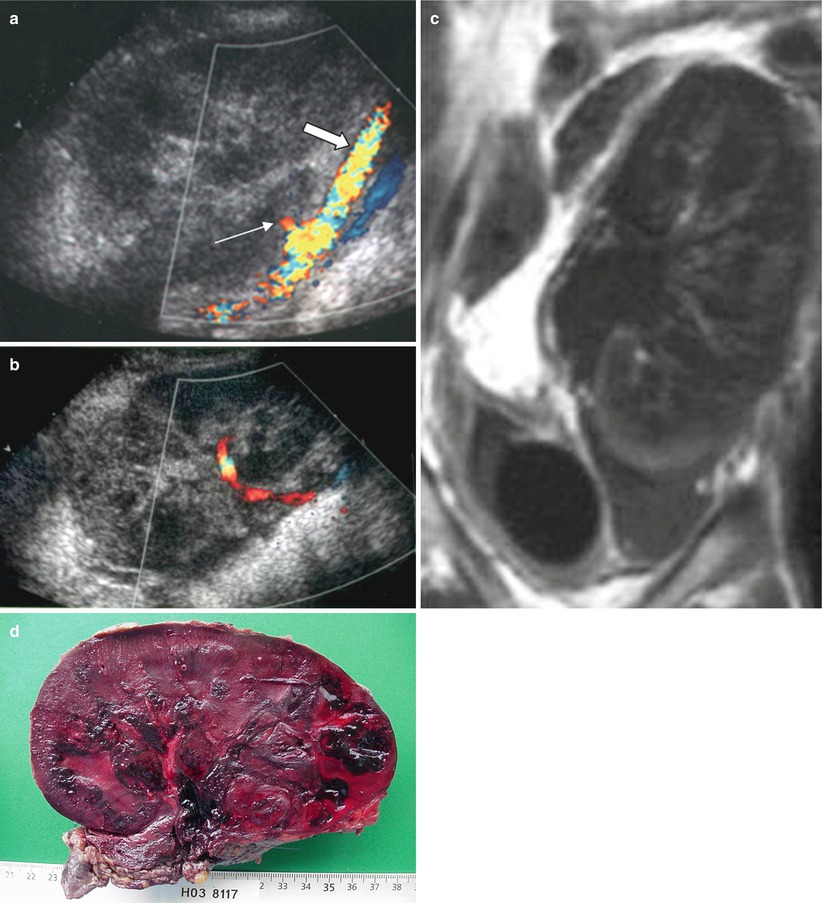
Fig. 13
Renal artery thrombosis. (a) The iliac artery appears patent (thick arrow) on the sagittal section with color flow sonography, whereas no flow is detected within the graft. The stump of the occluded renal artery is visible (thin arrow). (b) More medially, the renal vein is also patent with a to-and-fro flow (with successive blue and red encoding). The contrast-enhanced MR image (c) shows an absence of enhancement within the entire graft. Complete necrosis of the graft was confirmed by the macroscopic examination (d)
5.2.2 Infarctions
Segmental infarcts can also be due to segmental or reimplanted accessory renal artery thrombosis or be associated with acute rejection. They are usually asymptomatic and renal function impairment depends on their size. Doppler US is not specific, showing wedge-shaped areas of decreased or increased echogenicity without flow (Dodd et al. 1991; Grenier et al. 1997) (Fig. 14). Injection of ultrasound contrast agents may help differentiate with infection (Lefevre et al. 2002). Similarly, contrast-enhanced MR images demonstrate the absence of enhancement within the infarcted segments, except for the subcapsular cortex corticis (Neimatallah et al. 1999; Sebastia et al. 2001).
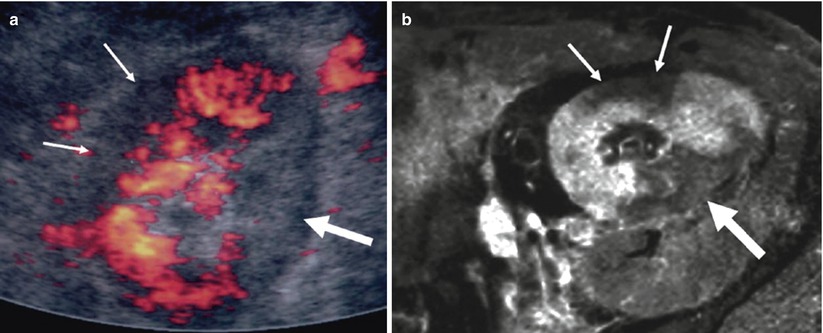
Fig. 14
Intrarenal infarctions. (a) Color Doppler sonographic image showing two renal territories without vascularity, the anterior being hypoechoic (thin arrows) and the posterior hyperechoic (thick arrow), at the upper pole of the kidney. Same pattern is visible on contrast-enhanced T1-weighted MR image (b)
5.2.3 Renal Artery Stenosis
The frequency of renal artery stenosis (RAS) in transplanted kidneys varies from 1 to 23 %, and they may represent around 75 % of all posttransplant vascular complications (Bruno et al. 2004). It develops most often during the first year following surgery. Their origin is multifactorial: atherosclerotic plaque in the donor’s renal artery or in the recipient’s iliac artery; dissection, kinking, or twisting of the renal artery (due to excessive vessel length); malpositioning of the graft; flow turbulences generating intimal hyperplasia; graft perfusion catheter during cannulation causing intimal damage; and wall ischemia due to excessive dissection with destruction of the vasa vasorum. It is also possible that prolonged cold ischemia may play a role through ischemia–reperfusion injury (Halimi et al. 1999; Patel et al. 2001).
Severe hypertension with or without allograft dysfunction is the most frequent clinical symptom. Hypertension is a common feature in transplant recipients (up to 80 %). Therefore, RAS is suspected when hypertension develops suddenly, rapidly becomes more severe and resistant to medical therapy, and is associated with graft dysfunction without any other cause or when associated with an audible bruit over the graft (Palleschi et al. 1980; Rijksen et al. 1982). It may account for around 1–5 % of posttransplant hypertension.
US is able to detect renal artery stenoses (Figs. 15 and 16). Both velocity-profile changes, responsible for spectral broadening and perivascular color artifact, and systolic acceleration must be observed to make this diagnosis. A systolic velocity threshold of 190–200 cm/s (Grenier et al. 1991; Loubeyre et al. 1997) or a systolic velocity ratio between the renal and external iliac arteries of 1.5 (Loubeyre et al. 1997) has been proposed for significant stenoses. When the renal artery is too long, kinking is easily demonstrated on the color display, but only spectral sampling is able to confirm the presence of a stenosis (Fig. 17). As described for the native kidneys, intrarenal sampling of interlobar arteries and looking for dampened waveforms may help detect severe proximal stenosis (Gottlieb et al. 1995). However, these intrarenal features are less useful in transplanted kidneys because the proximal changes are more easily accessible than in the native kidneys.
Get Clinical Tree app for offline access
Fig. 15
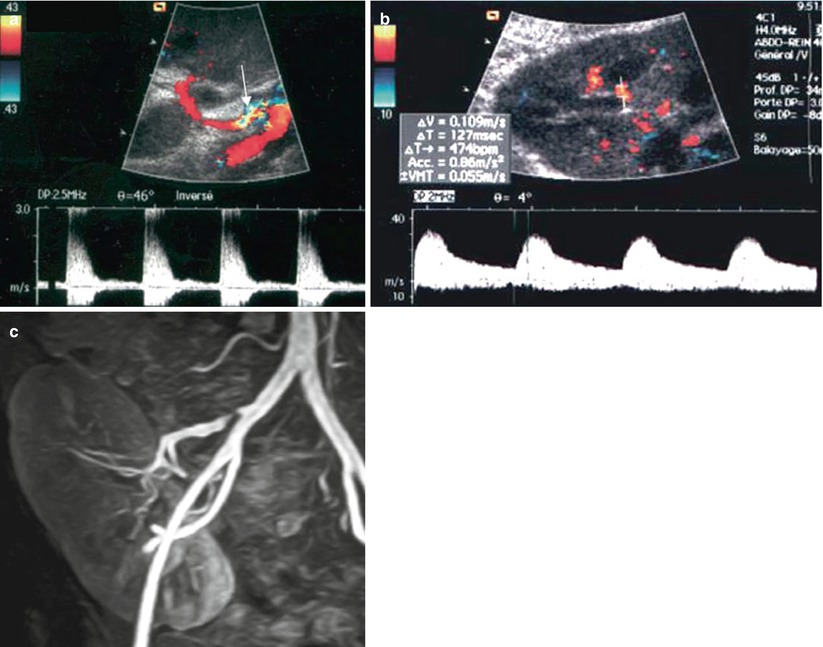
Renal artery stenosis. (a) On color flow sonography, an aliasing phenomenon is present at the proximal portion of the renal artery (arrow). The spectral waveform shows an increased peak systolic velocity (2.8 m/s) with frequency broadening. On the intrarenal interlobar arteries (b), the ascension time is increased at 127 ms. (c) Gd-enhanced MR angiography confirms the postostial renal artery stenosis
Fig. 16
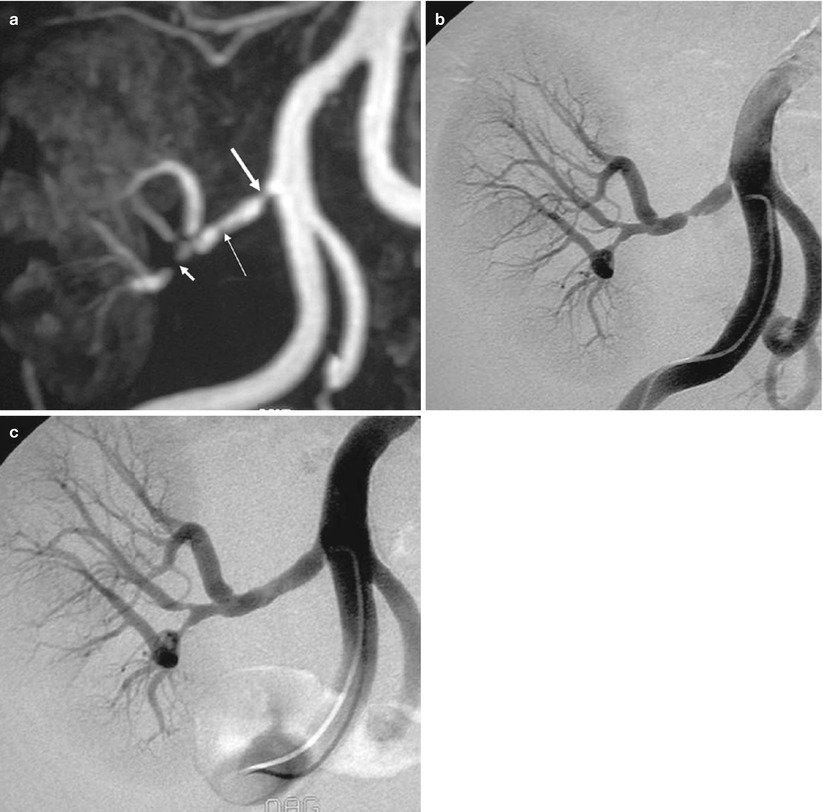
Renal artery stenosis. (a) Gd-enhanced MR angiography shows a significant stenosis immediately after the ostium (thick arrow), a moderate stenosis on the trunk (thin arrow), and a tight stenosis on the lower polar artery (short arrow). (b) DSA confirms the three stenoses, but the stenosis of the trunk appears more severe than on MR angiography. (c) The two proximal stenoses were successfully dilated
Fig. 17
Kinking of the renal artery on color Doppler sonography with a narrowing at the site of plicature (a). Spectral waveform shows a spectral broadening with a high peak systolic velocity. MR angiography (b


Related posts:

Stay updated, free articles. Join our Telegram channel
Full access? Get Clinical Tree
