Trauma
Brooks T. Laselle
John L. Kendall
INTRODUCTION
For many, “trauma ultrasound” is synonymous with “emergency ultrasound.” The use of ultrasound in the evaluation of the traumatically injured patient originated in the 1970s when trauma surgeons in Europe and Japan first described sonography for rapid detection of life-threatening hemorrhage. While the original studies set conservative goals of determining whether ultrasound could in fact detect peritoneal fluid (1, 2, 3), they shortly evolved to a point where ultrasound was lauded as a replacement for diagnostic peritoneal lavage (DPL) (4, 5, 6, 7, 8). This rapid ascension was fueled by evidence that ultrasound could not only accurately detect free fluid in body cavities, but also do it quickly, noninvasively, at the bedside, and without exposing the patient to radiation. The experience of physicians in the United States with ultrasound in the setting of trauma came to publication in the early 1990s as a number of papers reported similar results to those out of Europe and Japan (9). From these studies came the first description of the examination being performed as the “Focused Abdominal Sonography for Trauma,” or the FAST examination (10). Later this terminology was changed to “Focused Assessment with Sonography for Trauma” (11), followed by “Extended Focused Assessment with Sonography in Trauma (EFAST)” (12), but the goal remained the same: the evaluation of trauma patients with the aid of ultrasound.
Beyond a purely historical perspective, trauma ultrasound is also equated with emergency ultrasound due to its widespread acceptance in Emergency Departments (ED). Ultrasound proved to be such a practical and valuable bedside resource for trauma that it received approval by the American College of Surgeons and was incorporated into standard teaching of the Advanced Trauma Life Support curriculum. With this endorsement, the use of ultrasound became a new standard for trauma centers throughout the world. In fact, in many trauma centers bedside ultrasound has become the initial imaging modality used to evaluate the abdomen and chest in patients who present with blunt and penetrating trauma to
the torso. As emergency physicians gained basic ultrasound skills for trauma, it became only natural to expand those skills to other applications. Presently, trauma ultrasound is one of many applications in the evolving field of “Point of Care Ultrasound (POCUS),” which is inclusive of limited, bedside, and emergency ultrasound (13). POCUS is a resource that greatly expands the ability to assess and treat all patients.
the torso. As emergency physicians gained basic ultrasound skills for trauma, it became only natural to expand those skills to other applications. Presently, trauma ultrasound is one of many applications in the evolving field of “Point of Care Ultrasound (POCUS),” which is inclusive of limited, bedside, and emergency ultrasound (13). POCUS is a resource that greatly expands the ability to assess and treat all patients.
CLINICAL APPLICATIONS
The primary goal of the FAST examination in its original description was the noninvasive detection of fluid (blood) within the peritoneal and pericardial spaces. Ultrasound provides a method to detect quantities of fluid within certain spaces that are either undetectable by the physical exam or without the use of other invasive (DPL), expensive [computed tomography (CT)], or potentially delayed (clinical observation) methods. As experience has been gained, trauma ultrasound has been expanded to include assessment for specific solid organ injury and the detection of pleural effusions (hemothorax) and pneumothorax. The clinical scenarios where this information becomes exceedingly useful are in the evaluation of patients with suspected abnormal fluid or air collections in the abdomen or chest. This chapter will discuss the clinical applications, techniques, and use of the EFAST examination as well as expanded applications for those with more advanced skills.
IMAGE ACQUISITION
Equipment
Most EFAST examinations are performed with compact or cart-based systems using multiple transducers that have frequency and depth controls. These controls allow adjustment for a variety of applications and body habitus to optimize imaging. For instance, in larger adults, a lower frequency (2 MHz) may be optimal to allow deeper abdominal imaging, whereas in children and thin adults, a higher frequency (5 MHz) provides improved shallow imaging but limited depth assessment (14).
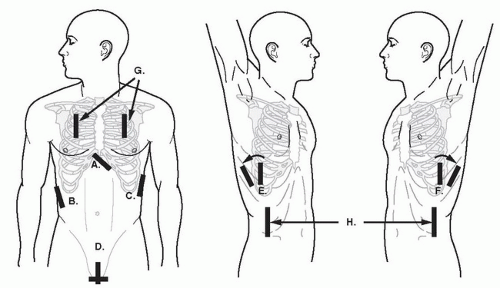 FIGURE 3.1. Transducer Placement for Views of the EFAST Exam. A: Subxyhoid; B: perihepatic; C: perisplenic; D: pelvic; E, F: extended thoracic views; G: thoracic views; H: paracolic gutter views. |
A single general-purpose transducer used for most abdominal scanning is sufficient for the EFAST examination. While the exam can be done with a curvilinear abdominal transducer, a smaller footprint can facilitate imaging between and around ribs, making it easier to assess the upper quadrant, cardiac, and thoracic regions. Some physicians prefer a phased array transducer for cardiac imaging and a high frequency linear transducer (with better near field resolution) for the detection of pneumothorax and for procedural guidance.
Timing and Speed
The acronym “EFAST” suggests a quick survey of the peritoneal, thoracic, and pericardial areas. Usually, the exam can be completed in 3 to 5 minutes, and is done simultaneously with resuscitation or as part of the secondary survey in the stable patient. Though the study should be done relatively quickly, this does not mean that the ultrasound exam should be done haphazardly (15). The transducer should be maneuvered to insure a thorough, three-dimensional assessment of each area of interest. This involves a combination of sliding, angling, and rotating the transducer 90 degrees to assess structures in two planes.
For archiving purposes, typically a representative, static image of a region is frozen and saved digitally or printed to paper. If possible, however, a short video clip is preferred, because it provides more detailed information about the visualized structures.
Basic Exam
Perihepatic (right upper quadrant)
Perisplenic (left upper quadrant)
Pelvic (pouch of Douglas or retrovesicular)
Pericardial (cardiac)
Paracolic gutters (bilateral)
Thoracic (bilateral)
Perihepatic
The right upper quadrant view, also known as the Morison’s pouch or perihepatic view, is commonly viewed as the classic image of trauma ultrasound. It allows for visualization of free fluid in the potential space between the liver and right kidney. In addition, fluid above and below the diaphragm in the costophrenic angle or subdiaphragmatic space can be seen. The transducer is initially placed in a coronal orientation in the midaxillary line over an intercostal space of one of the lower ribs (Fig. 3.2). The indicator on the transducer should be directed toward the patient’s head. Once Morison’s pouch is visualized (Fig. 3.3), the transducer should be angled in all directions to fully visualize the potential spaces of the right upper quadrant ( VIDEO 3.1A). Angling anteriorly and posteriorly will allow for the complete interrogation of Morison’s pouch. The sonographer will need to manipulate the transducer to minimize artifact from the ribs. The real-time image can be optimized by gently rocking the transducer to create a mental three-dimensional view of the space. In addition, the transducer can be directed cephalad to visualize the thoracic (supradiaphragmatic) and subdiaphragmatic areas (Fig. 3.4). Moving the transducer caudad brings the inferior pole of the kidney and the superior aspect of the right paracolic gutter into view (Fig. 3.5).
VIDEO 3.1A). Angling anteriorly and posteriorly will allow for the complete interrogation of Morison’s pouch. The sonographer will need to manipulate the transducer to minimize artifact from the ribs. The real-time image can be optimized by gently rocking the transducer to create a mental three-dimensional view of the space. In addition, the transducer can be directed cephalad to visualize the thoracic (supradiaphragmatic) and subdiaphragmatic areas (Fig. 3.4). Moving the transducer caudad brings the inferior pole of the kidney and the superior aspect of the right paracolic gutter into view (Fig. 3.5).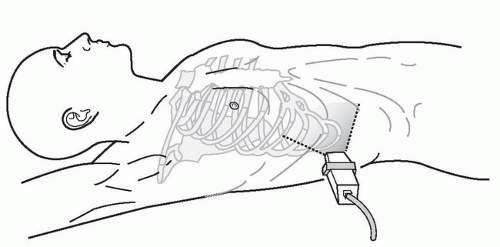 FIGURE 3.2. Right Upper Quadrant Transducer Positioning for the FAST Exam. |
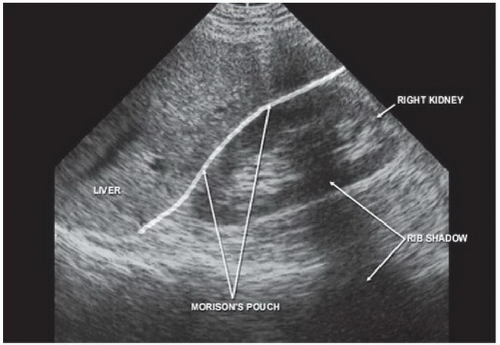 FIGURE 3.3. Ultrasound Image Demonstrating Normal Appearance of Morison’s Pouch. |
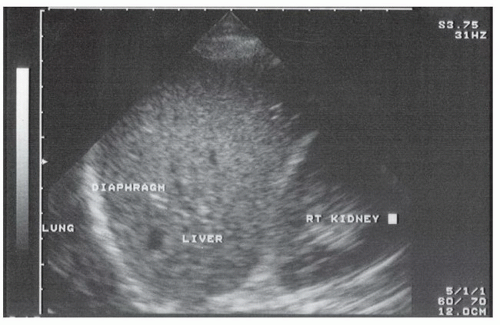 FIGURE 3.4. Normal Ultrasound Anatomy of the Right Subdiaphragmatic Space. |
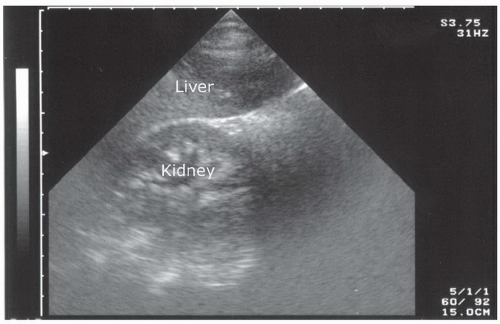 FIGURE 3.5. Normal Inferior Pole of the Right Kidney and the Paracolic Gutter. |
Perisplenic
The left upper quadrant view is also known as the perisplenic or, less accurately, the splenorenal view. It can be challenging to obtain because the spleen does not provide as large a sonographic window as the liver, and the examiner frequently needs to reach across the patient in order to access the left upper quadrant. In contrast to the perihepatic view, ideal placement of the transducer in the left upper quadrant is generally more cephalad and posterior. A good starting point is the posterior axillary line in the 9th and 10th intercostal space (Fig. 3.6). The indicator should be directed toward the patient’s head. If the splenorenal space
is not visualized, it is typically because the transducer is not posterior or superior enough, so movement in either or both of these directions will improve the image. The transducer should be angled to see the anterior, posterior, superior, and inferior portions of the perisplenic space. Important landmarks to visualize include the spleen-kidney interface (Fig. 3.7; VIDEO 3.1B), the spleen-diaphragm interface (Fig. 3.8), and the inferior pole of the kidney-paracolic gutter transition (Fig. 3.9). In addition, the transducer should be directed cephalad to better visualize the thoracic (supradiaphragmatic) area.
is not visualized, it is typically because the transducer is not posterior or superior enough, so movement in either or both of these directions will improve the image. The transducer should be angled to see the anterior, posterior, superior, and inferior portions of the perisplenic space. Important landmarks to visualize include the spleen-kidney interface (Fig. 3.7;
VIDEO 3.1B), the spleen-diaphragm interface (Fig. 3.8), and the inferior pole of the kidney-paracolic gutter transition (Fig. 3.9). In addition, the transducer should be directed cephalad to better visualize the thoracic (supradiaphragmatic) area.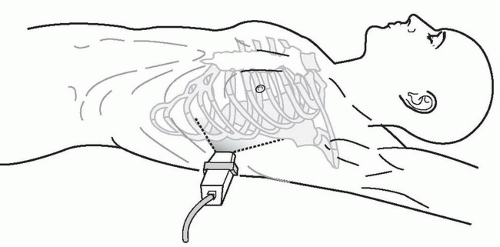 FIGURE 3.6. Left Upper Quadrant Transducer Positioning for the FAST Exam. |
Pelvic
The pelvis is an important and potentially underappreciated area for detecting free peritoneal fluid. Since it is one of the most dependent and easily visualized portions of the peritoneal cavity, fluid collections may be seen here before being detected in other areas (Fig. 3.10). As well, it is away from the chest and upper abdomen, so images can be obtained simultaneously with the evaluation and resuscitation of the trauma patient. The key to success is scanning through a moderately full bladder to facilitate visualization of the underlying and adjacent structures, so imaging should be done before placement of a Foley catheter or spontaneous voiding. The transducer is initially placed just superior to the symphysis pubis in a transverse orientation with the indicator directed to the patient’s right (Fig. 3.11A, B). From here the transducer can be angled cephalad, caudad, and side-toside to fully visualize the perivesicular area. It is also important to image the bladder in a sagittal orientation. To obtain this view, the transducer should be rotated clockwise, directing the indicator toward the patient’s head (Fig. 3.11B). The transducer can then be angled side to side, superiorly and inferiorly to gain a full appreciation of the perivesicular area (Fig. 3.11C, D;  VIDEO 3.2).
VIDEO 3.2).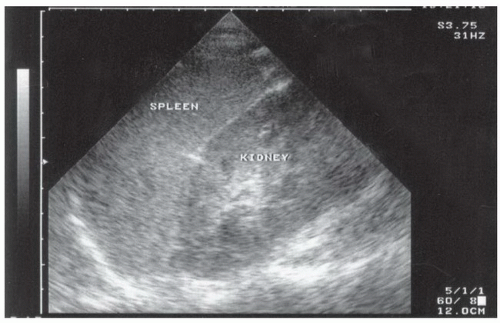 FIGURE 3.7. Normal Ultrasound Image of the Spleen and Left Kidney. |
 FIGURE 3.8. Normal Sonographic Anatomy Visualized in the Left Subdiaphragmatic Space. |
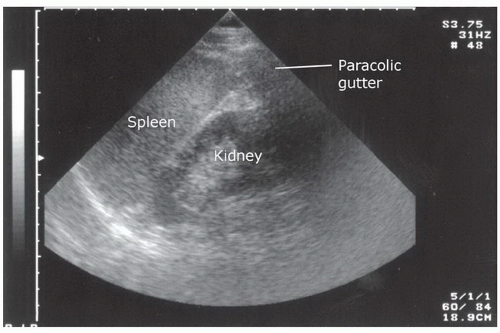 FIGURE 3.9. Normal Appearance of the Inferior Pole of the Left Kidney and the Paracolic Gutter. |
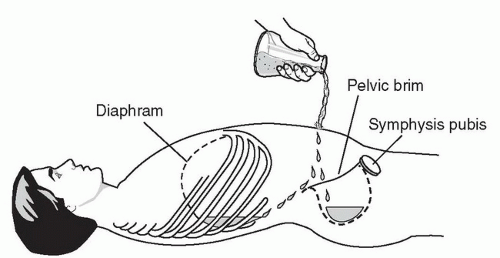 FIGURE 3.10. Locations of the Dependent Areas of the Peritoneal Cavity. |
Pericardial
The subxyphoid and the parasternal long views are the most commonly used and convenient ways to visualize the pericardial area. The four-chamber subxyphoid view is performed with the transducer oriented transversely in the subcostal region and the indicator directed to the patient’s right. The transducer should be held almost parallel to the skin of the anterior torso as it is pointed to a location just to the left of the sternum toward the patient’s head (Fig. 3.12A). Gas in the stomach frequently obscures views of the heart, but this can be minimized by using the left lobe of the liver as an acoustic window. This is accomplished by moving the transducer further to the patient’s right. The liver should come into view, as well as the interface between the liver and the right side of the heart (Fig. 3.12B;  VIDEO 3.3A). Alternatively, the parasternal long axis view is performed by placing the transducer to the left of the sternum, in the fourth, fifth or sixth intercostal space (Fig. 3.12C). The transducer is rotated slightly so that the indicator is pointed toward the patient’s right shoulder, yielding a long-axis
view of the heart (Fig. 3.12D; VIDEO 3.3B). The transducer may be slid cephalad or caudad to improve visualization of the heart. Alternative views may aid in the cardiac assessment when difficulty is encountered with these approaches. A more detailed discussion on obtaining alternative cardiac views can be found in the echochardiography chapter (Chapter 4).
VIDEO 3.3A). Alternatively, the parasternal long axis view is performed by placing the transducer to the left of the sternum, in the fourth, fifth or sixth intercostal space (Fig. 3.12C). The transducer is rotated slightly so that the indicator is pointed toward the patient’s right shoulder, yielding a long-axis view of the heart (Fig. 3.12D;
VIDEO 3.3B). The transducer may be slid cephalad or caudad to improve visualization of the heart. Alternative views may aid in the cardiac assessment when difficulty is encountered with these approaches. A more detailed discussion on obtaining alternative cardiac views can be found in the echochardiography chapter (Chapter 4). FIGURE 3.11. Transverse (A) and sagittal (B) pelvic transducer positioning for the FAST exam. C: Normal transverse transabdominal anatomy of a male bladder. D: Normal sagittal transabdominal anatomy of a male bladder. |
Paracolic gutters
Assessing the paracolic gutters may increase the sensitivity of the standard FAST examination for the detection of peritoneal fluid. This is done by placing the transducer in the upper quadrant in a coronal plane and then sliding it caudally from the inferior pole of the kidney (Fig. 3.13A, B;  VIDEO 3.4A, B). Alternatively, the transducer can be placed in a transverse orientation medial to the iliac crests. It can be angled inferiorly and superiorly to assess for the presence of loops of bowel outlined by peritoneal fluid.
VIDEO 3.4A, B). Alternatively, the transducer can be placed in a transverse orientation medial to the iliac crests. It can be angled inferiorly and superiorly to assess for the presence of loops of bowel outlined by peritoneal fluid.Thoracic
Costrophrenic angle or pleural base
The sonographic evaluation of the pleural interface for fluid is an important adaptation of the right and left upper quadrant views described in the standard FAST exam. The transducer is initially placed in position to obtain a right or left upper quadrant view. It is then angled or moved superiorly to visualize the diaphragm and supradiaphragmatic space of the thorax (Fig. 3.14A, B;  VIDEO 3.5). The region immediately above the diaphragm should be imaged to detect fluid. In the normal patient, air from lung tissue will scatter the signal and create shadowing and artifact. When pleural fluid is present it can be visualized above the diaphragm. Visualization can be improved if the liver or spleen is used as an acoustic window to the pleural space (Fig. 3.15), but even with optimal transducer placement, only a small portion of the pleural space is typically accessible in patients without pathology.
VIDEO 3.5). The region immediately above the diaphragm should be imaged to detect fluid. In the normal patient, air from lung tissue will scatter the signal and create shadowing and artifact. When pleural fluid is present it can be visualized above the diaphragm. Visualization can be improved if the liver or spleen is used as an acoustic window to the pleural space (Fig. 3.15), but even with optimal transducer placement, only a small portion of the pleural space is typically accessible in patients without pathology.Anterior thorax (pneumothorax)
Interrogation of the anterior pleura for the presence of pneumothorax can be done with a number of transducers. There is no consensus on the exact placement of the transducer or the minimum number of rib interspaces to investigate, but a recent evidence-based consensus statement recommended “exploration of the least gravitationally dependent areas progressing more laterally” (19). A reasonable approach in the supine trauma patient is to begin with the transducer oriented in the sagittal plane placed in the midclavicular line over the third or fourth intercostal space (Fig. 3.16A). A proper sagittal image should portray at least two ribs and the pleural line immediately deep to the posterior aspect of the ribs. When performed correctly, the image created is termed the “bat wing” sign, with the body of the bat represented by the pleural line, and the wings represented by the ribs (Fig. 3.16B;  VIDEO 3.6). In most cases, an anterior chest assessment will rule out a large pneumothorax, but a more thorough assessment is required to exclude small or loculated pneumothoraces.
VIDEO 3.6). In most cases, an anterior chest assessment will rule out a large pneumothorax, but a more thorough assessment is required to exclude small or loculated pneumothoraces.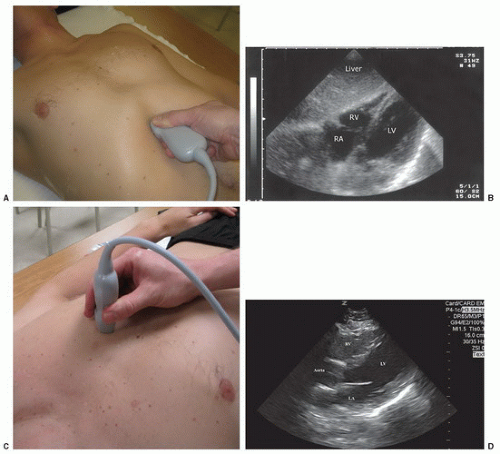 FIGURE 3.12. A: Subxyphoid transducer position for the FAST exam. B: Normal ultrasound anatomy visualized from the subxyphoid transducer position. RV, right ventricle; RA, right atrium; LV, left ventricle. C: Parasternal long axis transducer postion for the FAST exam. D: Normal ultrasound anatomy visualized from the parasternal long axis transducer position. |
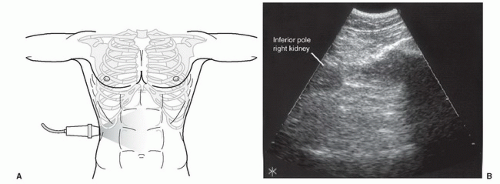 FIGURE 3.13. A: Right paracolic gutter transducer position for the FAST exam. B: Typical ultrasound appearance of the paracolic gutter. |
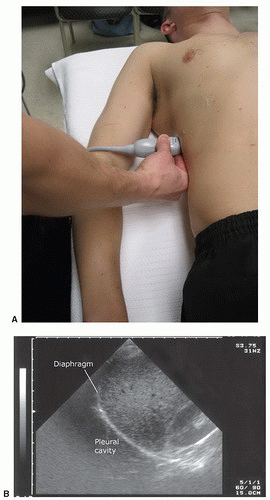 FIGURE 3.14. A: Pleural base transducer position for the FAST exam. B: Sonographic appearance of the inferior aspect of a normal pleural cavity. |
Order
While there is no current standard for the order in which the views of the EFAST examination are obtained, arguments have been made for starting with certain windows. For instance, the right upper quadrant view is a common starting point because it is one of the most sensitive and specific locations for detecting hemoperitoneum, and many physicians routinely scan from the patient’s right side (20, 21, 22). Alternatively, the pelvic view may be the first view obtained, as it is one of the most dependent portions of the peritoneal cavity, so smaller fluid collections may be detected here before other locations (20). As well, placement of a urinary catheter to decompress the bladder essentially eliminates the sonographic window to the pelvis, so there is a priority in obtaining this window before the Foley is placed. One could argue that the left-upper quadrant is a reasonable starting location in cases of blunt abdominal trauma because the spleen is the most commonly injured organ and the left upper quadrant is the most likely positive location in splenic injury (23). Finally, particularly for penetrating trauma, there is merit in first evaluating the area with the most concerning or obvious injury. For example, if the patient has penetrating trauma to the chest, the exam might begin with evaluations for pericardial effusion and hemopneumothorax. All in all, there is no standard order for performing the EFAST examination, and in many instances the order will be dictated by the patient’s clinical presentation and institutional preferences.
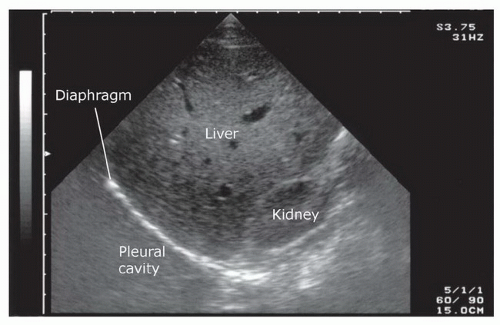 FIGURE 3.15. Ultrasound Image of the Liver as an Acoustic Window to the Costophrenic Angle. Note how the scan plane uses as much of the liver tissue as possible to view the pleural base. |
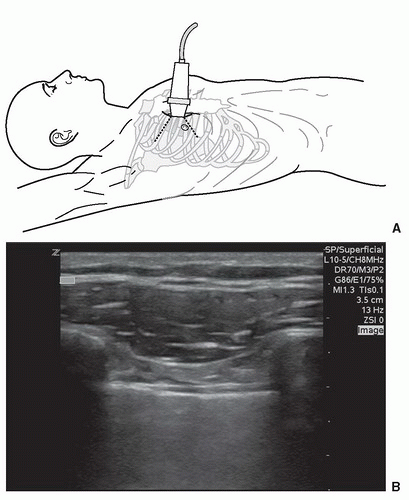 FIGURE 3.16. A: Anterior thorax transducer placement for the evaluation of pneumothorax. B: Sonographic appearance of the normal anterior chest wall, ribs, and pleural interface in a sagittal plane, demonstrating the “bat wing” sign. |
NORMAL ULTRASOUND ANATOMY
Peritoneal Space
The basic FAST examination requires the sonographer to be familiar with the sonographic appearance of the major abdominal solid viscera (liver, spleen, uterus), to have the ability to recognize fluid collections in potential spaces, and to have the technical ability to acquire standard FAST examination views. The most important skill for trauma ultrasound of the abdomen is the ability to detect free fluid in the potential recesses within the peritoneal cavity (Fig. 3.17). These include the perihepatic space, the perisplenic space, the paracolic gutters, and the pelvis.
Liver and Gallbladder
The normal liver has a homogeneous, medium-level echogenicity (Fig. 3.18). Glissen’s capsule outlines the liver with an echogenic, defined border. The liver parenchyma is punctuated by a variety of vascular and biliary vessels that appear as anechoic linear structures. A detailed knowledge of the hepatic architecture is helpful, but not necessary because the FAST exam relies only on recognizing normal homogenous hepatic architecture from a disrupted or inhomogenous pattern of a traumatized liver.
The gallbladder is a round or oval cystic structure within the liver. It is located on the medial, inferior surface of the liver, and will commonly be seen during scanning of the perihepatic area if the transducer is angled anteriorly from Morison’s pouch (Fig. 3.19). It is not necessary to identify the gallbladder during the FAST exam, although the gallbladder may be seen to float in free fluid and may be sonographically enhanced by surrounding fluid. As the gallbladder is, itself, fluid filled, it is important to recognize the differences between fluid in the gallbladder and free intraperitoneal fluid.
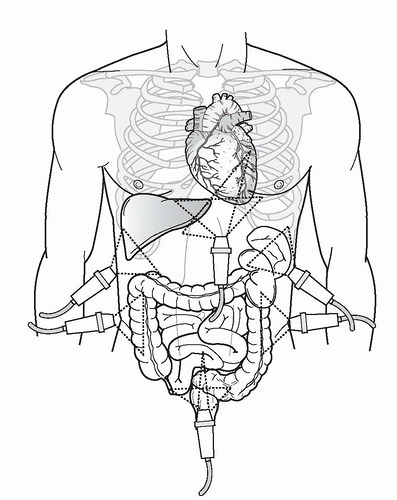 FIGURE 3.17. Typical Transducer Positions Used to Evaluate Potential Spaces within the Peritoneal Cavity. |
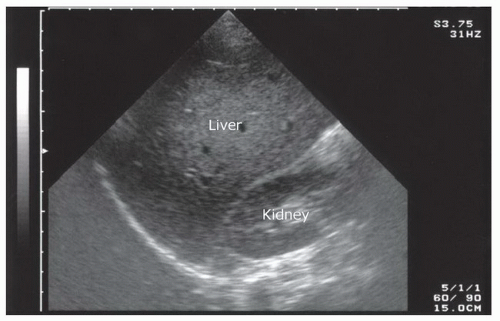 FIGURE 3.18. Ultrasound Image Demonstrating the Appearance of Normal Liver Tissue. |
Spleen
The spleen is a solid organ with a homogenous cortex and echogenic capsule and hilum (Fig. 3.20). It has a mediumgray echotexture similar to that of the liver, but is smaller in size. The vessels within the parenchyma are less apparent than those in the liver. Since the spleen occupies a posterior-lateral location, it may be difficult to assess the entirety of the parenchyma using a single transducer location, and multiple planes may be needed to visualize the whole organ.
Bowel
The bowel can have a number of different sonographic appearances, depending upon its contents. Air within the lumen
of the bowel creates gray shadows that distort the view of surrounding structures. This distortion often makes it difficult to achieve fine resolution of the image. When the bowel is filled with fluid or solid matter, it can appear to be cystic or solid. However, with brief observation, bowel typically reveals visible peristaltic waves. When free fluid is present, anechoic spaces may separate loops of bowel and mesentery, creating a confusing pattern to the novice eye. Loops of bowel may bob about with percussion of the abdomen or movement of the ultrasound transducer.
of the bowel creates gray shadows that distort the view of surrounding structures. This distortion often makes it difficult to achieve fine resolution of the image. When the bowel is filled with fluid or solid matter, it can appear to be cystic or solid. However, with brief observation, bowel typically reveals visible peristaltic waves. When free fluid is present, anechoic spaces may separate loops of bowel and mesentery, creating a confusing pattern to the novice eye. Loops of bowel may bob about with percussion of the abdomen or movement of the ultrasound transducer.
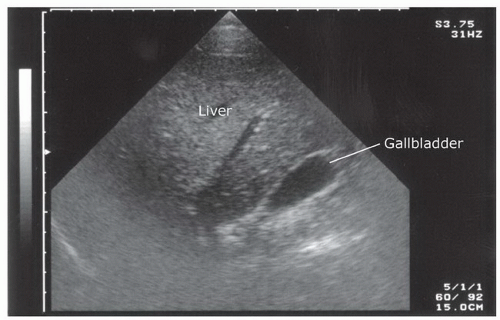 FIGURE 3.19. Sonographic Appearance of the Gallbladder while Scanning in the Perihepatic Region. |
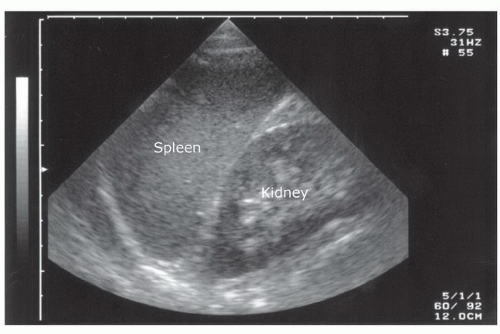 FIGURE 3.20. Ultrasound Image Demonstrating the Appearance of Normal Splenic Parenchyma. |
Kidneys
The kidneys are paired retroperitoneal organs that have a distinct sonographic appearance. They are visualized immediately inferior to the liver and spleen. The outer surface (Gerota’s fascia) appears as an echogenic coating that surrounds the renal cortex. The cortex itself has a medium-gray echotexture that is slightly hypoechoic compared to the hepatic and splenic parenchyma (Fig. 3.21). The central renal sinus is typically echogenic, unless there is a component of hydronephrosis, which, depending on the degree of obstruction will appear anechoic (Fig. 3.22).
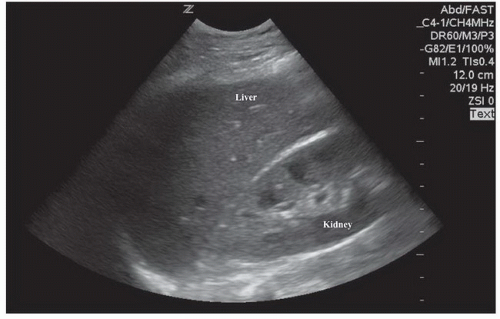 FIGURE 3.21. Ultrasound Image Demonstrating the Appearance of Normal Renal Parenchyma. |
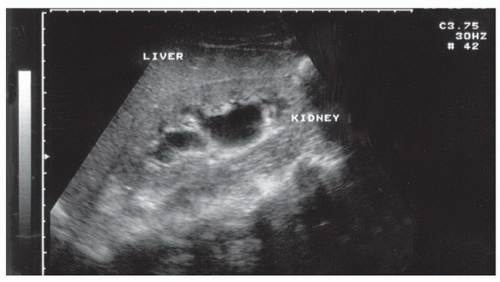 FIGURE 3.22. Ultrasound Taken from a Patient with Moderate Hydronephrosis. |
Uterus
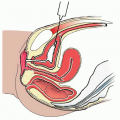
The uterus is the major identifiable organ within the female pelvis. When viewed in its long axis (in the sagittal orientation), it has a pear-shaped appearance and is located superior and posterior to the bladder. The cul-de-sac is posterior to the lower uterine segment and cervix and represents the most dependent peritoneal space where free fluid is likely to accumulate (Fig. 3.23).
Bladder
The bladder is a partially retroperitoneal organ that is the most sonographically visible portion of the lower urinary tract. It occupies the midline in the lower pelvis, typically at or below the pubic symphysis. When the bladder is empty visualization is difficult, but may be improved by directing the transducer inferior and posterior to the pubic ramus. When full, the distended bladder provides an excellent acoustic window to pelvic structures (Fig. 3.24). It is important to distinguish between fluid in the bladder and free intraperitoneal fluid.
Thorax
Pericardium
The pericardium is usually seen as an echogenic lining surrounding the heart. When pericardial fluid is absent, the parietal pericardium and the visceral pericardium are usually indistinguishable and are seen as a single echogenic structure. On occasion, the space between the parietal pericardium and visceral pericardium will have a small amount of epicardial fat or may contain fluid (Fig. 3.25).
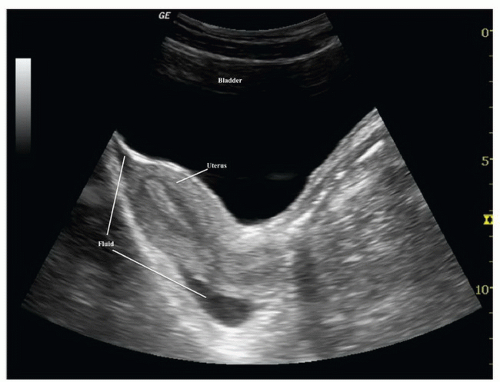 FIGURE 3.23. Transabdomonal Ultrasound Image Demonstrating the Cervix and Pelvic Cul-De-Sac. |
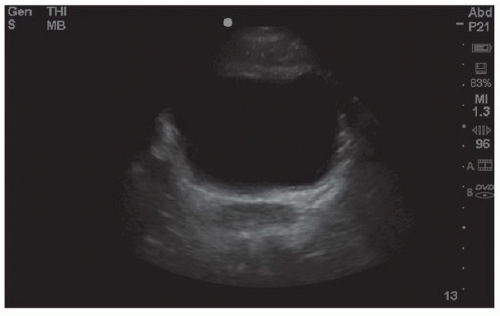 FIGURE 3.24. Transabdominal Pelvic Ultrasound in a Male with a Full Bladder in the Transverse Orientation. |
Cardiac chambers
The chambers of the heart have very distinct locations and appearances. The base of the heart, which includes the atria and major valves, lies slightly rightward and posterior, while the apex of the heart points to the left, anteriorly and inferiorly. The right-sided chambers have thin walls that can collapse when pressure within the pericardial space is elevated, as in the case of a pericardial effusion. The left ventricle has a thicker wall and is usually larger than its counterpart on the right (Fig. 3.26). Although a number of transducer positions can be used, the EFAST examination is typically performed with either a parasternal or a subxyphoid approach.
Pleural cavity
The sonographic assessment of the normal pleural base anatomy is hazy and indistinct, since scatter and reflection of air within lung precludes significant sound penetration. As the transducer is angled or moved cephalad to visualize the costophrenic angle, views of the liver, spleen, and diaphragm will give way to scatter artifact that looks like the screen has become dirty: this is the appearance of normal lung. Additionally, elucidating normal sonographic anatomy of the anterior thorax is extremely useful. The most visible and superficial finding is the acoustic shadowing from the ribs (Fig. 3.27). The pleural space is just deep to the posterior aspect of the ribs. It can be recognized as an echogenic line that has the appearance of to-and-fro sliding (Fig. 3.28). This is termed lung sliding and it represents the absence of a pneumothorax because the visceral and parietal pleura are in contact, sliding past one another (Fig. 3.16B;  VIDEO 3.6). Another finding that supports the absence of pneumothorax are “comet tails” or “B-lines.” These linear artifacts arise from the moving pleural interface and spread to the edge of the screen (24). B-lines may be present or absent in normal lung and are believed to correlate with interstitial fluid. Improved sensitivity for lung sliding may also be achieved by using power Doppler (25,26). Using the “power slide” technique, normal pleural approximation is easily noted by the presence of color signal enhancement at the pleura, indicating motion.
VIDEO 3.6). Another finding that supports the absence of pneumothorax are “comet tails” or “B-lines.” These linear artifacts arise from the moving pleural interface and spread to the edge of the screen (24). B-lines may be present or absent in normal lung and are believed to correlate with interstitial fluid. Improved sensitivity for lung sliding may also be achieved by using power Doppler (25,26). Using the “power slide” technique, normal pleural approximation is easily noted by the presence of color signal enhancement at the pleura, indicating motion.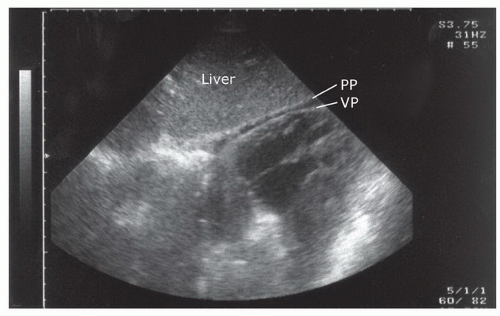 FIGURE 3.25. Subxyphoid Orientation of the Heart Demonstrating Separation of the Layers of the Pericardium by a Small Amount of Pericardial Fluid. VP, visceral pericardium; PP, parietal pericardium. |
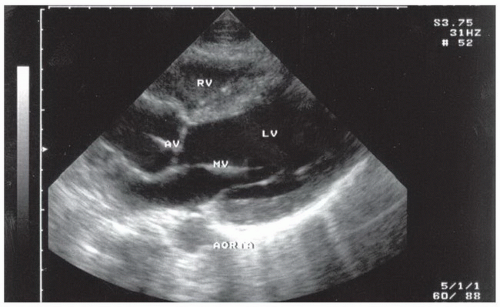 FIGURE 3.26. The Chambers of the Heart Visualized from the Long Axis Parasternal Transducer Position. Note that this view uses the emergency medicine orientation; see Chapter 4. RV, right ventricle; LV, left ventricle; MV, mitral valve; AV, aortic valve. |
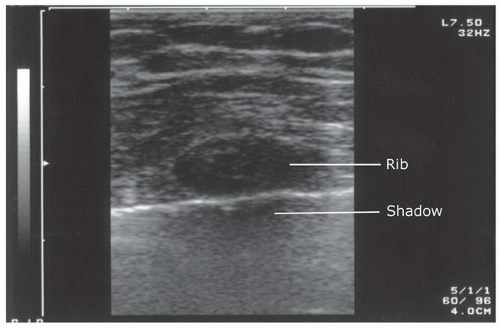 FIGURE 3.27. Anterior Thorax Transducer Position Demonstrating the Appearance of Rib Shadow. |
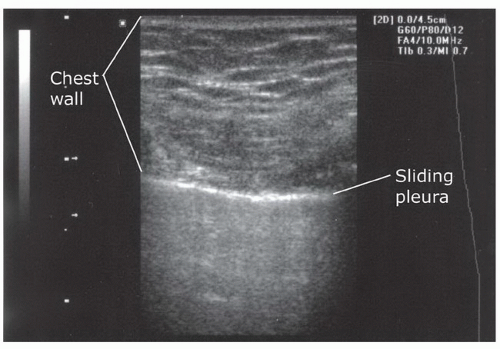 FIGURE 3.28. Ultrasound Anatomy Visualized During Scanning to Assess for the Presence of a “Sliding Sign.” |
PATHOLOGY
Free Peritoneal Fluid
Fluid (blood) in the trauma patient is usually detected in the dependent areas of the peritoneal cavity, including the hepatorenal space (Morison’s pouch), the perisplenic space, the pelvis, and the paracolic gutters. In general, free fluid appears anechoic (black) and is defined by the borders of the potential spaces it occupies (Fig. 3.29). As an example, free fluid in Morison’s pouch will be bounded by Glisson’s capsule or the liver anterolaterally and Gerota’s fascia or the kidney posteromedially. There are a number of variables that affect the appearance and location of fluid within the peritoneal cavity. These include the site of origin of the bleeding, the rate of accumulation, time since the injury, and movement of fluid within the peritoneal cavity.
Minimum amount of fluid
The ability to detect free intraperitoneal fluid by ultrasound was first illustrated in a cadaver study in 1970 that demonstrated that as little as 100 cc of instilled peritoneal fluid was detectable by ultrasound when the body was placed in a hand-knee position and scanned from the abdomen (1). Additional studies have been done since, including one finding that as little as 10 mL of fluid could be consistently visualized in the pouch of Douglas (27). The minimal amount of fluid detected by ultrasound depends on a number of factors, most notably, the location of the fluid and the positioning of the patient. Most studies that have assessed the ability of ultrasound to detect minimal volumes of peritoneal fluid have focused on Morison’s pouch using a saline infusion model (27, 28, 29, 30). In one study using DPL as a model for intraperitoneal fluid, the mean volume detected in Morison’s pouch was 619 mL (standard deviation, 173 mL). Only 10% of the sonographers could detect fluid volumes of 400 mL or less, although most sonographers were novices and they were only allowed to visualize Morison’s pouch (28). Using a similar DPL model, another study assessed the minimum volume detected using the pelvic view (31). They determined that the average minimum detectable volume was 157 mL by one participant and 129 mL by an independent reviewer, thus suggesting that the pelvic view may be more sensitive than Morison’s pouch for small volumes of peritoneal fluid.
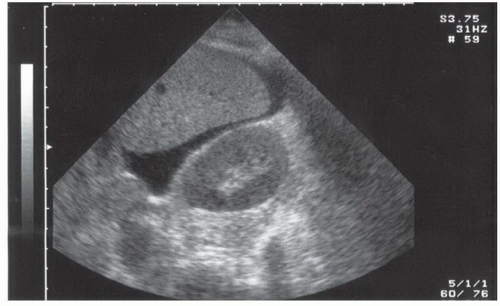 FIGURE 3.29. Peritoneal Fluid Visualized in the Perihepatic Region. |
Patient positioning has also been studied as a factor in detecting peritoneal fluid. For instance, one study found that the optimal positions for detecting minimal volumes of fluid in a cadaver model were right lateral decubitus or facing downward while being supported on both hands and knees (1). Since neither of these positions is practical for scanning the trauma patient, other positioning has been investigated. For example, a small amount (5 degrees) of Trendelenburg positioning has been shown to increase the sensitivity for detecting peritoneal fluid in the right upper quadrant (32).
Finally, attempts have been made to correlate fluid measurements on ultrasound and scoring systems with intraperitoneal fluid volumes. In a DPL model, a mean stripe width of 1.1 cm in Morison’s pouch was found after 1 L of saline had been instilled (29). Other studies predicted large volumes of peritoneal fluid based on fluid stripes (>2 mm wide), fluid in multiple locations, and a fluid score of three or greater, suggesting the need for therapeutic laparotomy (33,34).
Fluid flow patterns
Fluid in the peritoneal cavity can collect and spread in a predictable manner, which can aid in its detection. One study found that in the supine position, the pelvis is the most dependent portion of the peritoneal cavity and the right paracolic gutter is the main communication between the upper and lower abdominal compartments (Fig. 3.30) (35). Measured flow patterns have shown that fluid tracking up the
right paracolic gutter preferentially collects in Morison’s pouch before progressing to the right subphrenic space. Interestingly, the phrenicocolic ligament restricts similar flow between the left paracolic gutter to the left upper quadrant, so fluid in the supramesocolic space actually spreads across the midline into the right upper quadrant. Clinical studies support these findings as the majority of peritoneal fluid collections are detected in the perihepatic region (20,36).
right paracolic gutter preferentially collects in Morison’s pouch before progressing to the right subphrenic space. Interestingly, the phrenicocolic ligament restricts similar flow between the left paracolic gutter to the left upper quadrant, so fluid in the supramesocolic space actually spreads across the midline into the right upper quadrant. Clinical studies support these findings as the majority of peritoneal fluid collections are detected in the perihepatic region (20,36).
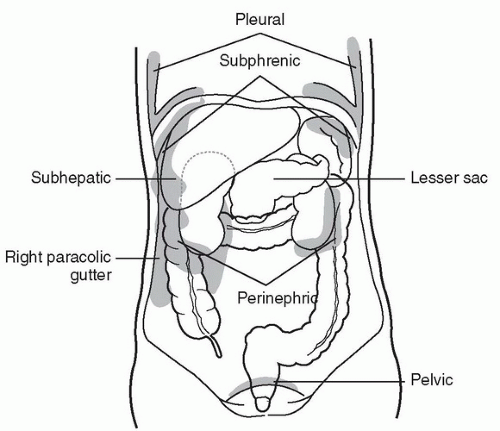 FIGURE 3.30. Potential Spaces within the Torso where Fluid can Collect. |
Perihepatic fluid
Fluid can accumulate and be found in a variety of perihepatic locations. Most commonly it will be detected in the hepatorenal space or Morison’s pouch. While the echogenicity may vary (depending on age and composition), free intraperitoneal fluid typically has well-defined edges that are bordered by Glisson’s capsule of the liver and Gerota’s fascia of the right kidney (Fig. 3.31). Fluid can also collect in the subphrenic space and will appear as a crescent-shaped anechoic collection that is bordered by the diaphragm superiorly and the liver inferiorly (Fig. 3.32; eFig. 3.1). Other less common areas where fluid may be detected are at the superior pole of the kidney in Morison’s pouch (Fig. 3.33; eFig. 3.2) or at the inferior margin of the liver (Fig. 3.34; eFig. 3.3;  VIDEO 3.7A).
VIDEO 3.7A).Perisplenic fluid
Free fluid in the left upper quadrant collects differently than in the perihepatic area, primarily because the phrenicocolic ligament restricts fluid from filling the splenorenal interface. Consequently, fluid is most commonly detected in the subphrenic space and appears as a crescent-shaped fluid collection that is bordered superiorly by the diaphragm and inferiorly by the spleen (Fig. 3.35;  VIDEO 3.7B).
VIDEO 3.7B).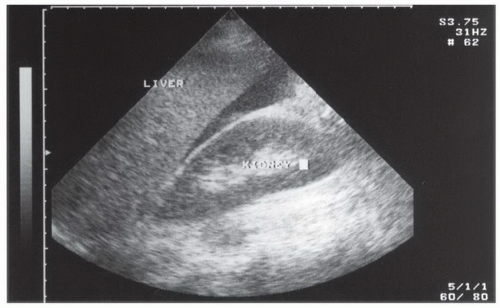 FIGURE 3.31. Ultrasound Appearance of Free Fluid in Morison’s Pouch. |
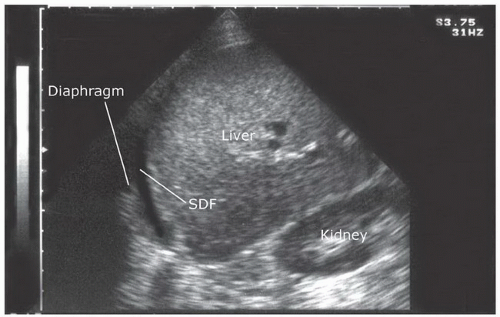 FIGURE 3.32. Image of Fluid Visualized in the Right Subdiaphragmatic space. SDF, subdiaphragmatic. |
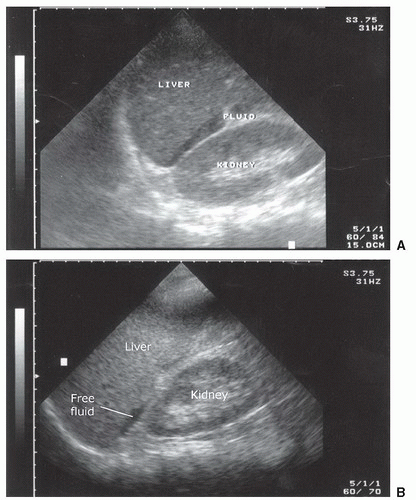 FIGURE 3.33. Examples of the Appearance of Peritoneal Fluid Collecting at the Superior Pole of the Right Kidney. |
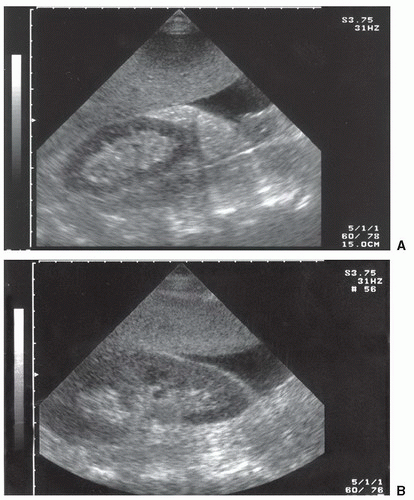 FIGURE 3.34. Examples of Peritoneal Fluid Visualized at the Tip of the Liver. |
 FIGURE 3.35. Peritoneal Fluid Detected in the Left Subdiaphragmatic Space. |
Pelvic fluid
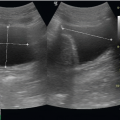
Free fluid in the pelvis has a variety of appearances, depending on patient gender and transducer orientation. In the transverse plane, fluid in a male pelvis can be seen in the retrovesicular space outlining the posterior wall of the bladder, but also may appear lateral to the bladder (Fig. 3.38; eFig. 3.5). In the transverse orientation of the female pelvis, fluid will collect posterior to the uterus (Fig. 3.39) or, if enough fluid is present, between the body of the uterus and the bladder. When viewing the pelvis in the sagittal orientation, fluid will collect in the same places as in the transverse orientation, but it will appear differently. For instance, in the male pelvis, the fluid will collect posterior and superior to the bladder between the dome of the bladder and the bowel wall (Fig. 3.40; eFig. 3.6). It has a similar appearance in the female patient, except that it collects in the space between the uterus and bowel, and in significant volumes, may even extend anterior to the uterus (Fig. 3.41; eFig 3.7). As with all scanning applications, both transverse and sagittal planes are critical to fully evaluate the pelvis for fluid, as there are many imaging artifacts and confusing structures that can confound the examination.
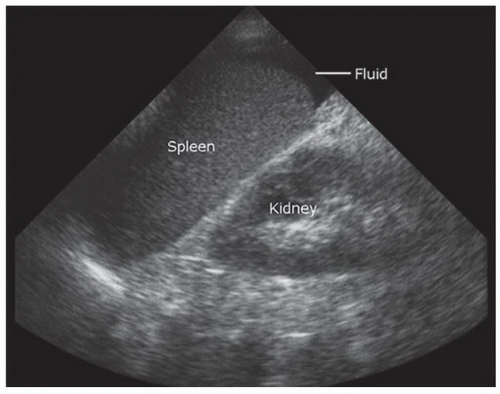 FIGURE 3.36. Image of the Perisplenic Area with Fluid Visualized at the Tip of the Spleen. |
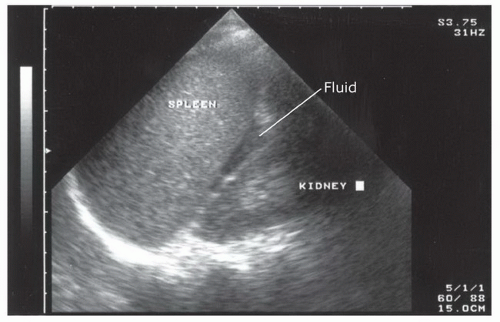 FIGURE 3.37. Ultrasound Image of the Left Upper Quadrant Demonstrating Fluid in the Interface between the Spleen and Kidney. |
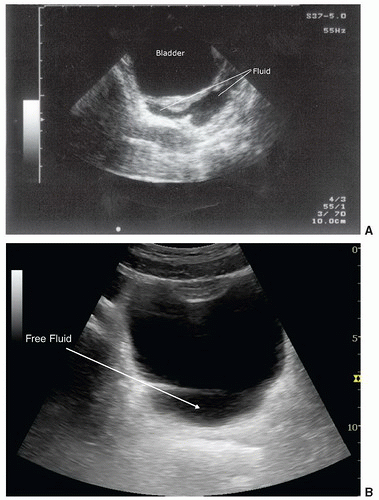 FIGURE 3.38. Sonographic Appearance of Fluid Collecting Posterior to the Bladder in Male Patients with the Transducer in the Transverse Orientation. |
 FIGURE 3.39. Ultrasound Image of Free Fluid Located Posterior and Lateral to the Bladder and Posterior to the Uterus with the Transducer in the Axial Orientation. |
Paracolic gutter fluid
Fluid in the paracolic gutter has a specific appearance as it forms a sharp-edged border around loops of bowel in the area (Fig. 3.42; eFig. 3.8). The fluid pockets will vary in size, and the space between loops of bowel will change with peristalsis. Bowel may appear to float within the free fluid ( VIDEO 3.8).
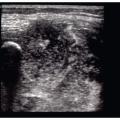
VIDEO 3.8).Echogenic hemorrhage and clot
Most fresh peritoneal hemorrhage will appear anechoic; however, as clot forms and organizes, it becomes more echogenic. Clotted blood can be echogenic or have a midlevel echo pattern that has some sonographic similarities to tissue, such as the spleen or liver parenchyma (Fig. 3.43). Collections of clotted blood can be found in patients with long transport times or large volumes of peritoneal bleeding. The ability to differentiate clotted peritoneal blood from normal parenchyma can at times be difficult, but in most cases, thorough inspection of the area in question will demonstrate that an anechoic stripe, representing free peritoneal fluid, borders the clotted blood (Fig 3.44).
Pericardial Effusion
Hemorrhage can accumulate quickly in the potential space between the visceral and parietal pericardium and create hypotension due to a cascade of increasing intrapericardial pressure, leading to impairment of right heart filling and subsequently left heart filling, followed by decreased left ventricular stroke volume. Fluid in the pericardial space may appear as an anechoic stripe that conforms to the outline of the cardiac structures. In many cases, the fluid will have the same anechoic character as blood within the cardiac chambers. From the subxyphoid orientation, fluid will initially be seen between the right side of the heart and the liver, which is the most dependent area visualized (Fig. 3.45). In the parasternal orientation, fluid will initially be seen posteriorly as it outlines the free wall of the left atria and ventricle, but may also be seen anterior to the right ventricle, particularly in cases of circumferential effusion (Fig. 3.46). The descending aorta is an important landmark for differentiating pericardial from pleural effusions. Pericardial fluid collects anterior to the descending aorta, while pleural fluid will be seen posterior to this level (Fig. 3.47; eFig. 3.9;  VIDEO 3.9).
VIDEO 3.9).Related posts:
Stay updated, free articles. Join our Telegram channel

Full access? Get Clinical Tree


