Treatment Planning I: Isodose Distributions
The central axis depth dose distribution by itself is not sufficient to characterize a radiation beam that produces a dose distribution in a three-dimensional volume. In order to represent volumetric or planar variation in absorbed dose, distributions are depicted by means of isodose curves, which are lines passing through points of equal dose. The curves are usually drawn at regular intervals of absorbed dose and expressed as a percentage of the dose at a reference point. Thus, the isodose curves represent levels of absorbed dose in the same manner that isotherms are used for heat and isobars, for pressure.
11.1. Isodose Chart
An isodose chart for a given beam consists of a family of isodose curves usually drawn at equal increments of percent depth dose, representing the variation in dose as a function of depth and transverse distance from the central axis. The depth dose values of the curves are normalized either at the point of maximum dose on the central axis or at a fixed distance along the central axis in the irradiated medium. The charts in the first category are applicable when the patient is treated at a constant source to surface distance (SSD) irrespective of beam direction. In the second category, the isodose curves are normalized at a certain depth beyond the depth of maximum dose, corresponding to the axis of rotation of an isocentric therapy unit. This type of representation is especially useful in rotation therapy but can also be used for stationary isocentric treatments. Figure 11.1 shows both types of isodose charts for a 60Co γ-ray beam.
Examination of isodose charts reveals some general properties of x- and γ-ray dose distributions.
The dose at any depth is greatest on the central axis of the beam and gradually decreases toward the edges of the beam, with the exception of some linac x-ray beams, which exhibit areas of high dose or “horns” near the surface in the periphery of the field. These horns are created by the flattening filter, which is usually designed to overcompensate near the surface in order to obtain flat isodose curves at greater depths.
Near the edges of the beam (the penumbra region), the dose rate decreases rapidly as a function of lateral distance from the beam axis. As discussed in Chapter 4, the width of geometric penumbra, which exists both inside and outside the geometric boundaries of the beam, depends on source size, distance from the source, and source to diaphragm distance.
Near the beam edge, falloff of the beam is caused not only by the geometric penumbra, but also by the reduced side scatter. Therefore, the geometric penumbra is not the best measure of beam sharpness near the edges. Instead, the term physical penumbra may be used. The physical penumbra width is defined as the lateral distance between two specified isodose curves at a specified depth (e.g., lateral distance between 90% and 20% isodose lines at the depth of Dmax).
Outside the geometric limits of the beam and the penumbra, the dose variation is the result of side scatter from the field and both leakage and scatter from the collimator system. Beyond this collimator zone, the dose distribution is governed by the lateral scatter from the medium and leakage from the head of the machine (often called therapeutic housing or source housing).
Figure 11.2 shows the dose variation across the field at a specified depth. Such a representation of the beam is known as the beam profile. It may be noted that the field size is defined as the lateral
distance between the 50% isodose lines at a reference depth. This definition is practically achieved by a procedure called the beam alignment in which the field-defining light is made to coincide with the 50% isodose lines of the radiation beam projected on a plane perpendicular to the beam axis and at the standard SSD or source to axis distance (SAD).
distance between the 50% isodose lines at a reference depth. This definition is practically achieved by a procedure called the beam alignment in which the field-defining light is made to coincide with the 50% isodose lines of the radiation beam projected on a plane perpendicular to the beam axis and at the standard SSD or source to axis distance (SAD).
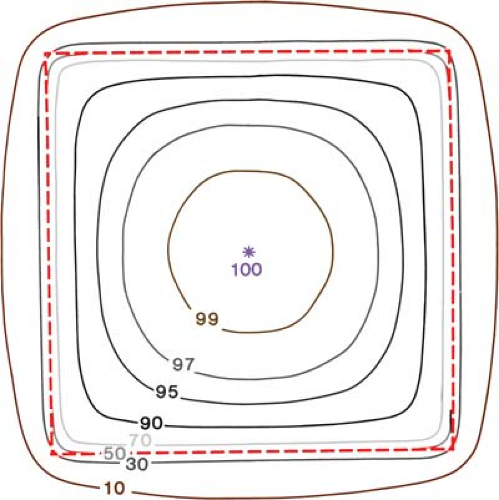
Another way of depicting the dose variation across the field is to plot isodose curves in a plane perpendicular to the central axis of the beam (Fig. 11.3). Such a representation is useful for treatment planning in which the field sizes are determined on the basis of an isodose curve (e.g., 90%) that adequately covers the target volume.
11.2. Measurement of Isodose Curves
Isodose charts can be measured by means of ion chambers, solid state detectors, or radiographic films (Chapter 8). Of these, the ion chamber is the most reliable method, mainly because of its relatively flat energy response and precision. Although any of the phantoms described in Chapter 9 may be used for isodose measurements, water is the medium of choice for ionometric measurements. The chamber can be made waterproof by a thin plastic sleeve that covers the chamber as well as the portion of the cable immersed in the water.
As measurement of isodose charts has been discussed in some detail in the International Commission on Radiation Units and Measurements (ICRU) (1), only a few important points will be discussed here. The ionization chamber used for isodose measurements should be small so that measurements can be made in regions of high dose gradient, such as near the edges of the beam. It is recommended that the sensitive volume of the chamber be less than 15 mm long and have an inside diameter of 5 mm or less. Energy independence of the chamber is another important requirement. Because the x-ray beam spectrum changes with position in the phantom owing to scatter, the energy response of the chamber should be as flat as possible. This can be checked by obtaining the exposure calibration of the chamber for orthovoltage (1–4 mm Cu) and 60Co beams. A variation of approximately 5% in response throughout this energy range is acceptable.
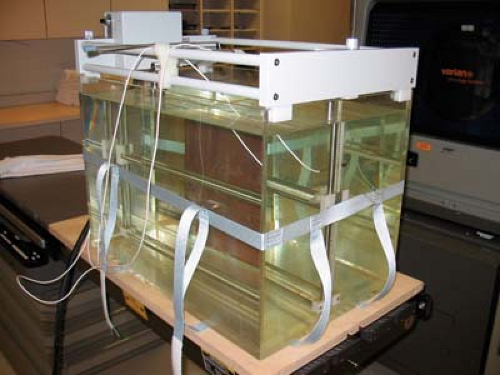
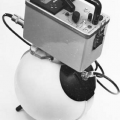
Automatic devices for measuring isodose curves have been developed for rapid mapping of the isodose curves. These systems are designed to be either stand alone or computer driven. Basically, the apparatus (Fig. 11.4) consists of two ionization chambers, referred to as the detector A (or probe) and the monitor B. Whereas the probe is arranged to move in the tank of water to sample the dose rate at various points, the monitor is fixed at some point in the field to monitor the beam intensity with time. The ratio of the detector to the monitor response (A/B) is recorded as the probe is moved in the phantom. Thus, the final response A/B is independent of fluctuations in output. In the stand-alone system, the probe searches for points at which A/B is equal to a preset percentage value of A/B measured at a reference depth or the depth of maximum dose. The motion of the probe is transmitted to the plotter, which records its path, the isodose curve.
In the computer-driven models, the chamber movement of the probe is controlled by a computer program. The probe-to-monitor ratio is sampled as the probe moves across the field at preset increments. These beam profiles are measured at a number of depths, determined by computer program. The data thus measured are stored in the computer in the form of a matrix that can then be transformed into isodose curves or other formats allowed by the computer program.
A. Sources of Isodose Charts
Acquisition of isodose charts has been discussed (1). Atlases of premeasured isodose charts for a wide range of radiation therapy equipment are available from the sources listed in the
literature (2,3,4). In addition, isodose distributions may also be obtained from manufacturers of radiation generators or from other institutions having the same unit. However, the user is cautioned against accepting isodose charts from any source and using them as a basis for patient treatment without adequate verification. The first and most important check to be performed is to verify that the central axis depth dose data correspond with percent depth dose data measured independently in a water phantom. A deviation of 2% or less in local dose is acceptable up to depths of 20 cm. The edges of the distribution should be checked by measuring beam profiles for selected field sizes and depths. An agreement within 2 mm in the penumbra region is acceptable.
literature (2,3,4). In addition, isodose distributions may also be obtained from manufacturers of radiation generators or from other institutions having the same unit. However, the user is cautioned against accepting isodose charts from any source and using them as a basis for patient treatment without adequate verification. The first and most important check to be performed is to verify that the central axis depth dose data correspond with percent depth dose data measured independently in a water phantom. A deviation of 2% or less in local dose is acceptable up to depths of 20 cm. The edges of the distribution should be checked by measuring beam profiles for selected field sizes and depths. An agreement within 2 mm in the penumbra region is acceptable.
Besides direct measurements, isodose charts can also be generated by calculations using various algorithms for treatment planning (5,6,7,8,9). More current algorithms are discussed in part III of this book. Some of these programs are commercially available with treatment-planning computers. Again, the applicability of the computer-generated isodose curves to the user’s machine must be carefully checked.
11.3. Parameters of Isodose Curves
Among the parameters that affect the single-beam isodose distribution are beam quality, source size, beam collimation, field size, SSD, and the source to diaphragm distance (SDD). A discussion of these parameters will be presented in the context of treatment planning.
A. Beam Quality
As discussed previously, the central axis depth dose distribution depends on the beam energy. As a result, the depth of a given isodose curve increases with beam quality. Beam energy also influences isodose curve shape near the field borders. Greater lateral scatter associated with lower-energy beams causes the isodose curves outside the field to bulge out. In other words, the absorbed dose in the medium outside the primary beam is greater for low-energy beams than for those of higher energy.
Physical penumbra depends on beam quality as illustrated in Figure 11.5. As expected, the isodose curves outside the primary beam (e.g., 10% and 5%) are greatly distended in the case of orthovoltage radiation. Thus, one disadvantage of the orthovoltage beams is the increased scattered dose to tissue outside the treatment region. For megavoltage beams, on the other hand, the scatter outside the field is minimized as a result of predominantly forward scattering and becomes more a function of collimation than energy.
B. Source Size, Source to Surface Distance, and Source to Diaphragm Distance—The Penumbra Effect
Source size, SSD, and SDD affect the shape of isodose curves by virtue of the geometric penumbra, discussed in Chapter 4. In addition, the SSD affects the percent depth dose and therefore the depth of the isodose curves.
As discussed previously, the dose variation across the field border is a complex function of geometric penumbra, lateral scatter, and collimation. Therefore, the field sharpness at depth is not
simply determined by the source or focal spot size. For example, by using penumbra trimmers or secondary blocking, the isodose sharpness at depth for 60Co beams with a source size less than 2 cm in diameter can be made comparable with higher-energy linac beams, although the focal spot size of these beams is usually less than 2 mm. Comparison of isodose curves for 60Co, 4 MV, and 10 MV in Figure 11.5 illustrates the point that the physical penumbra width for these beams is more or less similar.
simply determined by the source or focal spot size. For example, by using penumbra trimmers or secondary blocking, the isodose sharpness at depth for 60Co beams with a source size less than 2 cm in diameter can be made comparable with higher-energy linac beams, although the focal spot size of these beams is usually less than 2 mm. Comparison of isodose curves for 60Co, 4 MV, and 10 MV in Figure 11.5 illustrates the point that the physical penumbra width for these beams is more or less similar.
C. Collimation and Flattening Filter
The term collimation is used here to designate not only the collimator blocks that give shape and size to the beam, but also the flattening filter and other absorbers or scatterers in the beam between the target and the patient. Of these, the flattening filter, which is used for megavoltage x-ray beams, has the greatest influence in determining the shape of the isodose curves. Without this filter, the isodose curves will be conical in shape, showing markedly increased x-ray intensity along the central axis and a rapid reduction transversely. The function of the flattening filter is to make the beam intensity distribution relatively uniform across the field (i.e., “flat”). Therefore, the filter is thickest in the middle and tapers off toward the edges.
The cross-sectional variation of the filter thickness also causes variation in the photon spectrum or beam quality across the field owing to selective hardening of the beam by the filter. In general, the average energy of the beam is somewhat lower for the peripheral areas compared with the central part of the beam. This change in quality across the beam causes the flatness to change with depth. However, the change in flatness with depth is caused by not only the selective hardening of the beam across the field, but also the changes in the distribution of radiation scatter as the depth increases.
Beam flatness is usually specified at a 10-cm depth with the maximum limits set at the depth of maximum dose. By careful design of the filter and accurate placement in the beam, it is possible to achieve flatness to within ±3% of the central axis dose value at a 10-cm depth. This degree of flatness should extend over the central area bounded by at least 80% of the field dimensions at the specified depth or 1 cm from the edge of the field. The above specification is satisfactory for the precision required in radiation therapy.
To obtain acceptable flatness at 10 cm depth, an area of high dose near the surface may have to be accepted. Although the extent of the high-dose regions, or horns, varies with the design of the filter, lower-energy beams exhibit a larger variation than higher-energy beams. In practice, it is acceptable to have these “superflat” isodose curves near the surface provided no point in any plane parallel to the surface receives a dose greater than 107% of the central axis value (10).
D. Field Size
Field size is one of the most important parameters in treatment planing. Adequate dosimetric coverage of the tumor requires a determination of appropriate field size. This determination must always be made dosimetrically rather than geometrically. In other words, a certain isodose curve (e.g., 90%) enclosing the treatment volume should be the guide in choosing a field size rather than the geometric dimensions of the field.
Great caution should also be exercised in using field sizes smaller than 6 cm in which a relatively large part of the field is in the penumbra region. Depending on the source size, collimation, and design of the flattening filter, the isodose curves for small field sizes, in general, tend to be bell shaped. Thus, treatment planning with isodose curves should be mandatory for small field sizes. The isodose curvature for 60Co increases as the field size becomes overly large unless the beam is flattened by a flattening filter. The reason for this effect is the progressive reduction of scattered radiation with increasing distance from the central axis as well as the obliquity of the primary rays. The effect becomes particularly severe with elongated fields such as cranial spinal fields used in the treatment of medulloblastoma. In these cases, one needs to calculate doses at several off-axis points or use a beam-flattening compensator.
11.4. Wedge Filters
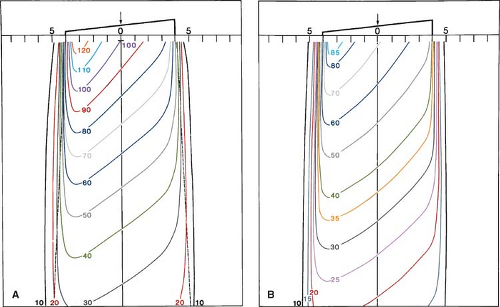
Frequently, special filters or absorbing blocks are placed in the path of a beam to modify its isodose distribution. The most commonly used beam-modifying device is the wedge filter. This is a wedge-shaped absorber that causes a progressive decrease in the intensity across the beam, resulting in a tilt of the isodose curves from their normal positions. As shown in Figure 11.6, the isodose curves are tilted toward the thin end, and the degree of tilt depends on the slope of the wedge filter. In actual wedge filter design, the sloping surface is made either straight or sigmoid in shape; the latter design is used to produce straighter isodose curves.
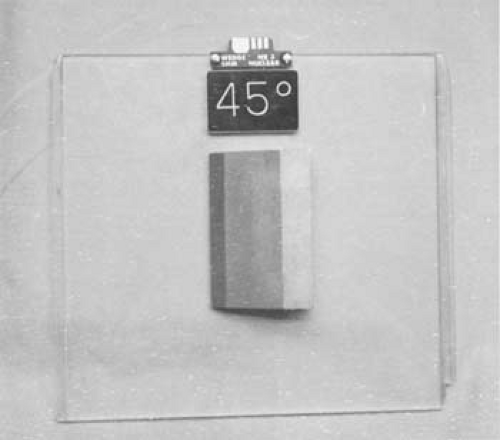
The wedge is usually made of a dense material, such as lead or steel, and is mounted on a transparent plastic tray, which can be inserted in the beam at a specified distance from the source (Fig. 11.7). This distance is arranged such that the wedge tray is always at a distance of at least 15 cm from the skin surface, so as to avoid destroying the skin-sparing effect of the megavoltage beam.
Another class of wedges (not discussed here) are the dynamic wedges. These wedges are generated electronically by creating wedged beam profiles through dynamic motion of an independent jaw within the treatment beam. Dynamic wedges do not offer significant clinical advantages over the traditional metal wedges. Moreover, all wedges and compensators are now superseded by the new technology using dynamic multileaf collimators in conjunction with the intensity-modulated radiation therapy (IMRT).
A. Wedge Isodose Angle
The term wedge isodose angle (or simply wedge angle) refers to “the angle through which an isodose curve is titled at the central ray of a beam at a specified depth” (11). In this definition, one should
note that the wedge angle is the angle between the isodose curve and the normal to the central axis, as shown in Figure 11.6. In addition, the specification of depth is important since, in general, the presence of scattered radiation causes the angle of isodose tilt to decrease with increasing depth in the phantom. However, there is no general agreement as to the choice of reference depth. Some choose depth as a function of field size (e.g., one half or two thirds of the beam width), while others define wedge angle as the angle between the 50% isodose curve and the normal to the central axis. The latter choice, however, becomes impractical when higher-energy beams are used. For example, the central axis depth of the 50% isodose curve for a 10-MV beam lies at about 18 cm for a 10 × 10-cm field and 100-cm SSD. This depth is too large in the context of most wedge filter applications. As will be discussed in section 11.7, the wedge filters are mostly used for treating superficial tumors, for example, not more than 10 cm deep. Therefore, the current recommendation is to use a single reference depth of 10 cm for wedge angle specification (11).
note that the wedge angle is the angle between the isodose curve and the normal to the central axis, as shown in Figure 11.6. In addition, the specification of depth is important since, in general, the presence of scattered radiation causes the angle of isodose tilt to decrease with increasing depth in the phantom. However, there is no general agreement as to the choice of reference depth. Some choose depth as a function of field size (e.g., one half or two thirds of the beam width), while others define wedge angle as the angle between the 50% isodose curve and the normal to the central axis. The latter choice, however, becomes impractical when higher-energy beams are used. For example, the central axis depth of the 50% isodose curve for a 10-MV beam lies at about 18 cm for a 10 × 10-cm field and 100-cm SSD. This depth is too large in the context of most wedge filter applications. As will be discussed in section 11.7, the wedge filters are mostly used for treating superficial tumors, for example, not more than 10 cm deep. Therefore, the current recommendation is to use a single reference depth of 10 cm for wedge angle specification (11).
B. Wedge Transmission Factor
The presence of a wedge filter decreases the output of the machine, which must be taken into account in treatment calculations. This effect is characterized by the wedge transmission factor (or simply wedge factor), defined as the ratio of doses with and without the wedge, at a point in phantom along the central axis of the beam. This factor should be measured in phantom at a suitable depth beyond the depth of maximum dose (e.g., 10 cm).
In cobalt-60 teletherapy, the wedge factor is sometimes incorporated into the isodose curves, as shown in Figure 11.6B. In this case, the depth dose distribution is normalized relative to the Dmax without the wedge. For example, the isodose curve at depth of Dmax is 72%, indicating that the wedge factor is already taken into account in the isodose distribution. If such a chart is used for isodose planning, no further correction should be applied to the output. In other words, the machine output corresponding to the open beam should be used.
A more common approach is to normalize the isodose curves relative to the central axis Dmax with the wedge in the beam. As see in Figure 11.6A, the 100% dose is indicated at the depth of Dmax. With this approach, the output of the beam must be corrected using the wedge factor.
C. Wedge Systems
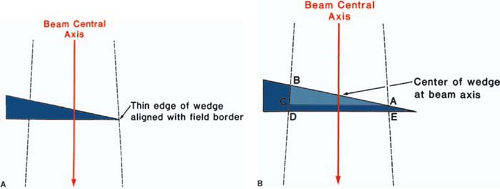
Wedge filters are of two main types. The first may be called the individualized wedge system, which requires a separate wedge for each beam width, optimally designed to minimize the loss of beam output. A mechanism is provided to align the thin end of the wedge with the border of the light field (Fig. 11.8A). The second system uses a universal wedge; that is, a single wedge serves for all beam widths. Such a filter is fixed centrally in the beam, while the field can be opened to any size. As illustrated in Figure 11.8B, only a small part of this wedge (i.e., ABC) is effective in producing the given wedge angle. The rest (ACDE), being unwedged, does not contribute to the isodose tilt
but unnecessarily reduces the beam intensity. Since the individualized system economizes on the beam output, it is preferred for use in cobalt teletherapy. The universal wedge, on the other hand, is useful for linear accelerator beams where the output is plentiful. From the setup and treatment planning points of view, the universal wedge is simpler to use than the individualized filter.
but unnecessarily reduces the beam intensity. Since the individualized system economizes on the beam output, it is preferred for use in cobalt teletherapy. The universal wedge, on the other hand, is useful for linear accelerator beams where the output is plentiful. From the setup and treatment planning points of view, the universal wedge is simpler to use than the individualized filter.
D. Effect on Beam Quality
In general, the wedge filter alters the beam quality by preferentially attenuating the lower-energy photons (beam hardening) and, to a lesser extent, by Compton scattering, which results in energy degradation (beam softening). For the 60Co beam, because the primary beam is essentially monoenergetic, the presence of the wedge filter does not significantly alter the central axis percent depth dose distribution. For x-rays, on the other hand, there can be some beam hardening (12), and consequently, the depth dose distribution can be somewhat altered, especially at large depths.
Although the wedge filters produce some change in beam quality, as noted above, the effect is not large enough to alter other calculation parameters such as the backscatter factor or the equivalent square, which may be assumed to be the same as for the corresponding open beams. Even central axis percent depth doses, tissue-air ratios, or tissue-maximal ratios may be assumed unchanged for small depths (e.g., <10 cm). The error caused by this assumption is minimized if the wedge transmission factor has been measured at a reference depth close to the point of interest.
E. Design of Wedge Filters
The design of wedge filters for megavoltage beams has been described by many authors (13,14,15,16). Here I will briefly present the design of a universal wedge filter following the technique of Aron and Scapicchio (16). The principle of this method is to determine the ratio of percent depth doses at various points for wedged and nonwedged fields. The thickness of the wedge filter material at these points is then determined from these ratios and the knowledge of the half-value layer or the attenuation coefficient of the given beam for the filter material.
Stay updated, free articles. Join our Telegram channel

Full access? Get Clinical Tree


