Tumors and Focal Bone, Joint, and Soft-Tissue Lesions
10.1055/b-0034-87941
Tumors and Focal Bone, Joint, and Soft-Tissue Lesions
The average annual incidence rate of primary bone sarcomas is approximately 8.7 per million children younger than 20 years of age, and primary bone sarcomas occur 10 times less frequently than soft tissue sarcomas.
Table 5.68 Tumors and focal lesions: epiphyseal lesions before closure of growth plate
Irregular ossification at sites of epiphyseal enchondromas. Cartilage may be seen capping the stalks of the enchondromas on MRI.
Sixty to seventy percent of patients have enchondromas at multiple epiphyses. Most common sites are the talar dome and distal tibial epiphyses.
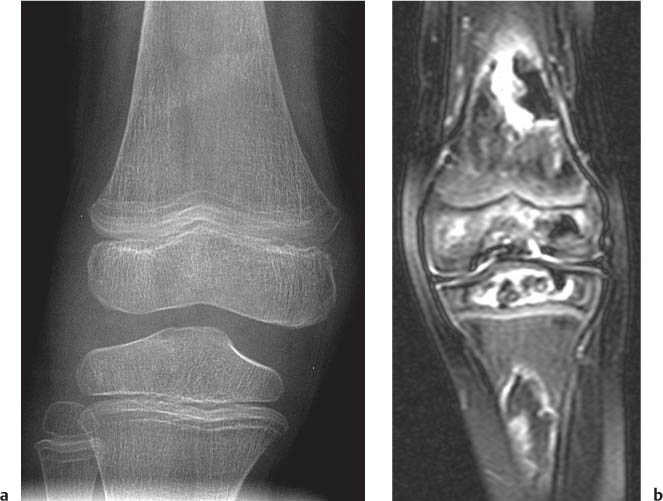
Fig. 5.112a, b Osteomyelitis affecting the epiphysis. Decreased T1-weighted signal intensity (a) and enhancement in the femoral epiphysis after gadolinium (b; arrows; compare with normal ossification center in the tibia).Fig. 5.113a, b Avascular necrosis. (a) Diffuse bone demineralization, faint sclerosis in the metaphyses, and growth recovery lines around the knee in a 4-year-old with acute lymphoblastic leukemia in remission. (b) T2-weighted MRI reveals the underlying AVN and bone infarcts.Fig. 5.114a–d Chondroblastoma presenting as a well-marginated lucency in the proximal epiphysis of the tibia on radiography (a) and CT (b). MRI reveals increased T2-weighted signal intensity with fluid-fluid levels (c) and T1-weighted enhancement about the margins of the lesions (d). Note the normal appearance of the margins of the distal femoral epiphysis with punctate bone formation (arrow in a and b).
Table 5.69 Tumors and focal lesions: epiphyseal lesions after closure of growth plate
Diagnosis
Findings
Comments
AVN
Mixed sclerosis and lucency ± subchondral collapse.
MRI shows early findings of marrow edema, and bone scan shows increased uptake prior to changes on radiography.
Osteolytic lesion with a geographic type of bone destruction. Lucent expansile lesion eccentrically located without marginal sclerosis, but narrow zone of transition. Internal trabeculations.
Abuts the subchondral bone. Typical locations: ends of the distal femur, proximal tibia, distal radius, and proximal humerus.
Well-marginated lucency subjacent to the subchondral bone.
May arise from herniation of synovium into the bone (synovial herniation pit).
Clear cell chondrosarcoma
Expansile lytic lesion with thinning of the cortex.
Extensive bone formation may mimic osteosarcoma.
Fig. 5.115 Giant cell tumor in the proximal tibial of a 15-year-old. Bubbly, lucent, and expansile lesion.Fig. 5.116 Polyostotic fibrous dysplasia.Fig. 5.117a, b Large subchondral cyst in a patient with trisomy 21 and inflammatory arthritis. (a) Radiograph shows a well-marginated lucent lesion with a narrow zone of transition. (b) The wall of the cystic cavity enhances, as does the inflamed and thickened synovium in the suprapatellar pouch.
Well-demarcated, eccentric, lucent defect communicating with the cortex and marginated by a thin rim of sclerosis.
Radiography is usually diagnostic. Observed in 30% of normal population < 20 y of age. Proximal and distal tibial and distal femur > proximal humerus and fibula. 1. Large lesions = NOF 2. Small lesions = fibrous cortical defect.
Cortically based lesion at posterome-dial aspect of distal femur. Similar in appearance to fibrous cortical defect.
May be bilateral. Occurs in 12- to 20-y-olds. Fibrous proliferation of periosteum. Lesions resolve spontaneously. Located at posterome-dial aspect of distal femur.
Pedunculated: Slender osseous stalk (continuous with the medulla) that projects away from the joint. Capped with hyaline cartilage. Sessile: broad based attached to the cortex.
Very common benign bone lesion. Usually discovered before age 20 y. Knees, hips, shoulders, and ankles. Mass effect on structures. Rarely may transform into chondrosarcoma. Multiple hereditary osteochondromatosis: autosomal dominant. Features of trichorhinophalangeal (Langer-Giedion) and Potocki-Shaffer syndromes.
Multicystic and eccentric expansile lesion encased in a thin shell of cortical bone.
May abut the metaphyseal side of the growth plate. Fluid-fluid levels on MRI or CT similar to telangiectatic osteosarcoma. Common sites: proximal tibia and femur, proximal humerus, scapula, and spine.
Centrally located, well-circumscribed, lucent lesion with sclerotic margins. May contain septations. Prior to treatment or pathologic fracture, follows the signal intensity of fluid on MRI pulse sequences.
Tumorlike lesion of unknown cause. May be the result of local disturbance of bone growth. Common locations in patients < 20 y include proximal humerus and femur; > 20 y include scapula, ilium, distal femur, proximal tibia, and calcaneus. May reoccur and reabsorb surgical packing material. Fallen fragment sign: cortical fragment layering in the cyst after pathologic fracture.
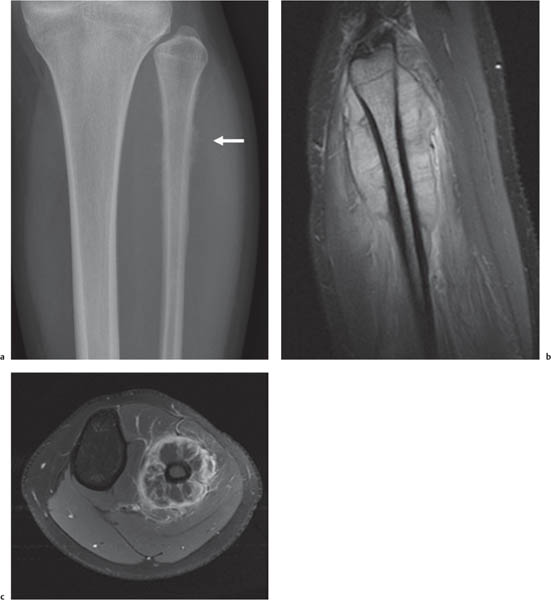
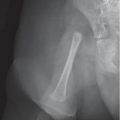
Fig. 5.118a, b Fibrous cortical defect (arrows) in the proximal tibia on radiography (a) and axial T2 fat-saturated MRI (b).Fig. 5.119a–d Distal femoral cortical defect. (a) The defect is lu-cent with irregular margins on radiography (arrow). (b) Because of pain and a limp, additional imaging was performed that showed the classic appearance of the lesion on CT with a smaller cortical defect on the contralateral side. The lesion is associated with the cortex and is dark on T1-(c) and bright on T2-weighted (arrow in d) MRI.Fig. 5.120a–c Osteochondroma displacing the peroneal tendons. (a) The osteochondroma (arrow) projects off the posterior aspect of the distal fibula and displaces the peroneal tendons posteriorly. (b) The cartilage cap has increased T2-weighted signal intensity (arrow). (c) The tendons are also displaced laterally (arrowhead) by the cartilage cap (arrow).Fig. 5.121 Osteochondroma. Multiple hereditary exostoses.Fig. 5.122a, b Aneurysmal bone cyst arising from the metaphysis. Bubbly lucent and expansile lesion (a) with fluid-fluid levels on MRI (b).Fig. 5.123a, b Unicameral bone cyst at the proximal femur. Expansile lucent lesion on radiography (a) with a fluid-fluid level on fat-saturated T2-weighted MRI (b).Fig. 5.124a, b Osteosarcoma arising from the distal femur with a Codman triangle (arrow), soft-tissue mass (arrowheads), and exuberant bone formation (a, b).Fig. 5.125a–c Periosteal osteosarcoma arising from the proximal tibia. (a) Patient presented with swelling (arrowheads) after minor trauma. (b, c) Cortical erosion (arrows in a) on radiography prompted a subsequent MRI that showed an enhancing mass eroding the underlying bone.Fig. 5.126a, b Ollier disease with diffuse enchondromatosis on radiograph (a) and STIR MRI (b). t TalusFig. 5.127a–c Enchondromatosis about the knee. (a, b) Radiography shows lucencies in the metaphyses. (c) T2-weighted MRI shows cartilage signal intensity.
Table 5.71 Tumors and focal lesions: diaphyseal lesions
Coarse sclerotic calcifications confined to the medulla. Serpiginous alternating bands of high and low T2-weighted signal intensity on MRI.
DD: Enchondroma, fibrous dysplasia, NOF, interosseous lipoma. Patients usually have predisposing history for infarcts (sickle cell disease, steroids, etc.). Differentiate from AVN = osteonecrosis of the subchondral bone predisposing to collapse of the joint.
Well-defined geographic lesion with narrow zone of transition. Appearance depends on the relative contribution of fibrous tissue and bone. More fibrous lesions have a cystic or ground-glass matrix. More osseous lesions have scattered calcifications or thick rim (rind sign) of sclerosis. Variable appearance on MRI.
Monostotic 70%–80% of case. Age 10–50 y. Replacement of cancellous bone by fibrous tissue. Common sites: midshaft of tibia, proximal femur, and ribs.
Multiple lesions. Similar features as monostotic form but may appear more aggressive.
Polyostotic 20%–30% of cases. Tends to involve only one side of body. Similar locations as monostotic form plus: jaw, pelvis, forearm, hands, feet, and fibula. McCune-Albright syndrome is associated with geographic nevi and endocrine abnormality (precocious puberty). Mazabraud syndrome: fibrous dysplasia and intramuscular myxomas.
Variable appearance. Poorly marginated lesion with permeative or moth-eaten pattern of bone destruction. Lamellated periosteal new bone formation or sunburst periosteal reaction. Large soft-tissue mass. Soft-tissue mass may cause saucerization.
Age 5–25 y. Second most common bone tumor of childhood. Long bones of lower extremity > pelvis > spine. Femur > ilium > tibia. Varying degrees of neuroectodermal differentiation (Ewing sarcome, Askin sarcoma, primitive neuroectodermal tumor [PNET]). Sclerosis in tumor may resemble osteoid formation of osteosarcoma.
Variable appearance. Tends to involve a large portion of bone. Geographic lytic destruction with moth-eaten or permeative pattern. Ivory bone (especially vertebra). Periosteal reaction and soft-tissue masses. Diffuse marrow infiltration on MRI.
Occurs in patients aged 10–70 y. Primary lymphoma of bone is very uncommon. DD: metastatic neuroblastoma, Ewing sarcoma, osteosarcoma.
Matrix of coarse sclerotic, punctate, or annular calcifications (arcs and whirls). Homogeneous high signal intensity on T2-weighted MRI with a lobular configuration.
Small lesions may appear similar to bone infarcts. Difficult to distinguish enchondroma from a low-grade chondrosarcoma (localized cortical thickening and lesions > 4 cm in length may indicated chondrosarcoma). Occurs in patients aged 15–40 y.
Benign fibrous histiocytoma (xanthofibroma or fibrous xanthoma)
Similar features as NOF but often develops at an atypical location or appears more aggressive.
Occurs in patients aged 15–60 y. Located in diaphysis or, in contrast to NOF, the articular end of a long bone, ribs, and pelvis. Locally aggressive with recurrence after resection.
Adamantinoma
Well-demarcated, elongated osteolytic lesion separated by sclerotic bone ± soap bubble lucencies. Heterogeneous signal intensity on MRI.
Rare malignant tumor mainly arising at the proximal diaphysis of the tibia >> middle humerus, proximal radius, and proximal fibula. Occurs in patients aged 10–40 y. May have satellite lesions.
Osteofibrous dysplasia
Similar in appearance to NOF and fibrous dysplasia.
Classically seen at proximal or middle third of the tibia.
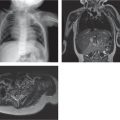
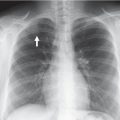
Fig. 5.128 Bone infarct with increased sclerosis in the proximal diaphysis and characteristic bone-within-bone appearance (arrows) in sickle cell disease.Fig. 5.129a–c Ewing sarcoma arising from the proximal humerus with a mottled bone architecture, wide zone of transition (arrows in a), and large soft-tissue mass (arrowheads in a). (b) The cortical destruction is demonstrated on the coned-down image from the screening chest CT. (c) The mass enhances and displaces the biceps tendons on MRI.Fig. 5.130 Enchondroma with arcs and rings pattern of mineralized chondroid matrix.
Table 5.72 Tumors and focal lesions: pelvic lesions
Focal region of soft-tissue thickening/fluid in the chest wall between the chest wall and undersurface of the body of the scapula (usually near the medial tip).
A snapping or clicking may be reproduced on shoulder adduction and abduction.
Fig. 5.132 Langerhans cell histiocytosis. Diffuse bone marrow edema and periosteal reaction involve the body and glenoid of the scapula on T2-weighted fat-saturated MRI.Fig. 5.133a–d Stress fracture of the scapula may be mistaken (as was this one) for a tumor on MRI. MRI shows increased T2-weighted signal intensity (a) and enhancement about the body and glenoid (b). Screening chest CT for lung metastases (c) shows smooth periosteal reaction and reconstructed coronal images (d) confirm a healing fracture line (arrows in c and d).Fig. 5.134 Snapping scapula syndrome with an inflamed bursa between the scapula and chest wall (arrow).
Table 5.74 Tumors and focal lesions: chest wall masses
Diagnosis
Findings
Comments
Benign (anatomic variation)
Variation in anatomy of rib, costal cartilage, tilted sternum, bifid rib, breast tissue.
Chest is a rare site of involvement. Arises from a rib, scapula, or clavicle. Ossification may not be visible in some patients.
Other sarcomas
Rare: synovial, malignant peripheral nerve sheath tumors (neurofibromatosis type 1), leiomyosarcoma, fibrosarcoma, hemangiopericytoma, etc.
Neuroblastoma
Soft-tissue mass ± bone destruction either a metastasis or extension from paraspinal disease.
Chest wall is an uncommon site for neuroblastoma.
Lipoblastoma
Fat containing.
Locally invasive.
Desmoid tumor
Heterogeneously enhancing mass with destruction of the ribs.
Fig. 5.135a–c Actinomycosis mass arising from the right chest wall displaces the scapula on radiography (a). The soft-tissue mass encases the upper chest wall (b) and causes periosteal reaction in the ribs (c).
Table 5.75 Tumors and focal lesions: multiple lesions
Well-circumscribed lucent regions in bone. May be accompanied by other findings of hyperparathyroidism: erosions, granular (salt-and-pepper) skull, etc.
Hyperparathyroidism presents as “stones, bones, and groans.” Both primary and secondary forms of hyperparathyroidism may lead to lytic lesions in bone. Tumors in the primary form are usually seen in adults. The secondary form is most often the result of chronic renal failure and lytic lesions have an increased incidence with age.
Growth of multiple osteochondromas around areas of active bone growth. May lead to shortening and bowing of bones and mass effect on adjacent soft tissues.
Enchondromatosis (including Ollier disease and Maffucci syndrome)
Multiple enchondromas (see Table 5.71for description of an enchondroma).
Ollier: extensive involvement of enchondromas usually unilateral and distributed in metaphyses and diaphyses most commonly in the hands. Maffucci: similar distribution of enchondromas as Ollier plus soft-tissue hemangiomas.
Angiomatosis (hemangiomatosis and lymphangiomatosis)
Osteolytic lesion rimmed by sclerosis or with a narrow zone of transition. May have a honeycomb appearance.
Occurs in patients aged 8–30 y. Diaphyses of long bones, pelvis, and spine. May rarely appear sclerotic. Gorham disease (congenital with massive destruction of bone).
Angiosarcoma
Nonspecific imaging appearance. Aggressive lytic lesion with wide zone of transition. May have a honeycomb appearance similar to angiomatosis.
Occurs in patients aged 10–60 y. More common in skin and soft tissues than bone (~6%). Long bones > pelvis.
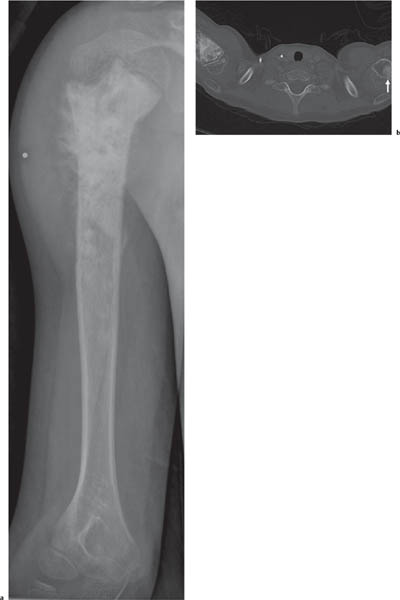
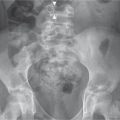
Fig. 5.136a–c Pre-B cell acute lymphocytic leukemia. Multiple lesions on T1-weighted MRI (a, b) enhance after gadolinium administration were occult on CT imaging (c).Fig. 5.137a, b Blastic metastasis. The primary osteosarcoma in the proximal right humerus (a) and blastic metastatis (arrow in b).Fig. 5.138a–c Lymphangiomatosis with lytic lesions involving the sternum (arrow in a), femur (arrow in b), and pelvis (c).Fig. 5.139 Lymphangiomatosis with bone involvement (Gorham disease).
Table 5.76 Tumors and focal lesions: bone- or cartilage-forming
Very thick smooth cortical thickening and a lucent center (nidus). DD: chronic osteomyelitis and cortical stress fracture.
Fifty percent have typical clinical presentation of night pain relieved with anti-inflammatory medications. Two-y delay from onset of symptoms until diagnosis.
Spherical or slightly oval lucent lesions marginated by sclerosis.
Four distinct types: (1) almost identical to osteoid osteoma but larger (> 2 cm diameter), (2) expansive lesion, (3) simulating an aggressive neoplasm, (4) periosteal (juxtacortical).
Aggressive mixed lucent and sclerotic lesion: permeative or moth-eaten bone destruction, wide zone of transition, cloudlike opacities of new bone formation, aggressive periosteal reaction (Codman triangle), soft-tissue mass.
Variable amount of bone formation. May be classified into subtypes based on World Health Organization.
Chondrosarcoma
Aggressive mixed lucent and sclerotic lesion. Calcifications range from punctuate to rings.
Clues to differentiate from enchondroma include pain, progressive destruction of the chondroid matrix, large size, and a large unmineralized component.
May arise in area of prior intervention or disturbance.
Following extraskeletal irradiation, chemotherapy, and treatment for retinoblastoma. Malignant transformation within a benign process (Paget disease, fibrous dysplasia, bone infarct) usually occurs in adulthood.
Fig. 5.140 Osteoma arising offthe posterior skull.Fig. 5.141a, b Osteoid osteoma. Thick periosteal reaction from osteoid osteoma on radiography (a). (b) The periosteal reaction surrounds the central nidus on CT.Fig. 5.142a–c Osteoblastoma with a mixed lucent and sclerotic lesion in the left scapula (a). (b) Intense activity is seen in the nidus on bone scan. (c) A large region of bone marrow edema surrounds the nidus on the sagittal proton-density fat-saturated MRI.Fig. 5.143a, b Osteoblastoma in the proximal femur of a 15-year-old (a) with lucent nidus (arrows) and thick periosteal reaction (arrowheads). (b) T1-weighted MRI shows the periosteal reaction enhancement in the nidus (arrow).Fig. 5.144 Chronic heterotopic bone formation (arrow) in a 29-year-old with spina bifida and chronic hip dislocations.Fig. 5.145 Tuberous sclerosis simulating a blastic metastasis.Fig. 5.146a–c Osteosarcoma primary. Sunburst pattern of periosteal reaction from chondroblastic osteosarcoma (arrow in a) with corresponding appearance on (b) STIR and (c) T1-weighted post-contrast imaging.Fig. 5.147a–c Secondary chondrosarcoma arising from the scapula in a patient 7 years after treatment for rhabdomyosarcoma of the axilla. (a) CT shows bone destruction and soft-tissue mass. (b) MRI shows increased T2-weighted signal intensity and enhancement of the mass (c).
Table 5.77 Tumors and focal lesions: soft-tissue masses
Soft-tissue mass rimmed by a peripheral margin of ossification separate from the adjacent bone. May appear aggressive on MRI with increased T2-weighted signal intensity and enhancement.
History of trauma not always elicited from children. Amorphous calcifications may be seen early (1–2 wk) after trauma.
Abscess
Fluid-filled structure with a thick wall that may be hyperemic on US and enhance on MRI or CT.
Clinical signs and symptoms of infection are typically present.
May produce periosteal reaction, chronic cortical thickening or remodeling of adjacent bone. High or low flow vascular mass on US or magnetic resonance angiography/magnetic resonance venography.
Venous malformations may contain phleboliths. Classified as capillary, venous, lymphatic, or combined malformations.
Lipoma
Usually well-defined mass that follows signal intensity of fat (T1 bright, T2 fast spin echo bright, and dark on STIR and fat-saturated pulse sequences).
Giant cell tumor of the tendon sheath
Nodular mass attached to a tendon. Characteristic low to intermediate T1- and low T2-weighted signal intensity on MRI. Variable gadolinium enhancement.
Not really a tumor, but more of a reactive lesion. Seen at tendons that have a synovial-lined tendon sheath. Localized form is usually seen at hands and feet. The diffuse form is rare, affects the lower extremities, and is the counterpart to PVNS affecting joints.
Focal mass. Similar or slightly increased in intensity to adjacent muscle on T1- and T2-weighted MRI. Target sign (hyperintense rim with low central T2-weighted signal intensity).
DD: schwannoma, neurofibroma, and neurofibromatosis.
May present with symptoms localized to the site of soft-tissue involvement, as an incidental finding on imaging for other reasons, or as part of the staging of the disease.
Occurs in patients aged 3–71 y. May develop in the extremities, genitourinary and gastrointestinal tracts and central nervous system.
Extraskeletal osteosarcoma
Ill-defined heterogeneous mineralized tumor mass.
Lower extremity and buttock. May be difficult to distinguish from early myositis ossificans. High rate of meta-static disease. Rare: ~4% of all osteosarcomas. More often seen in adults. DD: calcified hematoma, nodular fasciitis, ossifying lipoma, and myositis ossificans.
Fig. 5.148a, b Popliteal cyst. MRI shows the fluid-filled cyst (arrow in a) with rim enhancement (b).Fig. 5.149 Myositis of the left pectoralis muscles with gadolinium enhancement and swelling on MRI (arrows).Fig. 5.150 Osteonecrosis and myonecrosis in a child with sickle cell disease.Fig. 5.151a–d Peripheral nerve tumor. Schwannoma arising in the muscles of the forearm. (a) US shows a solid mass with blood flow. MRI shows an encapsulated mass that is intermediate in signal intensity on T1 (b), bright on T2-weighted (c), and uniform in enhancement after gadolinium administration (d).Fig. 5.152a–c Rheumatoid nodules (a–c) in the superficial soft tissues of the heel (arrows in a and b) as demonstrated on us (a) and T2-weighted fat-saturated MRI (b) and T1-weighted postcontrast MRI (c).Fig. 5.153a, b Nodular fasciitis (a) arising from the anterior compartment fascia of the proximal calf (b) enhances after gadolinium.Fig. 5.154a–c Rhabdomyosarcoma. (a–c) A soft-tissue mass arising in the distal calf.Fig. 5.155a–c Cystic liposarcoma of the thigh. The signal intensity from a tiny nodule of fat (arrow in a) on T1-weighted imaging (a) is suppressed on STIR (b) and gadolinium-enhanced T1-weighted fat-suppressed (c) imaging.Fig. 5.156a, b Myofibroma arising from the proximal thigh (arrow in a) on T2-weighted fat-saturated (a) and T1-weighted fat-saturated postcontrast–enhanced (b) imaging.Fig. 5.157a–c Synovial sarcoma arising from a characteristic location in the posterior proximal calf on T2-weighted (a) and T1-weighted prior to (b) and after gadolinium (c).Fig. 5.158 Extraskeletal Ewing sarcoma. A 20-month-old boy with a mass on the medial side of the right upper leg. Gadolinium-enhanced MRI shows a discrete enhancing mass remote from osseous structures; histology showed an extraosseous Ewing sarcoma.
Virtually all palpable, asymptomatic anterior chest wall lesions in children are benign and related to normal variations in the chest wall bone or cartilage.
Juxta-articular soft-tissue masses with erosive changes in the underlying bone. Masses arising from the synovium have low signal intensity on both T1- and T2-weighted sequences and signal dropout on gradient echo.
Locally destructive proliferative disorder of the synovium. May affect the tendon sheath (giant cell tumor) and bursa (pigmented villonodular bursitis). Adults > children. Vary rarely calcifications may be seen.
Soft-tissue swelling and joint effusion with many radiopaque bodies, small and uniform in size.
Benign metaplastic proliferation of multiple cartilaginous nodules in the joint, bursa, or tendon sheath. Rarely polyarticular. Differentiate from secondary osteochondromatosis = caused by OA with intra-articular bodies.
Uniform joint space narrowing. Hemosiderin in the synovium (dark on T1- and T2-weighted MRI).
Tends to affect large joints. Patients usually already have a diagnosis of trauma or a bleeding disorder.
Synovial hemangioma
Radiographs are often normal. Phleboliths, periosteal thickening, and advanced maturation of the epiphysis may be seen. MRI may characterize the vascular components of the lesion.
Occurs in patients aged 9–49 y. Most commonly affects the knee joint > elbow, wrist, ankle, and tendon sheaths.
Fig. 5.159a, b Synovial osteochondromatosis of the right hip. Ossicles surround the right hip on radiography (a) and T1-weighted fat-suppressed magnetic resonance arthrogram (b) shows that the osteochondromatosis is located in the joint.
Radiographically evident soft-tissue mass enveloping, splaying, and resorbing bones without frank bone destruction. Mixed solid and cystic mass with ± areas of necrosis on MRI and ± large draining vein.
Rapidly enlarging soft-tissue mass ± ulceration. More favorable prognosis than adult fibrosarcoma. Thrombocytopenia from disseminated intravascular coagulopathy.
Rhabdomyosarcoma
Soft-tissue mass that usually does not invade bone. Solid or partially cystic on MRI. Well-defined or infiltrative margins.
Approximately 50% arise caudally (buttock, sacrum, bladder, vagina). Approximately 50% have widespread metastatic disease.
Infantile hemangiopericytoma
Large soft-tissue mass ± bone invasion, ± calcific stippling. Vascular mass with feeding vessels but usually no draining vein.
Rapid growth. One-third occur in extremities, one-third the trunk, and one-third head and neck. Rarely metastasize.
Malignant peripheral nerve sheath tumor
Similar appearance as peripheral nerve sheath tumor but more aggressive. May displace or invade bone (see Table 5.77).
Rare before the age of 10 y. Associated with neurofibromatosis type 1.
Extrarenal rhabdoid tumor
Variable appearance of a rapidly enlarging soft-tissue mass.
Age < 1 y. Infrequently involves extremities.
Fig. 5.160 Congenital fibrosarcoma arising from the calf of a neonate on sagittal STIR MRI.
Table 5.80 Soft-tissue alteration without mass
Diagnosis
Findings
Comments
Infection
Increased T2-weighed signal intensity and enhancement in the superficial soft tissues (cellulitis), fascia, or muscles. Soft-tissue swelling and increased echogenicity on US.
Imaging findings that support a clinical diagnosis of necrotizing fasciitis include enhancement and thickening of fascia and gas in the soft tissues.
Muscle or tendon tear
Abnormality confined to the muscle or tendon with increased T2-weighted signal intensity and fluid. Fluid, alterations in the muscle fibers, and a tendon or muscle gap may also be seen on US.
Linear regions of decreased signal intensity on non–fat-suppressed MRI that have a scarlike appearance.
Although typically localized to sites of prior trauma, patients may not always be able to recall the trauma.
Fig. 5.161a–c Dermatomyositis. Inflammation involves essentially all the muscles of the pelvis and thighs on coronal STIR (a) and gadolinium- enhanced T1-weighted fat-suppressed MRI (b). Muscle groups around the ilia are less affected (arrow). (c) After 6 months of treatment, residual inflammation is seen only in the distal thighs with a small amount of enhancement (arrowheads).Fig. 5.162a, b Fat necrosis. A 16-year-old with firmness and swelling at the right hip and no clinical signs of cellulitis.
Only gold members can continue reading. Log In or Register to continue