Benign
Malignant
Bone-forming tumors
Osteoblastoma
Osteosarcoma
Osteoid osteoma
Cartilage-forming tumors
Chondroblastoma
Chondrosarcoma
Chondromyxoid fibroma
Enchondroma
Osteochondroma
Cystic lesions
Aneurysmal bone cyst
Unicameral (simple) bone cyst
Fibro-osseous lesions
Fibrous dysplasia
Fibrosarcoma
Nonossifying fibroma
Malignant fibrous histiocytoma
Giant cell tumors
Giant cell tumor
Small round cell tumors
Lymphoma
Ewing sarcoma
Vascular tumors
Hemangioma
Hemangiopericytoma
Lymphangioma
Other
Langerhans cell histiocytosis
Table 21.2
Typical skeletal locations of pediatric primary bone tumors
Small tubular bones |
Enchondroma |
Osteoid osteoma |
Long tubular bones |
Metastases |
Most benign and malignant bone tumors and tumor-like lesions (see Table 21.3 for specific locations within tubular bones) |
Ribs: |
Cartilaginous tumors |
Ewing sarcoma |
Fibrous dysplasia |
Langerhans cell histiocytosis |
Metastases |
Spine – vertebral body: |
Chordoma |
Giant cell tumor |
Hemangioma |
Langerhans cell histiocytosis |
Lymphoma |
Metastases |
Spine – posterior elements: |
Aneurysmal bone cyst |
Osteoblastoma/osteoid osteoma |
Skull and facial bones: |
Fibrous dysplasia |
Langerhans cell histiocytosis |
Metastases |
Osteoma |
Pelvis |
Chondrosarcoma |
Ewing sarcoma |
Fibrous dysplasia |
Metastases |
Osteochondroma |
Table 21.3
Tumor distribution within long bones
Epiphysis | Chondroblastoma |
Metaphysis | Aneurysmal bone cyst |
Chondromyxoid fibroma | |
Enchondroma | |
Ewing sarcoma | |
Fibrous dysplasia | |
Giant cell tumor | |
Lymphoma | |
Malignant fibrous histiocytoma | |
Metastases | |
Nonossifying fibroma | |
Osteochondroma | |
Osteosarcoma | |
Unicameral bone cyst | |
Adamantinoma | |
Diaphysis | Ewing sarcoma |
Lymphoma | |
Osteofibrous dysplasia | |
Osteoid osteoma |
For malignant tumors, imaging delineates the local extent of the tumor and the presence of distant metastases. It also helps determine the response to therapy and detect recurrent disease. The ALARA (as low as reasonably achievable) principle allows for optimal imaging while minimizing exposure to radiation [4].
1.1 Radiography (Box 21.1)
Box 21.1: General Radiographic Characteristics of Bone Tumors
Benign |
Well-defined and often sclerotic borders |
Cortical expansion |
May produce solid periosteal reaction |
Malignant |
Poor definition of margins |
Cortical destruction |
Spiculated, onion skin, or interrupted periosteal reaction |
Soft tissue mass |
Radiography constitutes the initial imaging modality for characterizing primary bone tumors and tumor-like conditions. This modality determines the location of the lesion within the bone and assesses its interface with the adjacent normal bone, along with the presence and appearance of both mineralized matrix and periosteal reaction [5]. Benign neoplasms usually grow more slowly and have well-defined and often sclerotic borders. Slower-growing tumors result in cortical expansion and may produce solid periosteal reaction. Malignant lesions usually show poor marginal definition, along with cortical destruction, a soft tissue mass, and a spiculated or interrupted periosteal reaction. However, these general characteristics are not absolute.
Periosteal reaction may be classified as either linear (single or multiple), solid, or spiculated [6]. Single linear reaction, appearing as a thin layer of new bone adjacent to the cortex, may be seen with benign periosteal reaction of infancy, trauma, osteomyelitis, and benign or malignant tumors, including metastases (Fig. 21.1a). Multiple layers of linear or lamellated reaction, known as “onion skin,” are frequently seen with aggressive tumors such as Ewing sarcoma or osteosarcoma but may also be seen with Langerhans cell histiocytosis and osteomyelitis (Fig. 21.1b). Spiculated periosteal reaction, oriented in the direction of rapid tumor growth, forms along vascular channels and Sharpey bands and appears in either a “hair on end” or “sunburst” form (Fig. 21.1b, c). Hair on end periosteal reaction is associated with Ewing sarcoma; a sunburst appearance is most often seen with osteosarcoma. The Codman triangle, or interrupted periosteal reaction, occurs when tumor, pus, or hemorrhage lifts or interrupts the periosteum. This may be seen with aggressive tumors (Fig. 21.1d), infection, or sometimes healing fractures. However, periosteal reaction has a broad range of appearances, and even with malignant tumors, it is not always visible.
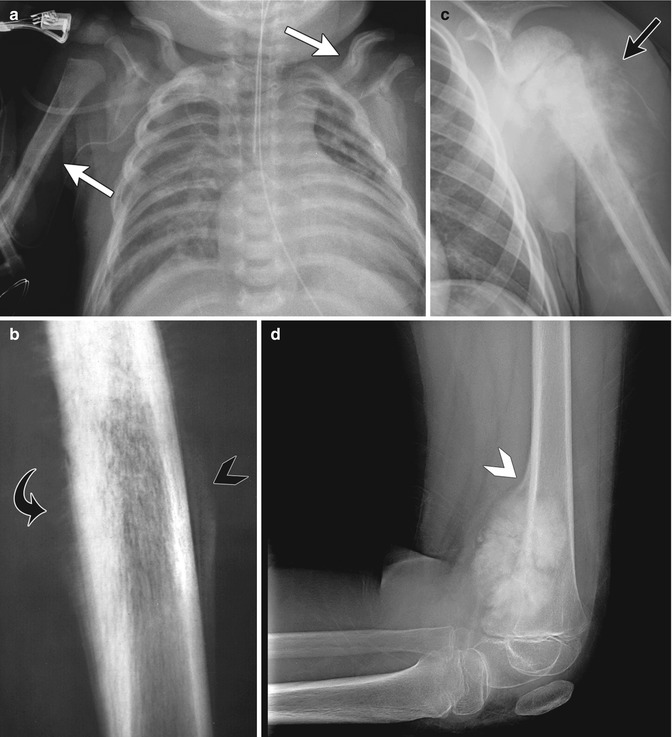
Fig. 21.1
Examples of different types of periosteal reaction. (a) Linear periosteal reaction (white arrow) in newborn with hypoplastic left heart syndrome and prostaglandin-induced periostitis. (b) Diaphyseal hair-on-end periosteal reaction (curved black arrow) and marginal onion skin periosteal reaction (black arrowhead) with Ewing sarcoma. (c) Sunburst periosteal reaction (black arrow) with osteosarcoma. (d) Codman triangle (white arrowhead) with distal femoral osteosarcoma
Tumors may produce osseous, chondroid, or fibrous matrix (Fig. 21.2). Osseous matrix is usually cloud-like, while chondroid matrix is typically characterized by stippled rings and arcs [5]. Destruction, replacement, or resorption of bone by the tumor may produce a lytic appearance. This tends to be well marginated, or geographic, with benign tumors, and more aggressive (permeative or moth-eaten) with malignant tumors.
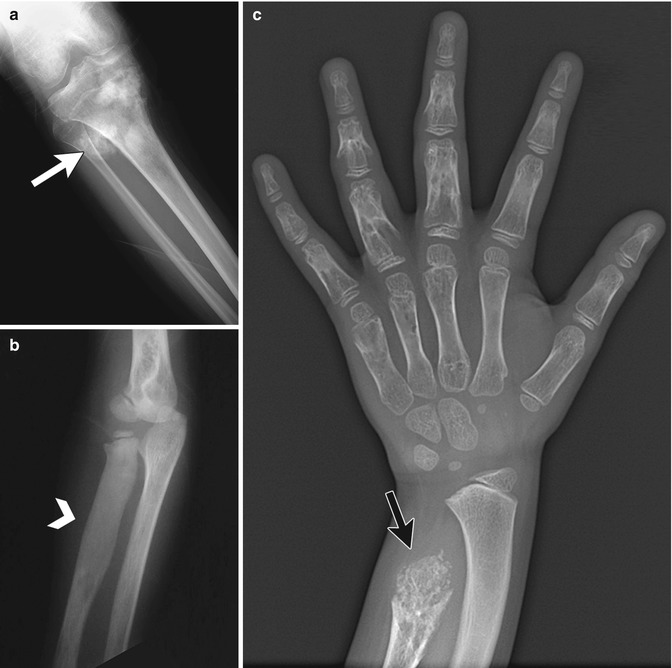
Fig. 21.2
Examples of different types of matrix. (a) Osseous matrix in osteosarcoma (white arrow). (b) Fibrous matrix in fibrous dysplasia (white arrow- head). (c) Chondroid matrix in enchondromatosis (black arrow) (b, c copyright Shriners Hospital for Children Northern California)
Ultrasound can assess associated soft tissue masses but has an otherwise limited role in imaging bone tumors.
1.2 Nuclear Medicine Imaging
Technetium-99m-methylene diphosphonate ([99m]Tc-MDP) bone scintigraphy and positron emission tomography (PET) have a limited role in the evaluation of solitary benign-appearing bone lesions as the patterns of uptake are usually not specific. However, in the initial staging and treatment evaluation of osteosarcoma and Ewing sarcoma, scintigraphy can assess for bone metastases, synchronous tumor, and skip lesions [7, 8]. It is also useful for multifocal processes, such as fibrous dysplasia, Langerhans cell histiocytosis (LCH), and other metastatic diseases [5]. 18F-fluorodeoxyglucose positron emission tomography (FDG-PET) CT is a promising means to evaluate patients with bone sarcomas [9, 10]. This technique may help predict tumor grade and assess treatment response when coupled with histologic evaluation [9].
1.3 Computed Tomography
Computed tomography (CT) offers greater spatial and contrast resolution than radiography and thus provides more detailed information about the intra- and extraosseous extent of tumor, the configuration of mineralization within the lesion, the type and location of tumor matrix, and the resultant cortical and periosteal changes [1, 5]. Furthermore, fat and fluid–fluid levels may sometimes be detected within the lesion, and the extent of contrast enhancement may be delineated [11]. CT may demonstrate periosteal reaction earlier than plain radiography [6].
1.4 Magnetic Resonance Imaging
Magnetic resonance imaging (MRI) exquisitely assesses the extent of cortical, intramedullary, joint, and soft tissue involvement by the neoplasm [8]. Important features such as fluid–fluid levels and tumor composition may lead to a more accurate diagnosis [11].
The primary tumor, adjacent soft tissues, and vascular, nerve, and joint involvement must be assessed. The MRI examination must include the entire bone to evaluate for skip lesions and assess the longitudinal extent of the tumor [8, 12]. T1-weighted (T1-W) images show the highest specificity for evaluating tumor extent: intraosseous tumor is typically hypointense and distorts the normal marrow architecture [12]. Short tau inversion recovery (STIR) images detect tumor with the highest sensitivity (the tumor is typically hyperintense). Small field-of-view phased-array coil axial fast spin echo (FSE) fluid-sensitive and fat-suppressed (FS) sequences help determine the relationship of tumor to adjacent muscle, nerve, and vascular structures. Gradient echo sequences can show flow within areas of neovascularity. Gadolinium-enhanced (GE) T1-W FS images define areas of viable tumor and areas of tumor necrosis [8]. Hypointensity on both T1-W and T2-weighted (T2-W) images may suggest either osteoblastic/fibrous matrix or chronic hemorrhage [13].
Peritumoral edema may be seen with either benign or malignant tumors and may be intraosseous or extraosseous [5, 13]. The signal characteristics of peritumoral edema resemble those of tumor, and care must be taken to distinguish between the two. Edema does not demonstrate mass effect or alter normal architecture [13]. Its margins within the bone are poorly defined, and it has a feathery appearance that follows muscle and fascial planes. Tumor margins are, in contrast, usually sharp. Like many tumors, signal intensity of marrow edema is intermediate between fat and muscle on T1-W sequences and high on T2 or STIR images. However, T2 hyperintensity due to marrow edema tends to be more heterogeneous than does that associated with tumor. The enhancement pattern also helps differentiate, as edema enhances less than tumor.
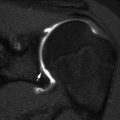
Fluid–fluid levels were first described in aneurysmal bone cysts (ABC) but occur in other benign and malignant tumors as well, including unicameral bone cyst, giant cell tumor, osteoblastoma, chondroblastoma, and telangiectatic osteosarcoma [5]. They are best evaluated with T2-W MRI (Fig. 21.3) [14]. Fluid–fluid levels in aneurysmal bone cysts result from separation of blood and serum in the cavernous spaces [13]. In other lesions, they may result from hemorrhage with breakdown of blood products or from tumor necrosis with sedimentation of cells and tissue fluid. The MRI appearance depends on the pulse sequences used as well as the composition of the fluid layers. On T1-W sequences, a high signal layer suggests methemoglobin. A layer that is isointense to slightly hyperintense to muscle on all sequences generally results from layering cellular debris or blood [13]. Although there are exceptions, as a general rule if more than two thirds of a lesion consists of fluid–fluid levels, it is benign, whereas if less than one third of it consists of fluid–fluid levels, it is malignant [15].
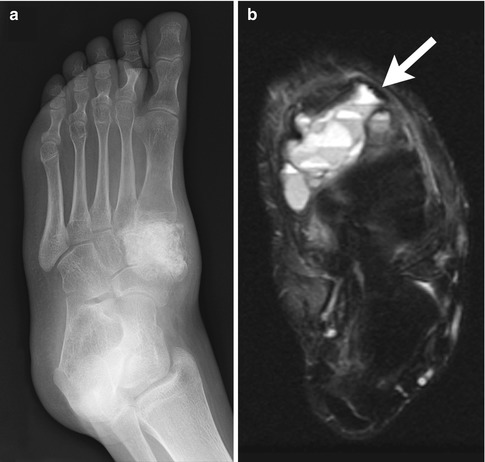
Fig. 21.3
Medial cuneiform aneurysmal bone cyst. (a) The bone is expanded and diffusely sclerotic, with scattered foci of dense sclerosis. (b) T2-weighted (T2-W) fat-suppressed (FS) axial MRI shows multiple fluid–fluid levels (white arrow)
There are two major staging systems for malignant bone tumors, a surgical system developed by Enneking (Table 21.4) and a system defined by the American Joint Commission on Cancer [16, 17] (Table 21.5) (AJCC). The former is useful for surgical planning, while the latter categorizes patient and monitor survival.
Table 21.4
Surgical staging of musculoskeletal tumors
Benign | |
1 | Latent |
2 | Active |
3 | Aggressive |
Malignant | |
IA | Low grade, intracompartmental |
IB | Low grade, extracompartmental |
IIA | High grade, intracompartmental |
IIB | High grade, extracompartmental |
III | Distant metastatic disease |
Table 21.5
American Joint Commission on Cancer (AJCC) bone tumor staging system
Stage IA | Primary tumor <8 cm in greatest dimension |
No regional nodes or metastases | |
Low tumor histologic grade | |
Stage IB | Primary tumor >8 cm in greatest dimension (or discontinuous tumors at primary site) |
No regional nodes or metastases | |
Low tumor histologic grade | |
Stage IIA | Primary tumor <8 cm in greatest dimension |
No regional nodes or metastases | |
High tumor histologic grade | |
Stage IIB | Primary tumor >8 cm in greatest dimension |
No regional nodes or metastases | |
High tumor histologic grade | |
Stage III | Discontinuous tumors at primary site |
No regional nodes or metastases | |
High tumor histologic grade | |
Stage IVA | Primary tumor any size |
No regional nodes | |
Lung metastases | |
Any tumor histologic grade | |
Stage IVB | Primary tumor any size |
Regional lymph node spread | |
Metastases | |
Any tumor grade |
2 Benign Tumors and Tumor-Like Lesions
2.1 Cystic Lesions (Box 21.2)
Box 21.2: Cystic Lesions of Bone
Simple bone cyst: cyst with thin fibrous lining | |
Location | Metaphysis to diaphysis, central |
Proximal long bones (humerus, femur, tibia) | |
Appearance | Well-defined, ovoid, lytic, expansile |
± Multiloculated, especially after fracture (fallen fragment) | |
No fluid–fluid levels | |
Aneurysmal bone cyst (ABC): large, giant cell-lined vascular spaces | |
Location | Pelvis, eccentric at metaphysis (femur, tibia, humerus) |
Posterior elements of the vertebrae | |
Appearance | Eccentric, radiolucent, bubbly, well-defined expansile mass |
Marked cortical thinning | |
Fluid–fluid levels, septations, no osseous matrix | |
Caveat | If MRI shows soft tissue component, consider other diagnosis |
Giant cell tumor: giant cells, usually after physes close | |
Location | Metaphysis, stops at physis (if open); eccentric |
Knee, the most common | |
Also distal radius and tibia; proximal humerus and femur; pelvis | |
Appearance | Lucent, no matrix calcification |
Well-defined non-sclerotic wall | |
Cortical thinning, no periosteal reaction | |
Secondary aneurysmal bone cyst in about 14 % | |
Unicameral or Simple Bone Cyst
Most simple bone cysts occur in the long tubular bones, especially the proximal humerus, proximal femur, and proximal tibia. They are usually encountered in children between nine and 15 years of age [18]. Discovery of the cyst may be incidental, or patients may present with pain after pathological fracture. Many simple bone cysts heal without treatment. Treatment may be indicated for cysts that do not heal on their own or that are at risk of fracture and includes disruption of the cyst wall, opening of the medullary canal, steroid injection, and/or filling the defect with a bone substitute [19]. Cysts of the lower extremity may also require structural support such as screw placement [20]. After treatment, cysts may recur (10–20 %), heal, and disappear completely or heal with residual deformity.
Imaging
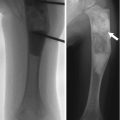
This well-defined, elongated, lytic expansile lesion arises centrally in the metaphysis and may extend into the diaphysis. It may show internal trabeculation, especially after remote fracture. A fallen fragment, a pathognomonic sign of a unicameral bone cyst, may be seen in the dependent part of the cyst after fracture [1, 5] (Fig. 21.4). In the absence of fracture, there should be no periosteal reaction.
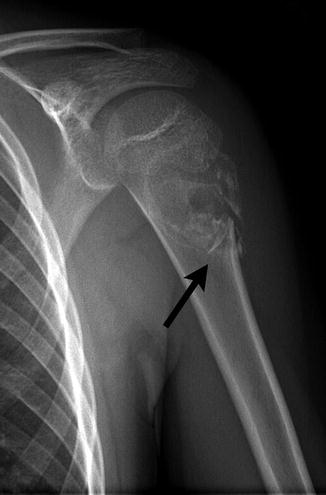
Fig. 21.4
Proximal humeral diametaphyseal simple bone cyst with pathological fracture and fallen fragment (black arrow)
Nontraumatized simple bone cysts may be indiscernible at bone scan, or they may show a slight reactive margin surrounding a photopenic center [21].
CT or MRI may be useful to further define cysts that have an atypical appearance or location, such as multiloculated cysts or cysts in complex areas such as the pelvis. At MRI, the fluid-filled cyst is usually isointense on T1-W images and hyperintense on T2-W images. There may be a thin rim of enhancement. Simple bone cysts do not demonstrate fluid–fluid levels [18]. Hemosiderin deposition may be observed. Fatty change may be seen within the cyst and is most often encountered in the calcaneus [13]. Especially after prior fracture, unicameral bone cysts may be multiloculated and demonstrate heterogeneous signal, nodular enhancement, and fluid–fluid levels [22].
Aneurysmal Bone Cyst
Aneurysmal bone cysts (ABC’s) are large, giant cell-lined vascular spaces filled with blood products. They are neither true cysts nor true aneurysms [18, 22]. ABCs may be primary or secondary, developing within a preexisting benign or malignant bone lesion such as giant cell tumor, osteoblastoma, chondroblastoma, fibrous dysplasia, hemangioma, or nonossifying fibroma (Fig. 21.3) [23]. Patients usually present during the second decade of life, with symptoms including escalating pain, bony mass, or pathological fracture. ABCs are most common in the pelvis; metaphyseal region of the femur, tibia, or humerus; or posterior elements of the vertebrae [18]. However, they may occur at any site in any bone. Treatment of ABC is typically surgical excision.
Imaging
Radiographs and CT demonstrate an eccentrically located, radiolucent, bubbly, well-defined expansile mass that causes marked cortical thinning. Septations are common, but there should be no osseous matrix. Rapidly expanding ABCs may have poorly defined margins and aggressive periosteal reaction [5].
Bone scan typically shows a “donut sign,” with moderate to intense uptake at the periphery and little activity in the center [21].
On MRI, ABCs are hypointense on T1-W images and hyperintense on T2-W images; septations are present, and low signal fibrous tissue lines the spaces [18, 24]. Fluid–fluid levels may be present, and there may be surrounding soft tissue edema. After gadolinium administration, the “cyst” walls and septations may enhance [25]. If solid tissue is present, the radiologist should consider a secondary ABC or an alternative diagnosis such as telangiectatic osteosarcoma [24].
Giant Cell Tumor
Giant cell tumors (GCTs) are very rare in children under 15 years of age and are more common in girls [1, 26]. They almost always develop after physeal closure. They are most often encountered at the knee but may also occur in the distal radius, distal tibia, proximal humerus, proximal femur, and pelvis [27]. GCTs are located in the metaphysis and do not cross the open physis [26] but may extend to the subchondral bone if the physis is closed. Patients may present with pain, swelling, limited range of motion, or pathological fracture. Treatment is usually surgical curettage/excision; occasionally, GCT may be treated with radiation therapy [28].
Imaging
On radiographs or CT, GCTs are solitary, well-defined, eccentric lytic lesions (Fig. 21.5). They lack matrix calcification and have well-defined but nonsclerotic margins. Cortical thinning is common, but periosteal reaction is unusual.
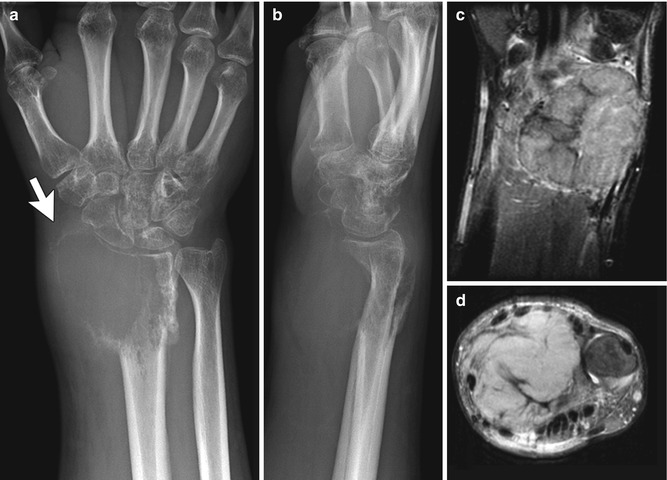
Fig. 21.5
Giant cell tumor in an 18-year-old male. (a, b) Expansile, ill-defined lytic bony mass extends to articular surface, and there is a large soft tissue mass (white arrow). Coronal T1-W FS (c) and axial proton density (PD) (d) images show a homogeneous lobulated mass that displaces adjacent structures. (Courtesy of John Hunter)
Scintigraphy shows increased radiotracer uptake on all three phases [21]. In nearly two-thirds of cases, delayed images show a nonspecific pattern of peripheral uptake with central decreased activity; diffuse increased uptake is sometimes evident [29]. Increased activity extends beyond the tumor margin.
At MRI, GCTs frequently demonstrate peripheral hypointensity on T1-W images and generalized hypointensity on T2-W images [26]. T2 hypointensity may result either from tumor cellularity or from recurrent intralesional hemorrhage. The solid portions of GCTs enhance diffusely after gadolinium administration, and cystic components demonstrate a delicate septal and peripheral enhancement pattern [26]. Reactive changes or edema at the outer cortical surface may mimic tumor extension [27]. Secondary ABC components are seen in about 14 % of GCTs.
2.2 Cartilaginous Lesions
Osteochondroma (Box 21.3)
Box 21.3: Osteochondroma
Most common pediatric benign tumor of the bone |
Usually in long bones, especially about the knee |
Metaphyseal, with growth away from epiphysis |
Sessile or pedunculated |
Continuity of periosteum, cortex, and medullary space from adjacent bone with osteochondroma |
Growth during childhood, but should cease at skeletal maturity |
Malignant transformation in about 1 % of solitary exostoses |
Multiple hereditary exostoses (diaphyseal aclasis) |
Autosomal dominant |
Multiple osteochondromas |
Malignant transformation in 5–25 % of patients |
Solitary osteochondroma is the most common benign bone tumor in children and is more common in males [30]. This tumor develops when a fragment of the epiphyseal growth plate cartilage separates and then herniates through the periosteum, or encoche of Ranvier, that normally surrounds the growth plate [31]. Osteochondromas develop only in the bone formed by enchondral ossification. They are an extension of normal bone and show continuity with the periosteum, cortex, and medullary space [5, 31].
Osteochondromas are most common in the long bones, especially about the knee (Fig. 21.6). More unusual sites include the ribs, small bones of the hands and feet, scapula, pelvis, and spine [31]. Osteochondromas may develop in areas exposed to radiation therapy [1].
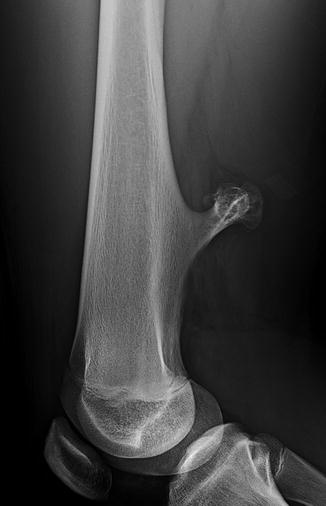
Fig. 21.6
Pedunculated osteochondroma in a teen. The cortex is intact, and the marrow trabeculae extend into the lesion
Osteochondromas may grow during childhood, but growth should cease at skeletal maturity. While lesions are usually asymptomatic, symptoms may result from osseous deformity, adjacent vascular injury, or neurologic compromise, fracture, or bursa formation. Osteochondromas may result in short stature. Malignant transformation, often to low-grade chondrosarcoma, occurs in about 1 % of patients with solitary osteochondroma and in 5–25 % of those with multiple hereditary extoses (MHE) [13, 24]. It is much more common in adults than in children.
Multiple hereditary exostoses (MHE, also known as diaphyseal aclasis) is an autosomal dominant disease characterized by multiple osteochondromas, with genetic loci including exostosin EXT1 on chromosome 8, EXT2 on chromosome 11, and EXT3 on chromosome 19 [31]. MHE can be classified into three groups based on the extent of distal forearm involvement [32]. In Group I, the distal forearm is normal. Group II patients have exostoses at the distal forearm, but no deformity. Group III patients exhibit shortening of either the distal radius or ulna as a result of osteochondromas. Those in Group III present at an earlier age and are most likely to experience malignant transformation.
Trevor disease, also known as dysplasia epiphysealis hemimelica, is a rare, nonhereditary developmental disorder of the epiphysis of long bones, most commonly the distal femur, proximal tibia, and talus (Fig. 21.7) [33]. This most often initially manifests in boys under age 10. Cartilage growth is abnormal, and enchondral ossification results in osteochondroma-like epiphyseal lesions, usually on the medial side of the joint, limited to one side of the body [1]. The disorder may involve one or more bones of a single joint or it may be more generalized, affecting all the joints of an entire limb (e.g., hip, knee, and ankle) [34].
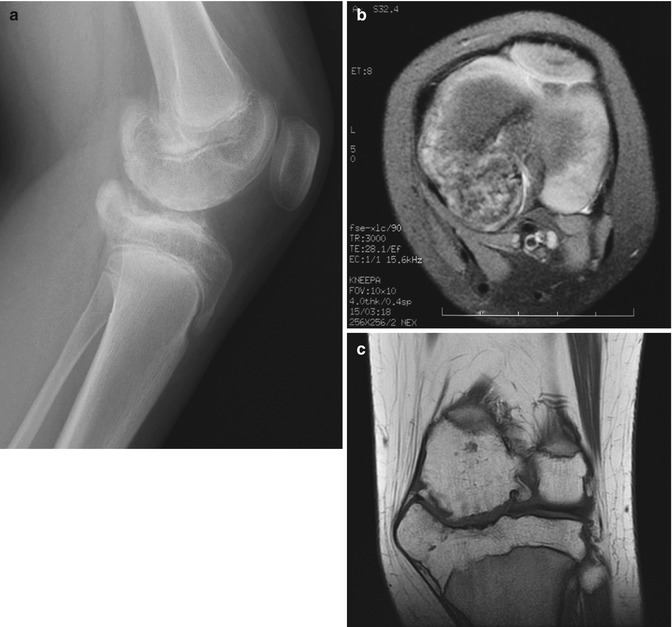
Fig. 21.7
Trevor disease. Radiograph (a), axial fast spin echo (FSE) MRI (b), and coronal T1-W image (c) show osteochondroma-like lesions at the epiphyses of the distal femur and proximal tibia (a copyright Shriners Hospital for Children Northern California)
Treatment for symptomatic osteochondromas is surgical resection. The entire cartilage cap and perichondrium must be removed to prevent recurrence.
Imaging
In the long bones, osteochondromas initially arise on the surface of the metaphysis and grow away from the nearest epiphysis (with Trevor disease, these are epiphyseal). However, with somatic growth, the lesions appear to migrate away from the metaphysis. The lesions can be sessile or pedunculated; pedunculated lesions are more likely to deform adjacent bones. The cortex appears intact, and the trabecular pattern extends into the lesion. In the absence of fracture, there should be no periosteal reaction.
Bone scintigraphy shows increased activity in metabolically active osteochondromas. Once skeletal growth is complete, activity in the lesions should diminish to normal. Bone scan does not reliably determine malignant degeneration [31].
While most osteochondromas can be diagnosed by radiographs, CT and/or MRI may be useful for atypical cases or for preoperative planning when better anatomical definition is needed [5]. Three-dimensional (3D) CT images may be especially useful (Fig. 21.8). Thin section CT facilitates detection of intraspinal osteochondromas, which may cause spinal cord compression [31]. MRI also allows evaluation of the cartilage that covers the end of an osteochondroma (the “cartilage cap”).
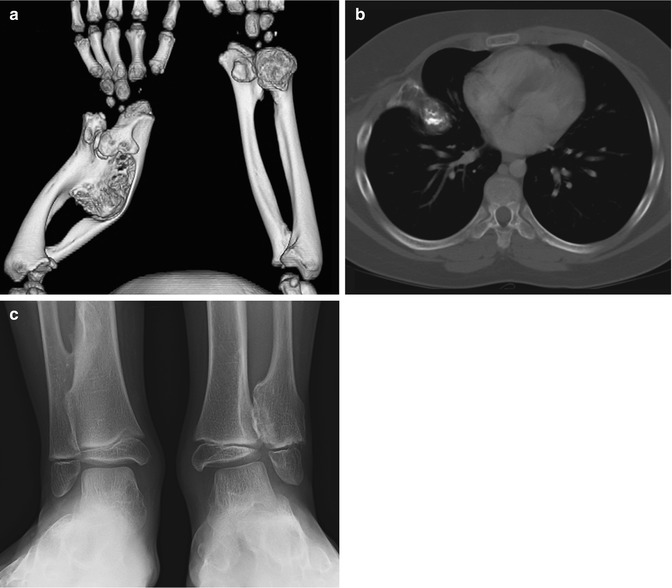
Fig. 21.8
Multiple osteochondromas in a 5-year-old boy. (a) 3-Dimensional (3D) CT reconstruction shows severe ulnar and radial deformity resulting from multiple osteochondromas. (b) Chest CT shows osteochondroma extending from the rib. (c) Multiple osteochondromas cause valgus angulation at the ankle
The cartilage cap should demonstrate intermediate signal intensity on T1-W images and hyperintensity on T2-W or STIR images. The perichondrium overlying the cartilage cap may appear as a thin, hypointense rim [13]. In children, the cap should be less than 3 cm thick.
The cartilage cap is the usual site of malignant transformation and is best assessed with fluid sensitive (T2-W or STIR) sequences. If the cartilage cap in a skeletally immature child exceeds 3 cm in thickness, the possibility of malignant degeneration should be considered (in adults, thickness greater than 2 cm should raise similar concern) [13, 23, 30]. Other features that suggest malignant change include growth of the cap after skeletal maturity, irregular cap contour, irregular lucencies or multiple foci of calcification within the lesion, soft tissue mass, irregular interface between cartilage and bone, and bony destruction [3].
Enchondroma (Box 21.4)
Box 21.4: Enchondroma
Second most common pediatric benign bone tumor |
Abundant mature hyaline cartilage |
Most often in small tubular bones of hands and feet |
Can arise in any bone |
Central, well-defined, lucent expansile mass with endosteal scalloping |
Chondroid calcifications in about 50 % |
Ollier disease (enchondromatosis): multiple enchondromas |
Maffucci syndrome: multiple enchondromas and venous malformations |
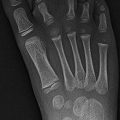
Enchondromas are the second most common benign pediatric bone tumor [1] and are characterized by the presence of abundant mature hyaline cartilage. They are most often encountered during the second decade and occur most frequently in the small tubular bones of the hands and feet (Fig. 21.9), although they can occur in any bone (Fig. 21.10). Patients may present with deformity or pain during times of rapid growth. Pain after skeletal maturity should raise the concern for malignant transformation or pathological fracture.
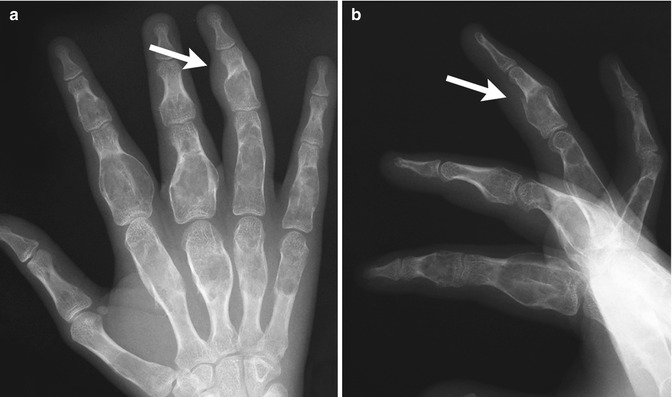
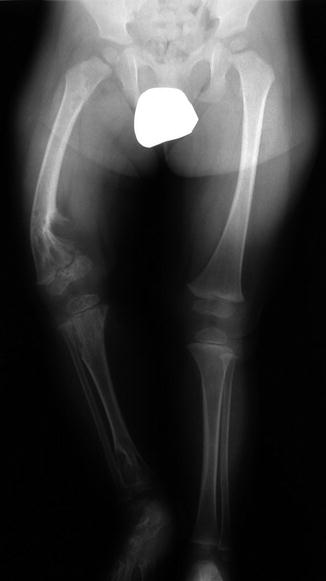
Fig. 21.9
Multiple enchondromas in the phalanges and metacarpals in a 13-year-old girl. There is a pathological fracture (arrow) through an enchondroma (Images courtesy of Shriners Hospital for Children Northern California)
Fig. 21.10
Multiple enchondromas in a 1-year-old boy with Ollier disease. The right leg is shorter, and there is bowing of the distal right femur (Image courtesy of Shriners Hospital for Children Northern California)
Ollier disease, or enchondromatosis, is a nonhereditary condition that occurs when abnormal growth plate cartilage leads to the development of multiple enchondromas. Patients may have leg length discrepancy due to asymmetrical involvement of the lower extremities. Maffucci syndrome consists of venous malformations in addition to multiple enchondromas. Malignant transformation of enchondroma to (usually) chondrosarcoma may occur in up to 30 % of patients with Ollier disease [1] and in up to half of those with Maffucci syndrome [35].
Imaging
Enchondromas are central, well-defined, expansile masses that cause endosteal scalloping. Chondroid calcifications are seen in about 50 % of cases [5]. At MRI, they appear as lobulated T1-hypointense and T2-hyperintense lesions that may contain hypointense foci of calcification [30]. Chemical shift artifact may be present, due to intralesional fat. Contrast-enhanced (CE) images may show a “ring and arc” pattern corresponding to fibrovascular tissue at the periphery of the avascular lobules of hyaline cartilage [24].
Related posts:
Stay updated, free articles. Join our Telegram channel

Full access? Get Clinical Tree


