, Valery Kornienko2 and Igor Pronin2
(1)
N.N. Blockhin Russian Cancer Research Center, Moscow, Russia
(2)
N.N. Burdenko National Scientific and Practical Center for Neurosurgery, Moscow, Russia
The sellar region usually consists of the Turkish saddle with adjacent structures located near the CSF cisterns with the hypothalamus, the bottom of third ventricle, and the cavernous sinus. Metastases to this area do not occur often, and in our cases, we observed this process more often in breast cancer. The main issue of the differential diagnosis is the clinical picture, including hormonal changes in the anterior pituitary, which may be characteristic of a number of primary tumors of the sellar region (Fig. 35.1).
Fig. 35.1
MRI with contrast enhancement. Metastasis (a), meningioma (b), astrocytoma (c), adenoma (d). Differential diagnosis: all lesions are characterized by intense accumulation of the contrast agent and the suprasellar spread
35.1 Pituitary Adenoma
Pituitary tumors occupy the third place among the central nervous system neoplasms and, according to different authors, range from 4% to 17% (Kadashev 1992). Based on their size, pituitary adenomas are classified as microadenomas (10 mm) and macroadenomas (over 10 mm).
Visualization of macroadenomas with modern CT and MRI does not present too much difficulty (Kornienko 1993; Konovalov 1997; Dedov 1997; Kornienko 2012). More difficult in this case becomes the differential diagnosis with other space-occupying lesions of the optic chiasm and sellar region (Asa 2008). Thus, in most of our cases, the tumor had extrasellar growth at the time of initial diagnosis. In these cases, it is important to determine the extent of the process and its association with the lesions in the parasellar region, such as the optic chiasm, optic nerves, internal carotid artery, cavernous sinus, etc.
In the study using CT, the destruction of the sellar walls is identified. Pituitary tumors can spread parasellarly into the middle cranial fossa and anteriorly to the bottom of the anterior cranial fossa and into the main cavity of the sphenoid sinus and ethmoid cells.
On spiral CT, adenoma in the absence of an intratumoral hemorrhage is usually iso- or weakly hyperdense relative to the brain substance. Hemorrhage areas have higher density in the acute phase.
On T1-weighted MR images, macroadenomas typically look like space-occupying lesions coming from the cavity of the dilated and deepened Turkish saddle and are characterized by an iso- or hypointense MR signal. The intact anterior pituitary can be traced along the adenoma contour as a brighter fragment. In T2-weighted and T2-FLAIR images, macroadenomas are characterized by a high signal more often than microadenomas. Following intravenous contrast enhancement, there is quite pronounced accumulation of the contrast material by adenoma, making it hyperintense relative to the brain, in most cases.
On MR spectroscopy, we found a marked increase in the choline peak and an increase in the lipid-lactate complex peak on the background of a decrease in the N-acetylaspartate peak in pituitary adenomas.
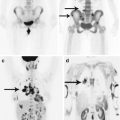
The study of tumor hemodynamics has become an important part of a comprehensive evaluation of pituitary adenomas, especially those that are accompanied with hemorrhages. The method of CT perfusion imaging in the diagnosis of skull base tumors and, in particular, in the differential diagnosis of pituitary adenomas showed high sensitivity and high specificity in verification of histology of neoplasms. Low values of blood flow velocity (sometimes comparable to those of the brain), a moderately pronounced CBV increase, and very high values of the transit time МТТ are typical for pituitary adenomas, no matter what size they reach. These properties help perform a differential diagnosis of pituitary adenomas from other lesions, including parasellar metastases in most cases (Figs. 35.2 and 35.3).
Fig. 35.2
Pituitary adenoma. On a CT series before (a, b) and after (c, d) contrast enhancement, there is a large pituitary tumor with predominantly laterosellar growth to the right, where a cystic part of the tumor is further visualized (a hypodense area). The tumor rapidly accumulates CA. CT perfusion of CBV (e), CBF (f), and MTT (g) shows an increase in the blood flow volume and prolongation of the contrast agent transit time. Changes in the blood flow velocity in adenoma are characterized by a minimal increase in comparison to the brain tissue. On T2-weighted MRI (h, i), the tumor structure, spread, and enveloping of carotid siphons are clearly visualized
Fig. 35.3


Pituitary adenoma. On CT with contrast enhancement, there is an intra-suprasellar tumor intensely accumulating the contrast agent (a, b). Perfusion maps show low CBF values (c) and prolongation of the transit time (d)
Related posts:

Stay updated, free articles. Join our Telegram channel
Full access? Get Clinical Tree
