, Valery Kornienko2 and Igor Pronin2
(1)
N.N. Blockhin Russian Cancer Research Center, Moscow, Russia
(2)
N.N. Burdenko National Scientific and Practical Center for Neurosurgery, Moscow, Russia
The phenomenon of nuclear magnetic resonance (NMR) was discovered and studied in the 1950s of the twentieth century. Two groups of British physicists under the leadership of Bloch and Pursell determined physical and chemical factors, such as proton density and the so-called relaxation parameters, times of longitudinal (T1) and transverse (T2) substance relaxation, on which the value of the detected MR signal depended. Hahn (1950) developed an in vitro method for measuring the substance relaxation parameters using a sequence of radio pulses, called a pulse sequence (PS) “spin echo” (SE) (Hahn 1950; Bloch et al. 1946; Pursell et al. 1946).
In 1973 Lauterbour proposed to separate the MR signal from a layer inside an object with an additional magnetic field G z , changing linearly with distance in the direction of the main magnetic field of the magnet (gradient magnetic field). In the same year, Mansfield established a link between the frequency (phase) change of MR signals and the coordinates of voxels in the layer. He used two additional mutually perpendicular gradient magnetic fields G х and G у to set the coordinates of each element in the tomographic section and applied the Fourier analysis to extract MR signals from the registered data from each voxel in a given layer. This approach allowed to reduce the time obtaining tomographic cross sections down to a few minutes (Mansfield 1977). Lauterbour and Mansfield were awarded the Nobel Prize in Physiology or Medicine Prize in 2003 for the creation of MR imaging methods that were implemented in modern MRI scanners.
A detailed description of NMR physics and imaging principles intended for diagnosticians can be found in many monographs (Edelman et al. 1996; Konovalov et al. 1997a, b, c; Rink 2003).
A variety of tissue contrast ranges in MR images provide a wide set of pulse sequences, which represents greater possibilities for characterization of various CNS tissues than CT and is one of the advantages of MRI.
Standard or routine sequences used in the study of patients with brain metastases are T1, T2, and T2*. T1-weighted images are fundamental for detection of impairment and abnormalities of normal brain anatomy. Volumetric scanning 3DSPGR or VIBE allows to obtain T1-weighted high-resolution images with a 1.0 mm slice thickness and is currently used in routine diagnosis of metastatic brain lesions.
T2-weighted images are intended for visualization of edema and the presence of water in the tissues; SP T2-FLAIR suppresses the MR signal from free water (e.g., CSF) and better identifies hydration foci, demyelination, and hemorrhages in the brain tissue.
*T2-weighted images reflect the tissue magnetic susceptibility (Haacke et al. 2010, Kornienko and Pronin 2009a, b, c, d, 2010). The next step in the use of SP gradient echo became SWI (SWAN) sequences that are used to detect hemorrhages in metastatic brain lesions (Pronin et al. 2011; Dolgushin et al. 2012a, b; Haacke et al. 2010).
T1 MRI with intravenous contrast enhancement is often used in the diagnosis of neoplastic brain lesions, including metastases. MRI contrast agents (MRCA) are agents based on a paramagnetic material gadolinium (Gd), which shorten the T1 relaxation time. As a result, images of tissues that have accumulated MRCA will be bright in T1-weighted MRI. The concentration of gadolinium surrounded by a chelate providing stability of the product in the internal media of the human body may be from 0.5 mM/ml and 1.0 mM/ml in MRCA. During the standard procedure (neuro-oncology), a patient is administered 0.2 ml of the drug at the concentration 0.5 mm/ml/kg of body weight and 0.1 ml at the concentration 1.0 mM/ml. For a qualitative assessment of MRI signs of a tumor on tomograms, a subjective scale is generally utilized: the MR signal in the tumor can be isointense as compared to the brain matter on the contralateral side, hypointense or hyperintense. On T1-weighted images, MRI with contrast enhancement assesses only the degree of an increase in the MR signal intensity in the tumor (no enhancement, moderate and significant enhancement). A semiquantitative assessment of an increase in the relative tumor intensity on MRI with contrast enhancement (CE) is widely used in neuro-oncology, because of the simplicity of calculations and the information value of this parameter for neoplastic and nonneoplastic CNS lesions.
With contrast enhancement, even in the absence of clinical symptoms, metastases are detected in nearly 100% of cases (Kornienko et al. 2007). The use of intravenous bolus administration of MRCA allows to utilize the perfusion technique based on a decrease in the MR signal intensity on the T2 and T2* MRI in the diagnosis of brain metastases (Huisman and Sorensen et al. 2004).
Semiotics and differential diagnostic criteria for metastatic brain lesions, based on the results of the use of routine sequences (T1, T2, and T2-FLAIR) on the background of various doses of contrast agent, were discussed in sufficient detail in numerous publications (Konovalov et al. 1997a, b, c; Osborn 1994; Sze et al. 1998; Kornienko and Pronin 2008a, b, 2009a, b, c, d).
Standard MRI sequences can detect tumors and intratumoral changes (hemorrhage, necrosis) and assess the size of a peritumoral edema. In Т1-weighted image, metastases may have various signal characteristics with respect to the brain substance. If the tumor lesion has a lower signal (Fig. 9.1) than the intact brain substance, edematous brain tissue that is hypointense in this sequence makes it difficult to clarify the size, shape, and boundaries of the tumor. In case of a mild edema and a small metastasis (less than 1 cm in diameter), the latter may not be detected in T1-weighted image. According to our data, in T1-weighted image, metastases mainly (90%) have a hypo- and isointense MR signal in relation to the brain substance. A hyperintense signal within an MTS is less common (up to 5.5% of the cases) and is generally encountered in case of a hemorrhage (metastatic melanoma, renal cell carcinoma).
Fig. 9.1
Brain metastases from a variety of primary tumors. Variants of signal intensity on T1-weighted images in relation to the brain substance: (a) hyperintense, (b) hypointense, (c) heterogeneous, and (d) isointense
Some metastatic tumors have a number of pathognomonic imaging manifestations that allow to assume the nature of the primary tumor with a high probability, even based on routine investigations. Thus, the characteristic feature of melanoma in an MRI study is an increased signal in T1-weighted image before contrast enhancement, since melanin is characterized by paramagnetic properties. A heterogeneous and increased MR signal in many observations is usually associated with the presence of a hemorrhage in the tumor tissue.
On Т2-weighted images, metastases are characterized by an iso- or hypointense signal relative to the gray matter from the tumor stroma, an increased signal in the central necrotic area and an area of perifocal edema. Particularly noteworthy are colorectal adenocarcinoma metastases that were characterized by a marked hypointense signal in T2-weighted image in 83% of our cases (Fig. 9.2); some of them showed signs of moderate central necrosis; the presence of perifocal edema was noted in 100% of cases.
Fig. 9.2
Visualization of colorectal cancer metastases in the brain in T2-weighted image. A solid tumor component has a hypointense (a–d) or iso-hyperintense (e, f) signal in relation to the brain substance. In some cases, there are signs of central necrosis in metastatic lesions
Small metastatic lesions without the use of CA can be detected on T2-weighted images by the presence of a peritumoral edema characterized by a hyperintense signal (Fig. 9.3). In the presence of a chronic or acute hemorrhage in the metastasis stroma, hypointense areas can be observed, while the tumor tissue has a heterogeneous MR signal. However, it must be kept in mind that detection of metastases may be difficult, especially in small tumors with mild perifocal edema of the brain substance.
Fig. 9.3
Brain metastases from a variety of primary tumors. Variants of signal intensity on T2-weighted images in relation to the brain substance: (a) isointense, (b) hypointense, (c) heterogeneous, and (d) hyperintense
T2-FLAIR sequence used in the standard MR protocol in metastatic brain lesions usually has two purposes: specification, along with T2 mode, of detected small tumor lesions without the use of a contrast agent and visualization of additional signal changes in the metastatic tissue structure. Most often, in this sequence, a metastatic lesion has a hypointense MR signal relative to the gray matter. A heterogeneous signal is always detected in the presence of a hemorrhage in the tumor tissue. If an MR signal from small metastases is isointense, with a mild perifocal edema of the brain substance, it is difficult to identify the boundaries of the lesion and sometimes of the metastasis itself (Fig. 9.4).

Fig. 9.4
Brain metastases from a variety of primary tumors. Variants of signal intensity on T2-FLAIR-weighted images in relation to the brain substance: (a) isointense, (b) hypointense, (c) hyperintense, and (d) a heterogeneous tumor lesion
The use of T2-FLAIR sequence is also justified in the presence of solitary metastases. One of the most common primary brain tumors is glioblastoma . It is typically slightly hyperintense relative to the cortex in this sequence, which is regarded as one of implicit signs of differential diagnosis when comparing these tumors.
Contrast enhancement in MRI, as well as in CT, has a high diagnostic value. Structure of the lesion, spread and invasion of surrounding tissues, the number of lesions and hemodynamic characteristics of the tumor are identified best on the background of contrast enhancement. In case of brain metastases, the use of contrast agents is an obligatory link in the standard protocol of any diagnostic CT/MRI study. In literature, there is still debate over the possibilities and feasibility of the use of high doses of contrast agents for metastatic brain lesions. According to Sze et al. (1998), in 70 patients with negative results on MRI with a standard contrast agent dose out of 92 patients with confirmed or suspected metastatic brain lesions, administering a triple dose of the contrast agent did not help identify any additional lesion. Yuh et al. (1992), as well as other researchers, identified additional lesions after using a triple dose of the contrast agent in MRI only in a small number of cases (Akeson et al. 1995; Vogl et al. 1995; Tatsuno et al. 1996; Gasperini et al. 2000; Rowley et al. 2008; Attenberger et al. 2009).
A study using T1-weighted sequence with contrast enhancement can detect both large and pinpoint lesions of pathological CA accumulation not visualized with other types of contrast enhancement. However, according to Mintz et al. (2004), there is always a danger of a false-positive result. For example, in case of telangiectases or when the slice plane is perpendicular to the blood vessel, there is a possibility of erroneous interpretation of findings in favor of a nonexistent small metastasis. In such situations, it is advisable to use volumetric scanning programs. 3D FSPGR (T1-weighted sequence) allows to neutralize an increase in the signal from the blood flow; in some cases, constructing multiplane images or reformats allows to “remove” the course of the blood vessel and thus eliminate the seeming presence of a small metastatic lesion.
MRI with contrast enhancement as compared to CT allows to obtain the largest amount of diagnostic information regarding the tumor and conduct differential diagnosis between focal brain lesions similar in the standard modes by their visualization characteristics. Metastases, meningiomas, benign astrocytomas, lymphomas, and neuromas without contrast enhancement may look similar on CT and MRI. However, when there is a massive hemorrhage in the tumor, the use of contrast enhancement is often uninformative (Fig. 9.5).
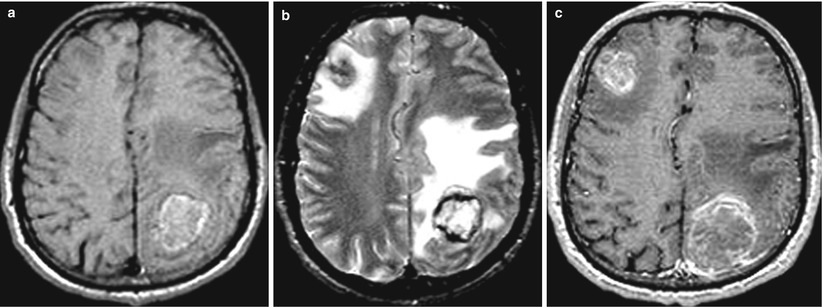
Fig. 9.5
Multiple lung cancer metastases in the brain. (a) T1-weighted image before injection of CA: there is a marked hyperintense (due to the hemorrhagic content) space-occupying lesion with signs of pronounced perifocal edema in the left parietal region. The lesion in the right frontal region is visualized on the background of edema in T2-weighted image (b) and after the administration of a contrast agent (c)
Special attention was paid in our studies of patients with metastatic brain tumors to the specifics of CA accumulation by metastases of different origins. An MRI study with contrast enhancement determined the extent, nature, and time of CA accumulation and elimination from the area of interest. The main types of CA accumulation in the tumor tissue were identified based on the analysis of findings obtained: “target,” “blurred contour,” “in the form of a rim with clear contours,” “heterogeneous,” “annular,” “annular with a solid area,” and “homogeneous.” We will use this classification of CA accumulation hereinafter. The typical visualization features for each type of CA accumulation will be review below.
“Target”: CA accumulations as “blurred contour” and “in the form of a rim with clear contours” were combined in one group—both types are ring shaped with a “clearing” in the center, indicating the presence of tumor tissue decay in the middle area of the lesion. CA accumulation in the form of “blurred contour” is characterized by the presence on the periphery of the contrast enhancement of pointed areas (protrusions) that transit into the surrounding brain tissue without any clear contours. In another type of CA accumulation (“in the form of a rim with clear contours”), MR image of the lesion is annular but with a dense homogeneous halo with a clear, sharp boundary between the CA area and the brain substance (Fig. 9.6). Perifocal edema in metastases of these types of CA accumulation is very significant. Such metastases differ by different lesion sizes and various widths of a “ring” of CA accumulation. We observed CA accumulation in the form of a “target” in 36.8% of cases of breast cancer metastases (Dolgushin 2012).
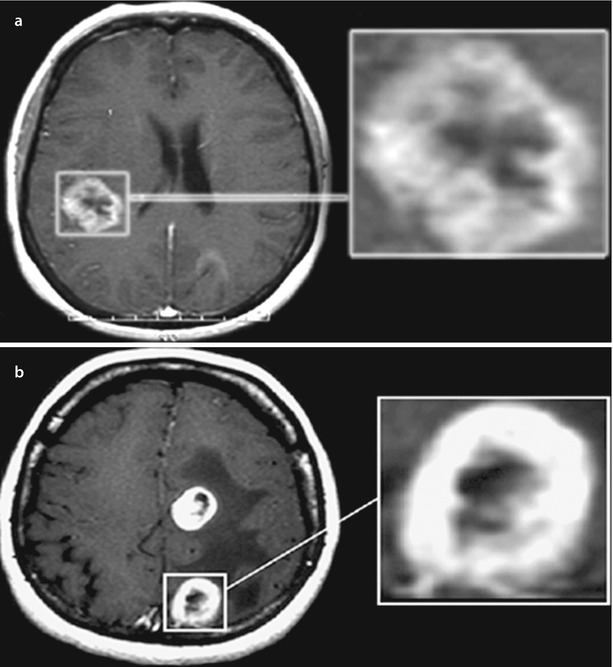
Fig. 9.6
Brain metastases. Types of contrast agent accumulation in MRI: (a) a rounded lesion with signs of “blurred contour” and (b) another rounded lesion with mostly clear contours of contrast enhancement. In both cases, there was central necrosis in the tumor
A “heterogeneous” type is characterized by separate sites of CA accumulation with different sizes in different areas of the tumor (Fig. 9.7). In this type, in contrast to the two previous types of CA accumulation, clarification areas on the scan, corresponding to portions of necrotic tumor decay, are randomly located within the pathological focus. This type of CA accumulation is also observed in cases of hemorrhages in the tumor tissue, with the intensity of MR signal from blood clots sometimes exceeding that of the contrast-enhanced tissue. The extent of the perifocal edema varies and depends more on the characteristics of the tumor site and its size.
Fig. 9.7
A brain metastasis. Types of contrast agent accumulation in MRI: CA accumulation of heterogeneous type in the tumor stroma. There are no large areas of necrotic tumor decay
“A ring” is characterized by the accumulation of CA in the form of a thin, closed, annular rim, and we observed it in our clinical material in 15% of cases. This “ring,” as such, can have different shapes; therefore, this definition is quite arbitrary. No hemorrhages into the tumor tissue were observed in this type of CA accumulation. The signal from the central area of metastasis in all scan sequences was almost homogeneous. In solitary or even multiple brain metastases, lesions characterized on MRI scans by a similar type of CA accumulation most often have to be differentiated from brain abscesses. Tumors characterized by CA accumulation in the form of a “ring” almost completely lack a perifocal edema surrounding the brain substance (Fig. 9.8).
Fig. 9.8
Brain metastases. Types of contrast agent accumulation in MRI: a rounded lesion in the left hemisphere of the cerebellum with signs of annular (thin) CA accumulation. There is additionally a small, homogeneous lesion in the right hemisphere
“Ring + tissue” in cases where a solid part of the tumor accumulating CA is adjacent to the annular “rim”: we defined this type of manifestation of metastases as “ring + tissue.” An annular cystic component is not in the center but is adjacent to the solid part of the tumor. There are sometimes areas of hemorrhages (in the solid portion). A perifocal edema in cases of such MR manifestation of tumors is quite significant (Fig. 9.9).
Fig. 9.9
A brain metastasis. Types of contrast agent accumulation in MRI: a rounded thin-walled lesion with annular CA accumulation in the anterior tumor fraction and with a solid portion in the posterior portion
A “homogeneous” type of CA accumulation is the most frequent MRI picture of the tumor lesion (30.8%). It is characterized by uniform accumulation of contrast agent in metastases represented by a solid lesion, while the degree of CA accumulation may be different. The brain edema in this type of MRI manifestations of the tumor is significant (Fig. 9.10).
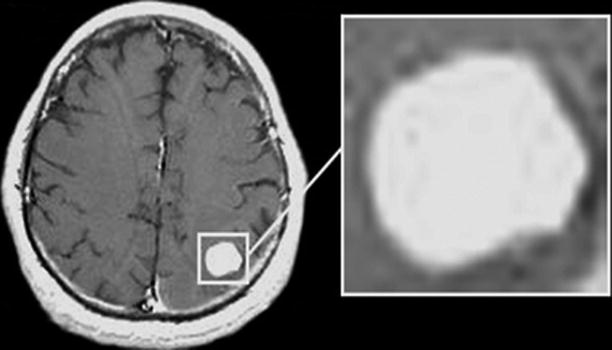
Fig. 9.10
A brain metastasis. Types of contrast agent accumulation in MRI: a rounded lesion accumulating homogeneously CA. There are no cystic or necrotic inclusions
Distribution of observations based on the accumulation characteristics of contrast agent in brain metastases is shown in Table 9.1.
Table 9.1
Variants of contrast agent accumulation in MRI study of focal brain lesions (n = 130)
Type of contrast enhancement | “Target” | Heterogeneous | “Ring” | “Ring + tissue” | Homogeneous | Total | ||
|---|---|---|---|---|---|---|---|---|
“Unclear contour” | “Clear contour” | n | % | |||||
Amount | 9.2% | 17.7% | 13.9% | 15.3% | 13.1% | 30.8% | 130 | 100 |
There is no significant relationship between the type of CA accumulation and abnormal structure of the primary tumor. Metastases of different etiologies may be contrasted in the form of a “target.” The same is applicable to other CA accumulation patterns. Differences in CA accumulation by metastases, in our opinion, are due to, first of all, their size, duration of existence, intensity of the tumor growth, and metabolic activity of the tumor tissue, which manifests by the absence or presence of areas of necrosis, decay, and bleeding in the abnormal focus. The confirmation of this can be seen in one of our cases, when, in multiple brain metastases, a few different types of CA accumulation were found, as well as the detection of the same type of contrast in metastatic tumors that differed in their histogenesis (Fig. 9.11).
Fig. 9.11
Multiple lung cancer metastases in the brain. Brain MRI with contrast enhancement in two different patients. (a) Multiple brain lesions with different variants of MR manifestations of metastatic lesions. (b) Multiple brain lesions in the form of homogeneous similar foci with different sizes. In the first case (a), lesions with mixed structure are identified: solid lesions with a cystic structure and signs of central necrosis (arrows). The largest tumor lesion in the right frontoparietal region also has a cystic structure with the signs of hemorrhagic content and a liquid “level” (arrow), with the lesion size being an indirect evidence of its “age.” In the second case, all lesions have a solid structure and intensely accumulate the contrast material (arrows)
9.1 A Double Dose of Contrast Agent
A standard dose of CA in the diagnosis of metastatic lesions in the brain is 0.2 ml/kg of body weight with the concentration 0.5 mg/ml. In multiple metastatic brain lesions, administration of increased doses of the contrast agent sometimes allows not only to more accurately assess the boundaries of a tumor detected under standard contrasting conditions but further identify small metastatic lesions (Figs. 9.12 and 9.13).
Fig. 9.12
Multiple metastatic brain lesions. T1-weighted images. Small lesions homogeneously accumulate contrast agents, with larger ones having the form of a “ring.” (a) Before contrast enhancement, tumor lesions have a homogeneous hypointense signal. (b) After administration of the contrast agent at the standard dose of 0.2 ml of the product (at the concentration 0.5 mg/ml) per kg of body weight of the patient, there is a moderate increase in the signal from larger lesions. (c) After administration of a double dose of 0.4 ml with the concentration 0.5 mg/ml per kg of body weight of the patient, there is an expressed signal increase from the previously detected lesions and additional small metastases
Fig. 9.13
Multiple metastases with sub- and supratentorial location. On T1-weighted MRI (a–f), following administration of a triple dose of the contrast agent, there are multiple tumor lesions with a solid structure on different scans. Small (less than 5 mm) metastatic lesions are also clearly visualized
In case of involvement of bone structures or meninges, it is extremely important to use protocols with suppression of MR signals from fat (fat saturation), which allows to identify metastases located in the soft tissues and bones of the head in T1-weighted images with contrast enhancement (Fig. 9.14).
Fig. 9.14
Melanoma metastases. A relapse of the metastatic tumor after its surgical removal. MRI shows a space-occupying lesion in the occipital bone, extending to the adjacent meninges. The metastasis is characterized by a hyperintense signal on T2-weighted and T2-FLAIR MRI (a, b) and an isointense signal in T1 (c); after IV contrast enhancement on T1-fat sat MRI (d), there is intense accumulation of contrast agent in its structure (arrow)
Increasing the concentration of administered CA can result in its increased accumulation in large brain sinuses (in particular, in transverse sinuses), which can produce artifacts on T1-weighted MRI. Areas with emerging artifacts often follow the contours of end sections of the transverse sinuses, which may both overlap with space-occupying lesions with small sizes and mimic the latter on the background of blood pulsations and contrast enhancement (Fig. 9.15).
Fig. 9.15
Brain MRI in the axial projection of the patient with a suspected metastatic brain lesion before (a) and after (b) administration of CA. The patient had a history of colorectal cancer. The arrow indicates an artifact from blood pulsation in the transition region of the transverse sinus into the sigmoid one. This artifact can overlap with the lesion or mimic it
In the event of such a questionable matter, a follow-up study should be performed with the same positioning of the sections, but changing the direction of phase-encoding gradient pulse, so that the artifact will be seen in a different direction, or sections in other projections should be used.
Difficulties of differential diagnosis using a standard MRI study with contrast enhancement most often occur in solitary lesions, when, first of all, intracerebral tumors (usually glioblastoma) and brain abscess should be excluded.
9.2 Additional MRI Techniques
The so-called volumetric scan sequences are included in the standard MRI investigation protocols for visualization of the anatomical features of abnormalities: 3D FSPGR, BRAVO/VIBE (T1), CUBE (T2), FIESTA (T2), 3D FLAIR (T1/Т2), etc. Volumetric 3D scanning sequences allow to reduce the total study duration, perform 0.6–1.0 mm sections, as well as build 2D and 3D reformats and anatomical 3D models with high anatomical resolution and isotropic voxel, which is important for navigation programs and planning the radiation treatment. Today, due to the possibility to obtain images with diverse tissue contrast, MR imaging is a highly efficient and sensitive method of detecting not only tumors but also assessing some intratumoral processes, such as hemorrhages and arteriovenous shunts.
9.3 3D T1-Weighted Sequence
The pulse sequence 3D FSPGR (or VIBE) in metastatic brain lesions produces high-resolution MR images with slice thickness of less than 1 mm. Currently, the use of 3D T1-weighted images is routine not only in the preoperative diagnosis but also in the basic protocol for radiosurgery. An appropriate dose of the contrast agent allows to detect lesions not visualized by other MR sequences (Fig. 9.16).
Fig. 9.16
Multiple melanoma metastases in the brain. On T2-weighted (a), T1-weighted (b), and DWI (d) MRI, metastatic lesions are not visualized in the brain substance. In T2-FLAIR sequence (b), multiple small foci are determined that are poorly visualized and mimic ischemic lesions. After contrast enhancement on T1-weighted MRI, pinpoint metastatic lesions are clearly visualized (e, f)
MRI possibilities are not limited to standard techniques and contrast enhancement. Currently, neuroimaging extensively uses additional diagnostic MR technologies, such as SWI (SWAN), MR spectroscopy, perfusion MRI, and diffusion and diffusion tensor MRI, based on the diversity of tissue contrast types in magnetic resonance imaging. Most of the additional MR technologies and investigation protocols based on them not only provide a picture of anatomical changes but also imply obtaining quantitative characteristics of a particular pathological process, associated with the specifics of its metabolism and hemodynamics.
As known, one of the most effective treatments for metastatic brain lesions, especially multiple ones, is radiological methods and, above all, Gamma Knife and CyberKnife. MRI with contrast enhancement is a mandatory procedure to evaluate the effectiveness of the treatment of cerebral neoplastic lesions, including after radiosurgery (RS).
A favorable outcome of RS in our material (n = 490, 88.4%) was a reduction in the tumor volume up to a complete disappearance of regions with abnormal contrast agent accumulation, reduction of the perifocal edema, and regression of neurological symptoms. When the size of tumors decreased as a result of radiation treatment, pinpoint contrasted areas persisted without any signs of increased perfusion indicators in 95% of 490 cases. In 5% of cases, positive changes were characterized by a complete disappearance of areas of abnormal CA accumulation and regression of edema. Analysis of the extent of reduction of metastatic lesions in size in the control group (n = 45) showed that a pronounced and moderate decrease in the tumor size (more than 50% within the first 3 months) was identified in 85% and 15% of patients, respectively (Fig. 9.17).
Fig. 9.17
Colorectal cancer metastases in the brain. Cases of two patients with incomplete (a, b) and complete (c, d) response to RS treatment. Partial response: (a) before treatment and (b) after treatment. Complete response: (c, d) 3 months after the radiosurgery
9.4 SWI (SWAN)
In the 1990s of the last century, the use of SP T2* GRE for visualization of venous structures was started. Such MRI studies were called BOLD (blood oxygenation level-dependent) venography (Lee et al. 1992; Reichenbach 2001). In T2-weighted* images, venous structures were well seen; however, the images contained artifacts due to magnetic susceptibility. In 1997, a way was developed to eliminate phase artifacts at “air-to-brain” and “bone-brain” interface and display within each voxel local phases of interest in terms of tissue magnetic susceptibility (Haacke et al. 2007).
Pulse sequences SWI (SWAN) (susceptibility-weighted imaging) and SWI (SWAN) (T2 star-weighted angiography) that are based on high-resolution 3D T2* GRE with the possibility of obtaining an isotropic voxel with full compensation of flow effects, sensitive to blood products, particularly to deoxyhemoglobin of venous blood, allowed to obtain images “weighted” by the tissue magnetic susceptibility (Haacke et al. 2010;. Pronin et al. 2011; Dolgushin et al. 2012a, b; Zakharova et al. 2013). Local inhomogeneity of the magnetic properties of tissues (due to the differences in their magnetic susceptibility) creates dephasing of proton precession within each voxel. This dephasing manifests in the amplitude and phase images in the form of a reduction in MR signal. SWI (SWAN) uses amplitude images, and SWI (SWAN) uses both phase and amplitude images. The SWI (SWAN) sequence is most commonly used. The combination of amplitude and phase components in the data processing allows to obtain images, whose contrast is due only to the magnetic susceptibility—i.e., to map magnetic susceptibility in order to quantify the magnetic properties of tissues in terms of the chemical shift in parts per million (ppm).
A decrease in the MR signal intensity in SWI (SWAN) sequence due to the deoxyhemoglobin presence allows to visualize some anatomical and primarily venous structures. Hemosiderin deposits as the main sign of a hemorrhage can be detected in the SWI (SWAN) sequence, which allows to visualize the effects of hemorrhages, even in intervals remote from the event. SP SWI (SWAN) visualizes lesions of microhemorrhages with sizes up to 5 mm (Haacke et al. 2010).
The tissue magnetic susceptibility in the amplitude SWI (SWAN) images is assessed by the presence of areas of the MR signal with reduced intensity. Pinpoint hypointense areas in the parenchyma are regarded as a cross section of the deformed, abnormal vessels (the form of a “point”). Areas with the similar signal intensity but larger (>2–3 mm) are considered microhemorrhages (the form of “lumps” or “micronodules”). The lack of any hypointense inclusions is interpreted as a homogeneous solid tumor without abnormal deformed vasculature and hemorrhages. The signal constancy from hypointense areas in the SWI (SWAN) sequence after CA administration confirms the presence of a hemorrhage (Dolgushin et al. 2012a, b).
Standard parameters of the SWI (SWAN) sequence in the magnetic field of 3.0 T have the following values: TR, 82–91.5 ms; TE, 42.5 ms; flip angle, 20°, and slice thickness, 1.0 mm; size of the region of interest (slab), 60–80 mm; and study duration, 4–6 min.
For a semiquantitative analysis of the signal nonuniformity in the structure of lesions, we introduced a uniformity coefficient (UC), which is characterized as the ratio of the MR signal intensity from the tumor (affected area) to the signal strength in the area of white matter on the contralateral side. UC for a homogeneous structure is close to unity. The relative value was calculated by dividing the uniformity coefficient in the tumor by its value on the contralateral side (rSWAN = SWANtumor/SWANc/s). Thus, the results showed that the largest differences in the relative signal intensity MRSrel. (rSWAN) (high UC values) are identified in the structure of metastatic tumors with no evidence of a hemorrhage—a homogeneous form and a variant with tortuous vessels with MRSrel. from 0.56 to 1.09 and with MRSrel. from 0.63 to 1.09, respectively. The lowest UC values were obtained in the structure of metastatic tumors with signs of a hemorrhage with rel. 0.69–0.76 UC for a structure with inhomogeneous magnetic properties of CBS which is much lower than 1.
UC can be calculated on a workstation using an image processing software, such as FUNCTOOL (Advantage Windows, GE). Regions of interest (ROI) are set in the most hypointense tumor areas in the boundary area and the contralateral side of the brain (Fig. 9.18). For a more precise determination of the boundaries of the solid tumor, the SWI (SWAN) sequence is also repeated after administration of the contrast agent.
Fig. 9.18
A cancer metastasis in the left hemisphere of the cerebellum. Regions of interest in “raw” SWI (SWAN) images (a) and the distribution map of relative signal intensity (b) for quantification. (1), the central area of necrosis; (2), accumulation area of the contrast agent; (3), edema area; (4), contralateral (symmetrical) side of the cerebellum
Based on all the findings (Dolgushin 2012), the structure of metastatic tumors in the SWI (SWAN) sequence before administration of contrast agent was homogeneously hyperintense (34%) or had signs of the presence of deformed vessels—“points” (50%). Hemorrhages (“lumps”) in the structure of metastatic tumors were detected rarely in 16% of cases. The next cases of observations show these results.
As noted earlier, brain metastases from the same primary source may have different shapes and visual appearances on CT and MR images. At the same time, despite the rapid, aggressive growth with severe dislocation of brain structures and perifocal edema, metastatic lesions may have a homogeneous structure. In such cases, hypointense inclusions are absent in T2 and SWI (SWAN) images; in other words, hemorrhages and deformed vascular microstructures remain undetected. After administration of a contrast agent in such cases, an increase in MR signal in the SWI (SWAN) sequence is most pronounced on the periphery and in the central parts of metastatic lesions, although, in T1-weighted images, accumulation of the contrast agent can be more intense in the peripheral parts of the lesion (Fig. 9.19).
Fig. 9.19
A breast cancer metastasis in the brain. On MRI, there is a lesion in the right parieto-occipital area, characterized by an isointense signal in T2-weighted image with a pronounced perifocal edema (a) and intense homogeneous accumulation of the contrast agent on T1-weighted WI with fat suppression (b). In the SWI (SWAN) sequence, hypointense inclusions are not detected (c), while the accumulation of the contrast agent (d) is most pronounced on the periphery and in the center of the lesion (arrows)
Figure 9.20 presents a case of a patient with glioblastoma characterized by an isointense signal in T2-weighted images and a pronounced perifocal edema (a). On MRI, there is a tumor with hypointense signal in T1-weighted images before contrast enhancement and intensive CA accumulation on the periphery (b, c) after its administration. On SWI (SWAN) MRI (d), a quite large hypointense fragment (bleeding station) is indicated by the arrow on the background of multiple point areas with low density (altered blood vessels), which is not visualized in T1- and T2-weighted images and does not accumulate a contrast agent.

Fig. 9.20
Glioblastoma of deep portions of the right frontal region. On T2-weighted MRI (a), there is a lesion surrounded by peritumoral edema; on T1-weighted MRI (b) and after intravenous contrast enhancement (c), there is an annular opacification. On SWI (SWAN) MRI (d), in infiltrative and necrotic parts of the tumor, multiple hypointense lesions are visualized—small hemorrhages in the form of lumps (the arrow), as well as deformed blood vessels in the form of small “points” throughout the lesion with a bright area on the periphery of the edema
Using the SWI (SWAN) sequence to verify vascular changes in the tumor structure provides additional visual information regarding the properties of the blood vessels in the tumor and allows to obtain semiquantitative (UC) and quantitative (magnetic susceptibility maps) estimates.
Thus, the results of the studies on the use of the SWI (SWAN) sequence in preoperative diagnosis show a great potential and high sensitivity in demonstrating abnormal capillary network and microhemorrhages in secondary malignant brain tumors. This opens up new possibilities for the study of angiogenesis of not only metastatic but primary tumors.
The SWI (SWAN) sequence has worked well in controlled studies after radiotherapy, since the occurrence of hemorrhages in the metastasis tissues after radiotherapy is naturally associated with damage to the vascular wall (Mitomo et al. 1986; Remler et al. 1986). The so-called radiation vasculitis develops, which is accompanied by an increase in the vascular permeability and vasogenic edema, proliferation of endothelial cells occurs, and then hyalinosis and fibrinoid necrosis of the arterioles develop. As a result of damage to vasa vasorum (microvessels supplying the vascular endothelium), telangiectasia may be formed, and hemorrhages from them may occur. In a morphological study, necrotic changes are detected in the area of radiation necrosis and microhemorrhages from telangiectatic blood vessels (Werner et al. 1988; Yamaguchi et al. 1991). The SWI (SWAN) sequence allows to detect these microscopic changes as hypointense areas with various shapes (Fig. 9.21). A comparative analysis of T2-weighted MRI in the control group of patients with metastases after radiotherapy did not allow to visualize any specific changes in the MR signal in the said sequences (4545), which would imply the presence of hemorrhagic inclusions, while SWI (SWAN) images clearly visualized small hypointense inclusions (microhemorrhages) in all cases.