, Valery Kornienko2 and Igor Pronin2
(1)
N.N. Blockhin Russian Cancer Research Center, Moscow, Russia
(2)
N.N. Burdenko National Scientific and Practical Center for Neurosurgery, Moscow, Russia
Various glial tumors, due to their predominant involvement of brain structures, are the main reason of difficulties in the differential diagnosis with intracranial metastases. According to Russell and Rubinstein (1989), gliomas account for 40–45% of all intracranial tumors, forming a heterogeneous group of brain tumors, which consists of both relatively benign forms and tumors with a severe degree of malignancy.
In the truncated version of WHO classification (2016), brain tumors are divided into:
Diffuse astrocytic and oligodendroglial tumors (diffuse astrocytoma (low grade), anaplastic (malignant) astrocytoma, glioblastoma (variant—gliosarcoma), oligodendroglioma, anaplastic oligodendroglioma, oligoastrocytoma)
Other astrocytic tumors : pilocytic astrocytoma (variant—pilomyxoid astrocytoma), pleomorphic xanthoastrocytoma, and subependymal giant cell astrocytoma
Ependymal tumors (ependymoma, anaplastic ependymoma, myxopapillary ependymoma, subependymoma)
Tumors of the choroid plexus
Neuronal and mixed neuronal-glial tumors
Tumors of the pineal region
Embryonic tumors
Meningiomas
Mesenchymal tumors
Melanotic tumors
Lymphomas
Histiocytosis
Germinomas
Tumors of the sellar region
Glial tumors, diverse by their histological structure, have different CT and MRI manifestations. Many of them have tissue characteristics similar to those of metastases.
Astrocytic tumors (ASTs) are divided into two large categories: these are prognostically unfavorable, diffusely growing (or diffuse) tumors accounting for up to 75% of all astrocytic tumors and localized tumors with a more favorable prognosis. The first category includes tumors with an increasing degree of anaplasia (from astrocytoma with a low degree of malignancy to glioblastoma), characterized by the absence of clear macro- and microscopic boundaries with the surrounding brain substance. Glioblastoma often mimics solitary metastatic lesions. The second category consists of pilocytic astrocytomas, pleomorphic xanthoastrocytomas, and subependymal giant cell astrocytomas that have macro- and microscopic isolation from the brain substance but develop much rarer and at a younger age. The peak incidence of supratentorial astrocytomas is between the ages of 20 and 50 years, which is generally 10 years younger than that for glioblastomas. These tumors can develop in any part of the brain, with relatively smaller involvement of the occipital lobes. When the tumor is located in the deep parts, there may be a bilateral invasion. The abnormal process affects both white and gray matter.
Low-grade astrocytomas (LGASC) are a group of diffuse tumors that constitute about 10–15% of all gliomas. LGASC affects mainly young adults (20–40 years of age). The life expectancy of patients with astrocytomas ranges from 2.5–15 years.
LGASCs by their radiological characteristics do overtly not qualify for the differential diagnosis with metastases, despite the fact that native CT and MRI scans can show characteristics similar to those in metastases in some cases. On CT, LGASCs are visualized as hypodense lesions without clear boundaries with the surrounding brain substance. There are also isodense forms of tumors, which in some cases may result in a delayed diagnosis, if they are investigated only using CT. Intravenous administration of a contrast medium in most cases does not change their CT density or exhibits individual portions of increased density on the background of a hypodense area.
It is believed that perifocal edema is not typical for this type of tumors. At the same time, CT or MRI does not allow to differentiate between the tumor and perifocal edema due to their similar densities and signal characteristics. The use of additional intravenous contrast enhancement facilitates identification of the tumor structure on the background of edema. It is well known that benign, diffusely growing hemispheric ASCs, for the most part, do not accumulate the contrast agent.
We must not forget that approximately 10–12% of cases may be characterized by cystic or atypical diffuse ASC forms (Fig. 28.1), with focal and even intense contrast enhancement, which may have signs similar to those in metastases (Fig. 28.2).
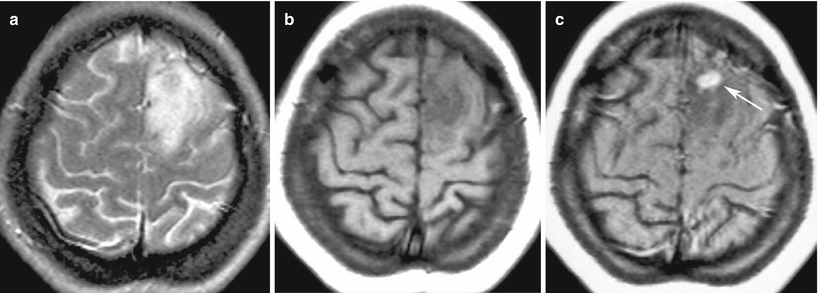
Fig. 28.1
Fibrillar astrocytoma . In the right frontal area on T1-weighted MRI (a), there is a solid-cystic space-occupying lesion that has characteristics close to those of the gray matter in the solid part and a reduced signal from the cystic component located in the posterior pole. The structure of the tumor and its borders are well differentiated after contrast enhancement (b)
Fig. 28.2
Low-grade astrocytoma. On T2-weighted (a) and T1-weighted MRI (b), in the left frontal region, there is an area with diffuse abnormal changes in the signal. Adjacent sulci are compressed. After intravenous contrast enhancement (c), in the depths of the portion, a focus is visualized with an intense abnormal accumulation of the contrast agent (the arrow)
It should be noted that infiltrative growth of ASCs results in the tumor spread beyond the signal change area visible on T2-weighted and T2-FLAIR images. On DWI MRI (with b = 1000), low-grade ASCs have the signal strength equal to or slightly lower than that of the normal white matter. The average ADC values for LGASCs, based on the results of our studies, are 1.52 ± 0.4 mm2/s. MR tractography provides additional information on the structure of the nerve fibers of the white matter in the area of ASC growth. The tumor causes destructive changes in the conductive tracts of the brain; however, in some cases, they can be traced in the tumor tissue. On perfusion MRI or CT studies, ASCs are characterized by similar parameters of local cerebral blood supply (CBV) and local cerebral blood flow (CBF) in comparison with the surrounding brain substance. The specificity of spectroscopic characteristics of LGASCs is low; however, a decrease in the NAA/Cr and Cho/Cr peak ratio is detected on MR spectrograms (Fig. 28.3). The absence of a lactate peak and low Cho peak values are indicative of the benign nature of the brain lesion with equal other CT and MRI manifestations of the tumor in relation to the assessment of the degree of malignancy.
Fig. 28.3
Multiple astrocytomas. Studies at several levels. On T2-weighted (a, b) and T2-FLAIR MRI (b, d), there are multiple foci with an increased subcortical MR signal. On DWI MRI (e), these lesions are virtually undetectable. On all scanning sequences, the lesions have identical characteristics. On MR spectroscopy, the NAA peak is decreased; the Lip-Lac complex peak is visualized
Gradual transformation of benign ASC into an anaplastic form, well known in the clinical practice, can be demonstrated by follow-up CT or MRI studies. Moreover, the presence or appearance in the LGASC structure of an area of the contrast agent accumulation may characterize tumor portions with more aggressive growth. Although rare, a combination of several CNS disorders is a possible event, particularly, if the fact of long-term multiyear growth of LGASC is considered.
In such cases, it is important not only to recognize the lesions but also to establish their different origins or, on the contrary, to identify allegedly common histogenesis of tumors, which is especially important in multiple primary ASCs (Fig. 28.4).
Fig. 28.4
Multiple astrocytomas of the left cerebral hemisphere. On T2-weighted (a) and T1-weighted MRI (b, c), two lesions are visualized, having an increased T2-weighted MR signal and a decreased T1-weighted MR signal. On DWI MRI (d), these lesions are iso-hypointense. Tumor lesions have similar MR characteristics on T1-weighted and T2-weighted MRI images, but they differ on DWI MRI
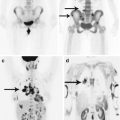
On PET studies, benign intracerebral tumors are characterized by low RP accumulation. On PET with 18F-FDG, tumor lesions may manifest as ametabolic areas, which is why the use of amino acids (11C-methionine, 18F-tyrosine) or 18F-choline with low background accumulation allows to determine neoplastic origin of the disease, as well as suggest the prognostic factors for tumor growth (Fig. 28.5).
Fig. 28.5
Diffuse glioma of the brainstem. On T1-weighted MRI with contrast enhancement (a) and T2-FLAIR MRI (b) in the sagittal projection, in the region of the medulla oblongata, there is an extensive, diffusely spreading lesion with no signs of abnormal CA accumulation. On PET with 18F-choline (c, d), there is low RP accumulation in the affected area (the arrow)
Anaplastic astrocytoma (AnASC) is an infiltrative tumor as a rule with well defined boundaries. In cystic degeneration, hemorrhages are often observed, but necrosis cannot be detected by a histological examination. AnASC amounts to up to one third of all astrocytomas and 25% of all gliomas. It develops in the majority of cases (75%) from LGASC. At a microscopic examination, AnASCs are characterized by aggregation of closely spaced astrocytes with polymorphism and nuclear hyperchromatism.
On CT, AnASCs are inhomogeneous tumors with mixed density. According to some researchers (Osborn 2004), AnASCs are characterized by inhomogeneous contrast enhancement on CT. The presence of annular contrast enhancement suggests the tumor transformation into glioblastoma. Around the tumor, there is usually an edema with varying severity, having a low density and typically growing into the white matter. Calcifications and hemorrhages are rare.
On MR images, AnASC often it looks like a poorly separated lesion with a heterogeneous signal on T1-weighted and T2-weighted MRI. On T1-weighted MRI, there are areas with a mixed iso- and hypointense signal; often hemorrhagic lesions with increased signal intensity can be detected. Most AnASCs are typically distinguished by the signal enhancement after administration of the contrast agent (Fig. 28.6).
Fig. 28.6
Anaplastic astrocytoma. In the right frontotemporal region on CT with (b) and without (a) contrast enhancement, there is a large lesion that includes a small solid nodule on its lateral contour and a large tumor cyst. The brain ventricles are compressed. On T2-weighted (c), T2-FLAIR (d), and T1-weighted MRI, on the background of contrast enhancement (e, f), there is a nonhomogeneous tumor with expressed contrast enhancement and a hemorrhagic/protein intracystic component characterized by a heterogeneous signal and forming a hypointense signal along the lower contour (d, the arrow)
On DWI MRI, there is an increase in the heterogeneity of the MR signal, appearance of high signal areas on DWI with factor of b = 1000 s/mm2 is normally not observed in LGASCs. In this case, ADC values vary in tumor tissues accumulating and not accumulating the contrast agent. Mean ADC values in the tumor tissue, based on the results of our studies, varied within the range of about 1.18–1.23 ± 0.32 mm2/s. With increasing anaplastic changes in the tumor, a decrease in the fractional anisotropy index is noted.
Infiltrative tumor growth results in a total destruction of the main structural elements of the white matter, in particular, conductive tracts. MR tractography becomes, under these conditions, one of the unique methods of in life and, most importantly, preoperative evaluation of the latter (Jellison et al. 2004). On MR spectroscopy, AnASCs are characterized by an increase in the Cho/Cr peak ratio and a decrease in the NAA peak height (Podoprigora et al. 2001a, b; Nelson et al. 2002). CT and MRI perfusion studies further contribute to the assessment of structural changes occurring in the tumor tissue in the course of anaplastic transformation. Anaplastic lesions are characterized by a typical inhomogeneous increase in hemodynamic parameters; this particularly concerns the local cerebral blood flow in the areas corresponding or not corresponding to the contrast agent accumulation. Anaplastic astrocytomas are characterized by high accumulation of radiopharmaceuticals, such as 11C-methionine and 18F- and 18F-choline-tyrosine (Fig. 28.7).
Fig. 28.7
Anaplastic astrocytoma . MRI in the right frontoparietal region visualizes a multicystic tumor with a hyperintense area of moderate perifocal edema on T2-weighted MRI (a). There is intense accumulation of the contrast agent on T1-weighted fat sat MRI with contrast enhancement (b, c), on the periphery and in the solid component of the lesion. On CT perfusion, CBV values (d) are high in the solid component of the tumor and low in cystic one. On PET CT with 18F-choline (e, f), there is its intense accumulation in the solid component of the lesion
Glioblastoma (GB) is the most malignant of all glial tumors and occupies the extreme part of the spectrum of astrocytomas. It is the most common primary CNS tumor, which amounts to about 10–20% of all intracranial tumors (Orrison and Hart 2000; Osborn 2004). Approximately half of all gliomas belong to GBs. This is the most common supratentorial tumor in adults and is usually diagnosed in patients over 50 years of age and is rare before 30 years of age. A slight predominance of the male population is noted. Glioblastomas in particular account for the major set of differential diagnostic radiological errors with metastatic tumors.
Macroscopically, GBs are usually lesions with a heterogeneous structure with central necrosis and a richly vascularized stroma. Intratumoral hemorrhages are often observed. Histologically, GBs have pronounced tumor cell atypia and high mitotic activity. A characteristic feature of GBs are multiple foci of necrosis with the presence of so-called pseudopalisade formations that are presented by a multinucleated palisade of elongated hyperchromatic nuclei and marked proliferation of vascular endothelial cells (Matsko 1998). Like in other infiltrative gliomas, there is no clear boundary between the tumor, edema, and normal brain tissue; however, due to pronounced contrast enhancement, the solid part of the tumor on CT and MRI images looks quite localized.
On CT, the tumor density is heterogeneous. The central low-density area is presented by necrosis, which is observed in 95% of cases. Calcifications in GBs are very rare. Various hemorrhages can be identified. The tumor is usually surrounded by a pronounced perifocal edema merging visually with the infiltrative part of the tumor. After intravenous administration of the contrast agent, expressed, but inhomogeneous, contrast enhancement is observed, often in the form of a ring with jagged internal contours.
MR manifestations of GBs, in general, reflect abnormal changes, showing significant tumor heterogeneity. On T1-weighted images, there is a poorly localized, space-occupying lesion with a mixed (iso-hypointense) signal and central necrosis that usually has a reduced signal relative to the tumor mass. On T2-weighted and T2-FLAIR MRI, tumor manifestations are also diverse, with areas of a hypo-, iso-, and hyperintense signal from the GB stroma, necrosis, cysts, and hemorrhages. An extensive mass effect and edema of the white matter often also accompany small-sized tumors, which occurs in metastases (Figs. 28.8 and 28.9).
Fig. 28.8
Glioblastoma. In the right temporal lobe on axial CTs before (a) and after contrast enhancement (b, c), there is a tumor intensely accumulating the contrast agent. In the center of the tumor, there is a small area of necrosis. A hypodense area around the tumor is presented by edema
Fig. 28.9
Glioblastoma. On CT before (a) and after (b, c) contrast enhancement in the left postfrontal area, parasagittally, there is a tumor with marked peripheral contrast enhancement and perifocal edema. The central area of necrosis does not accumulate the contrast agent. On T2-weighted (d) and T1-weighted MRI (e) and after (f) contrast enhancement, a tumor with a heterogeneous structure is identified. Perifocal edema has an equally high MR signal as compared to the area of central decay. On T1-weighted MRI (f), there is intense, marginal contrast enhancement typical for glioblastoma. The inner and outer contours of the contrast-enhanced tumor are irregular
As with AnASCs, tumor cells in GBs may be present outside the signal enhancement area and perifocal edema detected by MRI. GBs spread extensively and quickly along the tracts of the white matter, destroying the latter. In the structure of GBs, often hemorrhage with varying degrees of severity are visualized. In subacute hemorrhage, MR signal increases in T1-weighted images.
Most GBs significantly and heterogeneously accumulate the contrast agent on MRI; their borders cannot be differentiated on T1-weighted images in the absence of a pronounced hemorrhage in the glioblastoma stroma. The use of high doses of the contrast medium and delayed investigations increase the possibility of visualization of the infiltrative part of the tumor extensively invading the surrounding brain tissue (Fig. 28.10).