9 Ultrasound Assessment of Carotid Stenosis
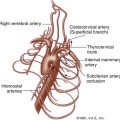
The identification of carotid stenosis is perhaps the most essential of all functions of the cerebrovascular ultrasound examination. While the majority of stenotic lesions occur in the proximal internal carotid artery (ICA), other sites in the carotid system may be involved and may or may not be the cause of significant neurologic events. Up to 30% of all major hemispheric events (stroke, transient ischemic attack [TIA], or amaurosis fugax) are thought to originate from disease at the carotid bifurcation.1 However, stenoses in other areas of the carotid arteries may be equally significant, including lesions in the distal ICA (an area not typically visible on routine carotid ultrasound), the common carotid artery (CCA), or on the right in the innominate artery (IA). Stenoses of the external carotid artery (ECA) are not typically of clinical import but should also be identified as they may account for the presence of a bruit on clinical examination and should be known to the surgeon at the time of carotid endarterectomy (CEA).
A number of large, well-controlled, multicenter trials both in North America and Europe have confirmed the effectiveness of CEA in preventing stroke in patients with stenoses at the ICA origin compared to optimized medical therapy. The North American Symptomatic Carotid Endarterectomy Trial (NASCET) has shown CEA resulted in an absolute reduction of 17% in stroke at 2 years when compared with medical therapy in symptomatic patients with 70% or greater stenosis.2 The NASCET also reported improvement in outcome with CEA in patients in the 50% to 69% lesion category, although the amount of improvement was far less than in those with higher-grade stenoses.3 The Asymptomatic Carotid Atherosclerosis Study (ACAS) also showed a reduction in stroke in asymptomatic patients with 60% or greater lesions, but, like the moderate range of stenoses in the NASCET, there was only a 5.8% reduction in stroke risk over 5 years.4 Other studies, both here and abroad, have confirmed the benefit of CEA and have validated the role of this procedure in reducing the risk for future stroke.5,6 However, with the advent of statin therapy, trials comparing CEA with medical management have been undertaken, and how this newer nonsurgical treatment will eventually affect management remains to be seen.
ICA Stenosis
With the development of duplex Doppler in the early 1980s, a number of investigators reported excellent results using sonography in diagnosing carotid stenoses,7–10 but ultrasound only gradually became the primary technique for carotid evaluation that it is today. While the role of ultrasound in the evaluation of carotid stenosis evolved and its technical attributes improved (increasing gray-scale resolution, addition of color Doppler in the late 1980s), contrast angiography remained the gold standard and was extensively employed in many institutions for decades. Most of the large studies describing the effectiveness of CEA, in fact, relied on angiography as the gold standard. Similarly, most studies in which the degree of carotid stenosis was characterized using ultrasound relied on carotid angiography as well. Before 1991, when the results of the NASCET trial were released, most angiographic studies characterized the severity of stenosis by measuring the size of the residual lumen and comparing it as a percentage to the size of the original vessel lumen. Although this is an appropriate method in most vessels, there are several unique features of the proximal ICA that render this measurement technique problematic in this vessel. To begin with, on all conventional angiographic studies, the original lumen is not actually seen. Although this is not a major problem in peripheral arteries when the original lumen is visible on both sides of a stenosis, lesions at the origin of the ICA typically do not have a “normal” lumen on both sides. The estimation of the original lumen is further complicated by the presence of a normal but highly variable region of dilatation, the carotid bulb. The difficulty in estimating the exact location of the original lumen of the proximal ICA, in fact, introduced a great degree of interobserver error in estimating the degree of ICA stenosis. To avoid interobserver error, the participants of the NASCET2 and ACAS4 studies published in 1991 and 1995, respectively, devised a different method: comparing the smallest residual luminal diameter to the luminal diameter of the “normal” ICA distal to the stenosis (Figure 9-1).
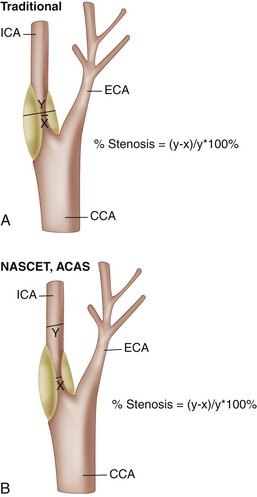
While the so-called NASCET method may not truly reflect the degree of luminal narrowing at the site of stenosis, this method has the advantage of minimizing interobserver error.11 One should be aware that the European Carotid Surgery Trial (ECST) study5 continued to rely on the conventional method of stenosis measurement, and, although both confirmed the effectiveness of CEA, their methods of measurement of ICA stenosis were quite different. In general, for a given diameter of a residual lumen, the calculation of percent stenosis tends to be significantly higher using the pre-NASCET measurement method in comparison to the NASCET method. The NASCET technique is currently the standard on which the large clinical North American studies were based and should be used to make clinical decisions about which patients undergo CEA. As such, Doppler thresholds taken from studies that did not use the NASCET method of measurement should not be used. Values from more recent evaluations12–23 are strongly advised unless your facility has its own internally validated thresholds.
Doppler Parameters
Innumerable Doppler parameters have been proposed to characterize ICA stenosis. These include both absolute angle-adjusted velocity measurements and various ratios. Currently, most laboratories rely on two or more of the three following measurements: peak systolic velocity (PSV), the ratio of peak systolic velocity in the ICA to that in the ipsilateral distal CCA (VICA/VCCA), and end-diastolic velocity (EDV). PSV is by far the most commonly used as it is easily obtained and highly reproducible. Statistically, however, all three perform about equally. In our own study, we found PSV and VICA/VCCA performed almost identically with regard to the identification of ICA stenoses greater than or equal to 70% when compared with angiography (Figure 9-2). EDV was slightly less accurate.13 Other authors have not found EDV to be any less accurate than the other two parameters.24 While statistics would suggest that one could choose any of these three parameters and produce equal results, when considering an individual patient, one must account for the fact that there is a great deal of variation of absolute velocity across any population. For that reason, the addition of ratio measurements to PSV may identify those who, for hemodynamic reasons (e.g., hypertension, low cardiac output, tandem lesions), fall outside the expected norm for either PSV or EDV. Low cardiac output, for example, may diminish a patient’s ability to generate expected velocities for a given degree of stenosis, and a ratio may actually be more reflective of the true degree of vessel narrowing. Conversely, velocities in the ICA contralateral to a high-grade stenosis or occlusion may be spuriously high if the vessel is the major supplier of collateral blood flow around the circle of Willis,25–27 and, again, the ratio value should be strongly considered in arriving at a diagnosis. An important technical point to be made when calculating the VICA/VCCA is that the denominator must be obtained from the distal CCA approximately 2 cm proximal to the bifurcation. While there is no reason for this other than convention, a study by Lee and colleagues28 showed that, in most patients, the systolic velocity decreases in the CCA as one goes from proximal to distal within the vessel. Therefore, if the CCA velocity for the ratio is obtained from the proximal portion of the artery, the ratio may be spuriously low, potentially causing an underestimation of the degree of stenosis based on this parameter.
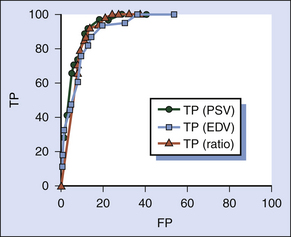
FIGURE 9-2 Receiver operating characteristic (ROC) curve for an ultrasound test to detect 70% or greater internal carotid artery (ICA) stenosis evaluating three Doppler ultrasound parameters: peak systolic velocity (PSV; green circles), end-diastolic velocity (EDV; blue squares), and the ratio of peak systolic velocity in the ICA to that in the ipsilateral distal common carotid artery (VICA/VCCA; red triangles). The vertical axis shows the number of true positives (TP). The horizontal axis shows the number of false positives (FP). This was based on a population of 266 carotid vessels from our institution. All three parameters perform well; PSV and VICA/VCCA are essentially identical. EDV performs slightly inferiorly.13
Hathout and associates29 recently proposed an interesting approach to ICA ratio measurements whereby the authors constructed a ratio of the highest PSV at the site of the stenosis and compared it to the distal normalized velocity in the same vessel. Because it mimics the method of measurement used in the NASCET trial, the authors called it the “sonographic NASCET index.” Given that the two velocity values are taken from the actual vessel involved by the stenosis, the authors postulated and indeed showed that this method produced superior results in characterizing the degree of ICA stenosis when compared to more commonly applied Doppler parameters. While the commonly used systolic velocity ratio (VICA/VCCA) performs well, the denominator is obtained from the CCA, which can potentially be affected by extraneous factors such as disease in the bulb and/or ECA.
PSV may also be falsely elevated in tortuous vessels. This is likely related to both a true increase in velocity as blood accelerates around a curve as well as difficulty in assigning a correct Doppler angle. Hence, if the ICA is extremely tortuous, one should use caution when making the diagnosis of an ICA stenosis on the basis of increased Doppler parameters alone without observing narrowing of the vessel lumen on gray-scale and/or color flow imaging and poststenotic turbulence on the spectral Doppler tracing. In general, one should always consider the gray-scale and color Doppler appearance of the vessel in question (so called plaque burden) and visual estimates of vessel narrowing to determine if all diagnostic features (both visual and velocity data) of a stenosis are in alignment. Simply using a “cookbook” style of application of Doppler velocity thresholds may lead to significant diagnostic errors.
Doppler Thresholds
Numerous thresholds were published before NASCET,7–10 and, as mentioned earlier, these older studies invariably used angiographic measurements that were not performed using the NASCET method as their gold standard and are, therefore, not directly applicable to the estimation of the degree of ICA stenosis in use today. A review of the post-NASCET literature on ICA stenosis,12–23 however, yields a remarkably wide range of recommended values to diagnose a given degree of ICA stenosis regardless of the parameters evaluated. All of these investigations have generated Doppler thresholds using angiographic measurements derived using the NASCET technique. The method of measurement of the gold standard is, therefore, not a factor in this variation. Many attribute the wide variation in published threshold values to what has been called “interlaboratory variation”—or inherent differences that are found when comparing one facility to another, such as different scan or measurement technique, interobserver variability of the Doppler examination,30 or even equipment.31 Certainly, it is well known that older Doppler units were prone to inconsistency, but that appears to have been largely overcome with improved technology. Other sources of variation in Doppler results may be related to patient population/referral patterns, disease prevalence, the mix of symptomatic versus asymptomatic patients, and the use of varied operative thresholds.
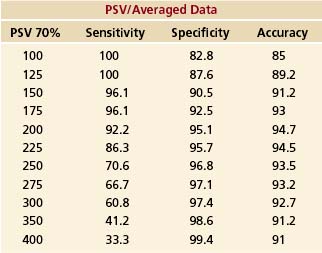
Review of several articles where receiver operating characteristic (ROC) data are available13,15 reveals that peak accuracy of Doppler for differentiating lesions above or below a certain degree of stenosis remains remarkably constant over a broad range of velocities and ratios and is, therefore, a relatively poor method of choosing a threshold. While this fact may at first appear counterintuitive, if Doppler can simply differentiate those patients with hemodynamically normal ICAs (Doppler values are not affected until the degree of stenosis reaches approximately 50%) from those with vessel narrowing, one automatically begins with an accuracy that is equivalent to the number of normal patients. Even in a laboratory with a large referral population, the majority of patients/vessels will not have significant stenoses. Choosing a threshold based on an acceptable level of sensitivity or specificity has the advantage over simple peak accuracy of being associated with a predictable clinical effect, in that it reflects the number of false positives or negatives produced by a given threshold. Unfortunately, reviewing the actual ROC data from a study done at our institution (Table 9-1), one can see that there is no obvious cut-off value; sensitivity simply decreases gradually as the threshold value is raised (more patients with operative lesions are missed), while specificity gradually increases (fewer patients are sent to surgery or correlative imaging unnecessarily). In situations in which there is a large benefit (e.g., stroke risk reduction) from CEA (≥70% stenosis in symptomatic patients), one would logically choose high sensitivity (a lower threshold velocity). Conversely, in patients with low benefit from CEA (50%–69% stenosis in symptomatic patients or ≥60% stenosis in asymptomatic patients), specificity should be favored over sensitivity. The decision by an author to favor sensitivity versus specificity has undoubtedly been the major factor in variation of recommended Doppler values in the literature.
TABLE 9-1 Receiver Operating Characteristic Data from 202 Patients Showing Changes in Peak Systolic Velocity (PSV) Sensitivity, Specificity, and Accuracy for the Diagnosis of Angiographically Proven Stenoses of 70% or Greater. As Threshold Levels are Raised, Sensitivity Gradually Decreases While Specificity Increases. There is No Obvious “Cut Point” to Indicate an Ideal Threshold. Of Note, Accuracy Remains Relatively Flat Over the Entire Spectrum of Possible Threshold Values, Indicating that Alone, It is a Poor Choice for Selection of a Threshold.13
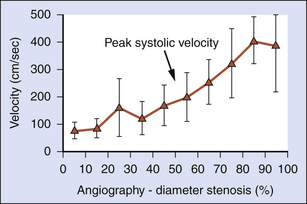
Most ultrasound facilities approach the ultrasound diagnosis of ICA stenosis by stratifying the degree of vessel narrowing into relatively broad categories rather than attempting to predict the exact degree of stenosis. Several studies have shown that, indeed, the average PSV and VICA/VCCA ratio rise in direct proportion to the severity of stenosis as determined by angiography.3,32 However, the standard deviations around each of these average velocity values are quite large, suggesting that Doppler cannot predict the exact degree of vessel narrowing. This makes the use of diagnostic strata necessary (Figure 9-3). We feel strongly that the diagnostic strata proposed by the Consensus Conference of the Society of Radiologists in Ultrasound (SRU) (0%–49%, 50%–69%, and ≥70%–95%) represent practical values that are clinically relevant and in keeping with the thresholds used in the NASCET trial.2,34
Related posts:
Stay updated, free articles. Join our Telegram channel

Full access? Get Clinical Tree


