30 Ultrasound Assessment of the Hepatic Vasculature
Because chronic liver disease is the tenth most common cause of death in the United States, evaluation of the liver and its vasculature is a very common indication for abdominal Doppler assessment.1,2 The liver vessels are effectively imaged with ultrasound in a high percentage of patients. Therefore, Doppler sonography is frequently the first modality used to evaluate patients with suspected hepatic vascular disorders. This chapter reviews the normal hemodynamics of the liver and the sonographic assessment of portal hypertension, portal vein obstruction, hepatic vein obstruction, and intrahepatic portosystemic shunts.
Technique and Normal Hemodynamics
Hepatic Veins
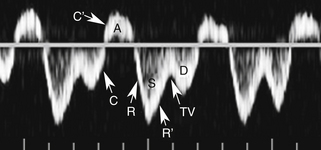
With that in mind, it is easiest to understand the morphology of the hepatic vein waveform by relating it to activity in the right atrium. When the right atrium contracts, forward flow from the hepatic veins into the IVC and right atrium slows and eventually reverses. The reversal of flow produces a short period of flow above the baseline. As the right atrium relaxes, there is relatively rapidly accelerating flow from the liver into the atrium. This is reflected in the waveform as a rapid downslope below the baseline. With progressive atrial filling, the velocity of flow from the hepatic veins into the atrium starts to slow and the Doppler signal starts to approach the baseline. This deceleration of hepatic vein outflow continues until the tricuspid valve opens. At this point there is a short period of passive atrial emptying into the ventricle, which produces a second phase of accelerating hepatic vein flow into the atrium and another downslope below the baseline. The right atrium then starts to contract, and the hepatic vein flow toward the atrium slows and eventually reverses (Figure 30-1).3
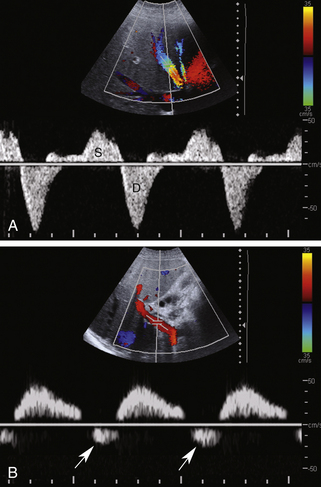
Predictably, right heart failure and alterations in right atrial filling and emptying cause changes in the hepatic vein waveform.4 In patients with right heart dysfunction, hepatic vein pulsatility increases and the retrograde pulses are exaggerated. With tricuspid regurgitation, right ventricular contraction during systole produces retrograde flow from the ventricle into the right atrium, and from the atrium into the hepatic veins. This causes an inverted systolic peak in the hepatic vein waveform (Figure 30-2).
Portal Vein
The normal portal vein demonstrates continuous antegrade flow and provides approximately 75% of blood supply to the liver.5 Although minor degrees of respiratory phasicity are reported, these are difficult to appreciate with Doppler techniques since sampling is performed during suspended respiration.
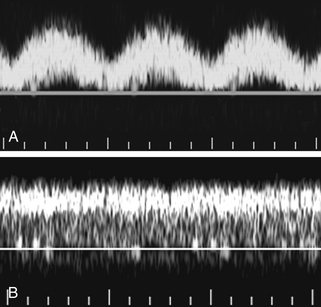
Because the hepatic sinusoids separate the portal veins from the heart, the degree of portal vein pulsatility related to cardiac activity is considerably less than for the hepatic veins. However, some degree of portal vein pulsatility is normal and is well displayed on portal vein waveforms (Figure 30-3). Pulsatility can be quantified by using an index called the venous pulsatility index (VPI). The VPI is analogous to the arterial resistivity index and is calculated as the difference between the maximum velocity and the minimum divided by the maximum velocity. A very pulsatile waveform where the minimum velocity reached the baseline (i.e., 0 cm/sec) would have a VPI of 1. A completely nonpulsatile portal vein waveform would have a VPI of 0. Gallix and associates6 showed that the mean VPI for the portal vein was 0.48 (± 0.31) in a group of normal individuals. A VPI of 0.48 means the minimum velocity is approximately half the maximum velocity.
Another way to quantify portal flow pulsatility is a simple ratio between the minimum and peak flow.7 Using this approach, a flat waveform would have a portal vein pulsatility (PVP) of 1 and a very pulsatile waveform where the minimum velocity dropped to the baseline would have a PVP of 0. Wachsberg and colleagues7 showed that 64% of normal patients had a PVP less than 0.54. That means that in a majority of patients the minimum velocity was less than half the peak velocity. Increased pulsatility in the portal vein is more prominent in thin individuals. As with the hepatic vein pulsatility, portal flow pulsatility can be blunted by a deep inspiration.
Right heart failure and tricuspid regurgitation may produce exaggerated portal vein pulsatility.8 Given the degree of pulsatility that can be seen in normal patients, however, cardiac dysfunction should probably not be considered unless the portal pulsatility is so great that the minimum velocity reaches 0 or reverses (i.e., the VPI is at least 1; see Figure 30-2, B.).9 It is also important to correlate the portal vein waveform with other sonographic signs of heart dysfunction, including enlargement of the hepatic veins and IVC and alterations in the hepatic vein waveform.
There is considerable variation in the reported value for normal portal vein velocity. This variation is at least partially dependent on whether the maximum velocity or the time average mean velocity is being reported. Patriquin and co-workers10 found that the maximum portal vein velocity ranged from 8 to 18 cm/sec in normal fasting adults and increased from 50% to 100% after eating. Haag and associates11 found that the normal maximum portal vein velocity was 26.5 ± 5.5 cm/sec. Abu-Yousef and colleagues9 and Kok and co-workers12 found the maximum portal vein velocity to range from 16 to 31 cm/sec (mean 22 cm/sec) and from 11 to 39 cm/sec (mean 23 cm/sec), respectively. Zironi and associates13 found that the normal mean portal velocity was 19.6 ± 2.6 cm/sec. Cioni and colleagues14 found that the maximum velocity was 26.7 ± 3.2 cm/sec and the mean velocity was 22.9 ± 2.8 cm/sec. They considered the normal range for maximum portal vein velocity to be from 20 to 33 cm/sec. This variation in the reported range of normal makes it difficult to rely on portal velocities as a sign of portal hypertension. Very low velocities are a good indicator of portal hypertension, however; velocities in the normal range do not exclude the diagnosis.
One variation of portal vein flow is helical flow near the bifurcation. This can produce areas of localized flow reversal or apparent flow reversal and give the mistaken impression of portal vein flow reversal despite overall antegrade portal vein flow. Rosenthal and associates showed that this can be seen in 20% of patients with severe chronic liver disease. However, helical flow is also seen in approximately 2% of normal patients.15 It is also seen following transjugular intrahepatic portosystemic shunts (TIPS), in patients following liver transplant, and in the setting of portal vein stenosis.
Hepatic Artery
The hepatic artery waveform has a low resistance profile with broad systolic peaks, gradual deceleration from systole to diastole, and well-maintained diastolic flow throughout the cardiac cycle. This is similar to that of other solid parenchymal abdominal organs. The normal hepatic artery resistivity index ranges from 0.5 to 0.7. Evaluation of the hepatic artery is very important in liver transplant patients and will be considered in Chapter 34.
Portal Hypertension
As mentioned earlier, chronic liver disease is the tenth most common cause of death in the United States, and alcoholism is the most common reason that Americans die of cirrhosis. Cirrhosis is the most common cause of portal hypertension with 60% of patients with cirrhosis having clinically significant portal hypertension.1
The precise pathophysiology of cirrhosis is unknown, but hepatic inflammation with regeneration is central to the process. Patients may be completely asymptomatic or experience complete hepatic decompensation. Mortality is largely related to complications of portal hypertension such as ascites (50%), variceal bleeding (25%), renal failure (10%), bacterial peritonitis (5%), and complications of ascites therapy (10%).2
Portal hypertension is defined as an increase in the gradient between the portal vein and IVC or hepatic veins of 10 to 12 mm Hg or greater. The easiest way to classify portal hypertension is to divide it into intrahepatic, extrahepatic, and hyperdynamic. Extrahepatic portal hypertension is subdivided into prehepatic (portal vein thrombosis [PVT], compression, and stenosis) and posthepatic (hepatic vein or IVC thrombosis, compression, or stenosis). Hyperdynamic refers to arteriovenous malformations or conditions that cause arterial portal fistulas. Extrahepatic and hyperdynamic portal hypertension are much less common than the intrahepatic category.
Ultimately, the resistance to flow through the sinusoids starts to affect arterial inflow so that arterial flow is shunted away from the sinusoids and into the portal vein system. This shunting occurs at a microscopic level in the sinusoids, peribiliary plexus, and the vasa vasorum of the portal vein. Initially, this produces portal vein flow reversal in isolated peripheral intrahepatic portal vein branches. As more and more peripheral branches reverse, flow in the major branches and the main portal vein also eventually reverse.16
Venous Diameter
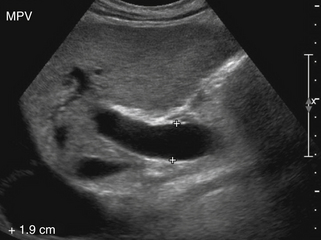
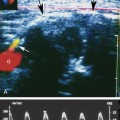
There are a number of gray-scale signs of portal hypertension. Engorgement of the portal vein and its tributaries is an indicator of elevated pressures (Figure 30-4). Goyal and colleagues17 prospectively compared portal vein diameter in 100 healthy subjects and 50 patients with portal hypertension. Keeping physiologic variables known to affect portal vein flow (such as fasting state, supine position, and deep inspiration) similar in both groups, they found that the upper limit of normal for portal vein diameter was 16 mm. Using this cutoff value, they achieved an overall sensitivity of 72%, accuracy of 91%, and specificity of 100% in diagnosing patients with suspected portal hypertension. Others, however, have proposed 13 mm as the cutoff for upper limits of normal portal vein diameter.18 The uncertainty about the normal value of portal vein diameter is one of the reasons that this parameter is not relied on to diagnose portal hypertension. While it is true that an unusually large portal vein is a reliable sign of portal hypertension, it is also unfortunately true that a normal-sized portal vein in no way excludes the diagnosis.
If one assumes that elevated portal pressure maximizes venous distention, it follows that little or no additional distention will occur when the portal vein outflow is indirectly restricted by sustained inspiration. Lack of caliber variation of the splenic and mesenteric vein during respiration is thus another parameter that has been investigated. In one study, this approach had a sensitivity of 80% and specificity of 100% in diagnosing portal hypertension.19 As with portal vein diameter measurements, this method has not gained widespread utility, likely due to a combination of interobserver variability and difficulties in measurement accuracy.
Portal Vein Flow Velocity
Simple measurements of portal vein velocity are one of many Doppler techniques used to evaluate patients with suspected portal hypertension. A sensitivity of 88% and a specificity of 96% were achieved by Zironi and co-workers13 using a mean portal vein velocity cutoff below 15 cm/sec. Haag and associates used a maximum portal vein velocity of 21 cm/sec as their cutoff for diagnosis of portal hypertension. Along with a portal vein diameter cutoff of 12.5 mm, they reported a sensitivity and specificity of 80%.11 The differences in these two studies illustrate that the expected portal velocity values in normal subjects and cirrhotic patients vary considerably. Although portal velocities tend to decrease as portal pressures increase, the correlation is weak and is not statistically significant.11,20 Sources of variability include interobserver variability, intermachine variability, presence of variable collateral pathways (especially recanalized umbilical veins), and variations caused by differences in patient positioning, different phases of respiration, different states of fasting, different exercise status, and different cardiac output.
Knowing that portal vein cross-sectional area typically increases and portal velocity typically decreases in the setting of portal hypertension has led some investigators to study the ratio of these parameters, assuming that it will increase dramatically with portal hypertension. The ratio of portal vein cross-sectional area and portal velocity is known as the congestion index. Moriyasu and colleagues21 showed that the congestion index was 2.5 times higher in patients with cirrhosis and portal hypertension than in normal subjects. Sensitivities ranging from 67% to 95% have been achieved using congestion index measurements.11,21 Unfortunately, the interobserver variability in area and velocity measurements is relatively high, and this variability is compounded when the parameters are combined in a ratio. Therefore, despite the theoretical value in this approach, optimistic results obtained in highly dedicated institutions may be difficult to reproduce in other centers.
Hepatic Artery and Hepatic Vein Flow
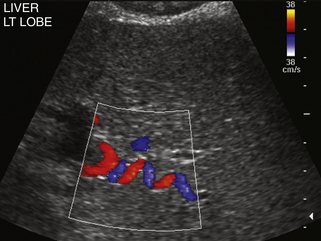
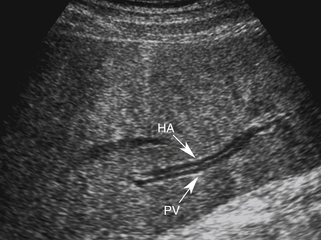
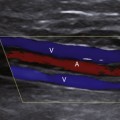
When portal hypertension is caused by cirrhosis, hepatic artery flow may increase substantially as compensation for diminished portal vein flow. Ultimately, the bulk of liver blood flow is provided by the hepatic artery, which may become subjectively enlarged and tortuous on color flow examination (Figure 30-5) and show substantially increased blood flow on Doppler interrogation. Enlarged intrahepatic arteries can in fact simulate dilated bile ducts and produce a parallel channel sign (Figure 30-6). Unfortunately, the hepatic artery does not have the capacity to make up for the loss of portal vein flow, and persistent hepatic ischemia is a significant cause of ongoing hepatocyte damage and progression of fibrotic scarring.
Normal hepatic vein pulsatility is either blunted or completely eliminated in patients with cirrhosis. In fact, a higher Child-Pugh score and decreased survival rate have been shown to correlate with complete loss of hepatic vein pulsatility.22 Although the mechanism for this loss of hepatic vein pulsatility is unclear, impression on the hepatic veins by regenerating nodules with resulting stenosis is a likely contributing factor.23
Portosystemic Collaterals
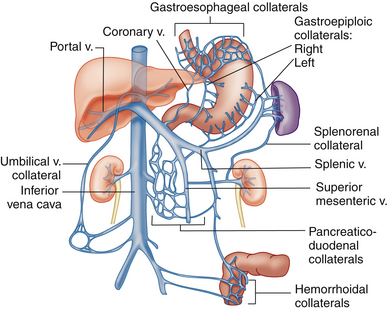
Although measurement of vessel diameters and velocities and calculation of various indices are helpful in some patients and used extensively in some institutions, the most widely used and reliable approach for the diagnosis of portal hypertension is the evaluation of portal systemic collaterals. Portal systemic collaterals can be divided into tributary and developed collaterals. Tributary collaterals are preexisting vessels that normally drain into the portal, splenic, and mesenteric venous systems. Blood flow in all tributaries should be directed toward the mesenteric, splenic, and portal veins.
The coronary vein, also known as the left gastric vein, is the most prevalent portal systemic collateral. It is identified angiographically in 80% to 90% of patients with portal hypertension.24,25 Because its presence implies an increased risk for variceal hemorrhage, it is the most clinically important of the portal systemic collaterals. The coronary vein runs parallel to the left gastric artery between the two layers of the lesser omentum. It arises along the gastric pylorus and lesser curvature of the stomach and proceeds toward the esophageal hiatus, where it forms a U-shaped loop that returns inferiorly to drain into the portal system near the portal splenic confluence (Figure 30-7).
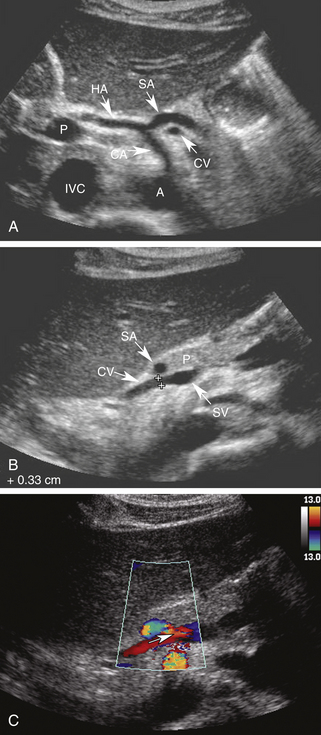
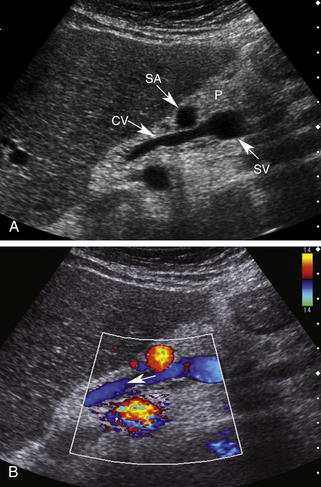
Using the left lobe of the liver as an acoustic window, the coronary vein can be identified sonographically as a vessel communicating with the superior aspect of the portal or splenic vein in the region of the confluence. It is located directly anterior to the bifurcation of the celiac axis or posterior to the common hepatic artery or the splenic artery (Figure 30-8, A and B). It is oriented in a slightly oblique plane, traveling superiorly and to the left of the portosplenic confluence and toward the gastroesophageal junction. Normal coronary vein blood flow, like all portal tributaries, should be directed toward the portal vein (Figure 30-8, C).
The normal coronary vein diameter should not exceed 5 to 6 mm.10, 26–30 In approximately 25% of patients with portal hypertension, the coronary vein will become dilated. Unfortunately, variceal hemorrhage often occurs without coronary vein enlargement.30 Demonstration of reversed flow in the coronary vein is a much earlier sign of portal hypertension than coronary vein enlargement. Wachsberg and co-workers30 showed that Doppler demonstration of hepatofugal flow in the coronary vein occurs in 78% of patients with portal hypertension (Figure 30-9). Evaluation of the coronary vein is very important in patients with suspected portal hypertension since it may be the only portal systemic collateral visualized in up to 75% of patients. Preservation of hepatopetal coronary vein flow in patients with portal hypertension also has prognostic implications since it is associated with a low risk for variceal hemorrhage.
Related posts:
 Normal Cerebrovascular Anatomy and Collateral Pathways
 Controversies in Venous Ultrasound
 Nonimaging Physiologic Tests for Assessment of Lower Extremity Arterial Disease
 Ultrasound Assessment of the Abdominal Aorta
 Extremity Venous Anatomy and Technique for Ultrasound Examination
Stay updated, free articles. Join our Telegram channel

Full access? Get Clinical Tree


