CHAPTER 90 Ultrasound Evaluation of the Carotid Arteries
Stroke remains the third leading cause of death and is a major cause of morbidity in the United States.1 Most strokes are due to thromboembolic events rather than to ischemia or reduced perfusion. Whereas the heart is the number one source, 20% to 30% of strokes are believed to be secondary to embolus from plaque or thrombus at the carotid bifurcation.2 Carotid endarterectomy has been convincingly shown in several prospective multicentered, randomized, double-blind trials to significantly reduce the risk of stroke and death in patients with stenoses of the internal carotid artery (ICA) of more than 60% to 70% compared with optimized medical therapy.3–6 However, at the time these trials were published in the 1990s, statin therapy was not a part of the standard medical regimen, and double-blind trials comparing carotid endarterectomy with medical management including statin therapy are currently ongoing.
Thus, the identification of patients with ICA stenoses of 60% to 70% is clearly important for patient management, allowing appropriate referral for carotid endarterectomy. Risk factors for disease at the carotid bifurcation include atherosclerosis, hypertension, diabetes mellitus, hyperlipidemia, hypercholesterolemia, obesity, and smoking. Patients with risk factors for carotid plaque, carotid bruits, and symptoms of stroke or transient ischemic attacks are typically referred for evaluation of the carotid arteries, which can be performed with ultrasonography, computed tomographic angiography, magnetic resonance angiography, or conventional angiography. Of these potential screening modalities, carotid ultrasound examination is the most readily available, least invasive, and least expensive. Numerous studies have shown that when it is performed appropriately, ultrasound examination of the carotid arteries is highly accurate for detection of surgical lesions (i.e., ICA stenoses ≥70%),7–10 and additional confirmatory studies such as CT angiography, magnetic resonance angiography, and conventional angiography are usually unnecessary except in complex cases with discordant findings or poor visualization. The precise method of grading stenoses of the ICA changed with the publication of the North American Symptomatic Carotid Endarterectomy Trial (NASCET).3 Before the NASCET, the percentage stenosis of the ICA was typically calculated by comparing the width of the residual lumen with the estimated diameter (outer wall to outer wall) of the ICA at the site of the stenosis (Fig. 90-1A). However, because the outer wall of the ICA can be seen on an angiogram only if it is calcified, angiographic measurements of ICA diameter are only estimates in many cases. Hence, this method has significant interobserver and intraobserver variability as well as poor reproducibility. Thus, when the NASCET was designed, the measurement of percentage ICA stenosis was standardized angiographically by comparing the width of the residual lumen at its narrowest point with the diameter of the lumen of the distal normal ICA (beyond any post-stenotic dilation; Fig. 90-1B) because the vessel lumen can be accurately and reproducibly measured on angiographic images. For a given residual lumen, the percentage stenosis is generally higher with the pre-NASCET method of calculating an ICA stenosis.
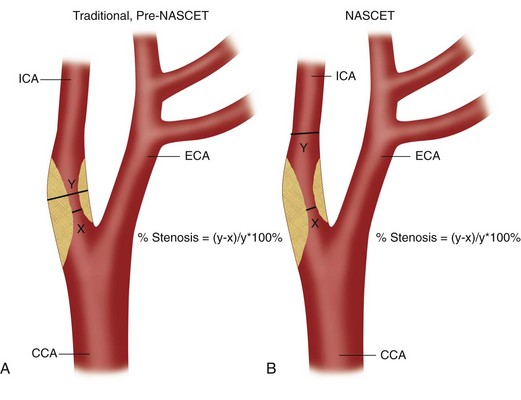
 FIGURE 90-1
TECHNICAL REQUIREMENTS
Technique
Technique Description
The examination begins with evaluation of plaque burden. Plaque echotexture should be characterized as hypoechoic, heterogeneous, or echogenic (Fig. 90-2). The surface contour of the plaque should be described as smooth or irregular (Fig. 90-3), and the percentage reduction of the arterial diameter by the plaque should be estimated.
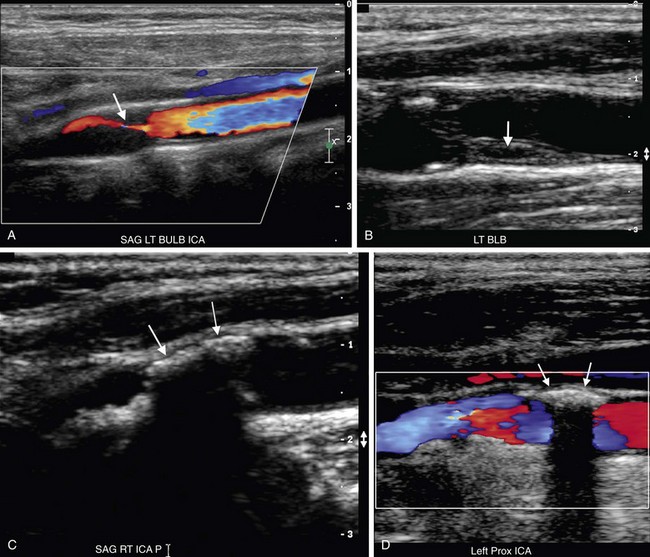
 FIGURE 90-2
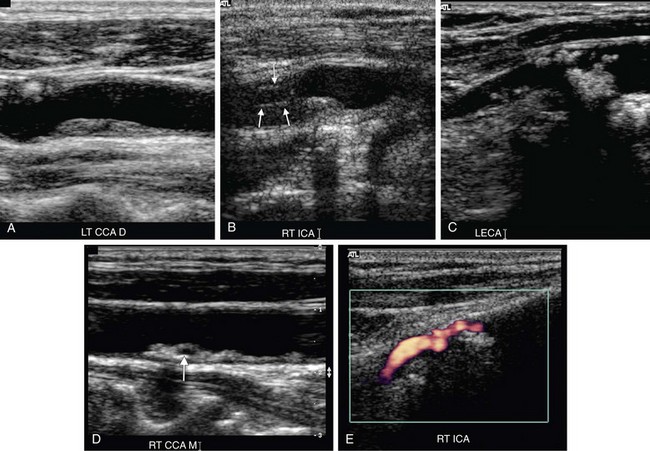
 FIGURE 90-3
Optimal evaluation of plaque requires both gray-scale and color or power Doppler imaging in the longitudinal and transverse planes of the entire CCA and ICA as well as the origin of the external carotid artery (ECA). The focal zone should be set at the level of the far wall of the vessel. The use of spatial compounding and harmonic imaging will also improve gray-scale resolution. The gray-scale gain should be adjusted such that plaque and the vessel wall are easily depicted but artifactual echoes are not present within the vessel lumen. If the gain is set too low, plaque will look artifactually hypoechoic. The color gain should be optimized by slowly increasing the gain until color speckles are noted in the surrounding soft tissues. The gain is then decreased until the color pixels are visible only within the vessel lumen. If the gain is set too high, the color pixels will overwrite or “bleed” over plaque, obscuring visualization of the true extent of plaque burden, particularly during systole, and stenoses may be overlooked (Fig. 90-4). If the gain is too low, sensitivity to blood flow will be decreased, and false-positive diagnoses of occlusion or stenosis will be made. The color velocity scale should be adjusted such that color fills the lumen reaching to the vessel wall. Therefore, the color velocity scale may have to be changed slightly as one interrogates the different vessels in the neck. If the scale is set too low, aliasing will occur, making it more difficult to detect flow disturbances at the site of a stenosis. In addition, color motion artifact, which may obscure visualization of the vessel, is more prominent when the velocity scale or pulse repetition frequency is set too low. The wall filter should be set as low as possible without degradation of the image by motion artifact. Angling of the color box will facilitate evaluation of the direction of blood flow, and a straight, small color box will increase sensitivity to flow. If the vessel lumen cannot be visualized because of shadowing from plaque, an approach to the vessel from different angles (including the transverse plane) or use of a curved array transducer may be helpful.
 FIGURE 90-4
Spectral Doppler tracings are obtained from longitudinal images with the sample volume placed centrally within the vessel lumen or at the brightest spot in any area of focal color aliasing. To optimize the spectral Doppler tracing, the velocity scale and baseline should be adjusted such that the tracing fills the velocity spectrum or scale. If the scale is too high, the waveform will be too small to easily measure or analyze. However, if the scale is too low, the tracing will be too large, and wraparound or aliasing of the systolic velocity peak will occur, making it impossible to accurately measure PSV. The angle of spectral Doppler insonation should be kept between 45 and 60 degrees to minimize error in the calculation of velocity from the Doppler frequency shift. If at all possible, the angle should be kept constant on follow-up studies. The angle cursor should be placed parallel to the direction of blood flow in the color jet or vessel lumen rather than parallel to the vessel wall. The direction of blood flow will, in fact, parallel to the vessel wall in most cases, but the jet of blood may travel tangentially or obliquely in relationship to the vessel wall if plaque is irregular or asymmetric (Fig. 90-5). In such cases, the angle correction cursor should be placed parallel to the jet of blood as seen on color Doppler imaging. The sample gate should be kept small, between 1.5 and 2.5 mm in width, and placed in the center of the vessel because PSV will be lower near the vessel wall owing to the geometry of laminar flow and drag from the vessel wall. If the sample gate is too wide, a wider range of velocities will be depicted, and there is the potential risk of falsely creating the appearance of spectral broadening and turbulent flow. Finally, the spectral Doppler gain should be optimized; the gain should be increased until background speckles appear on the spectral tracing and then readjusted downward until the background is homogeneously black. Although incorrect spectral Doppler gain settings rarely cause shifts in PSV of more than 20 cm/sec, such variation in the distal CCA can be important when the PSV in the distal CCA is used as the denominator in calculation of the peak systolic velocity ratio (PSVR). Apparent spectral broadening with “fill in” of the spectral envelope can also be spuriously created if the spectral Doppler gain is set too high.
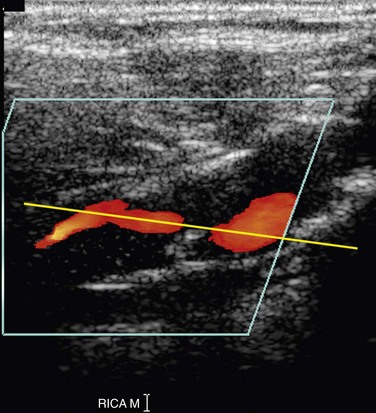
 FIGURE 90-5
Protocol
Normal Findings
The CCA, ICA, and ECA demonstrate distinct characteristic waveform patterns. Whereas all segments of the extracranial carotid arteries normally demonstrate a sharp systolic upstroke and thin spectral envelope, the amount of diastolic flow varies in each vessel, reflecting the oxygen consumption and peripheral vascular resistance of the vascular bed supplied. The ECA, which supplies the muscular bed of the scalp, typically demonstrates completely absent or very low velocity end-diastolic flow. Although the amount of diastolic flow in the ECA may vary from patient to patient, it should be symmetric right to left and less than the diastolic flow in the ICA or CCA (Fig. 90-6). An early diastolic notch followed by a short reversal of flow in early diastole is often seen in the ECA. The ICA, which supplies blood to the brain (high oxygen consumption), has a low-resistance waveform pattern with continuous forward, relatively high velocity diastolic flow (Fig. 90-7). The waveform of the CCA demonstrates an intermediate amount of diastolic flow and often demonstrates a brief reversal of flow in early diastole (Fig. 90-8). The vertebral artery has a waveform pattern similar to that of the ICA, characterized by a sharp systolic upstroke and continuous forward diastolic flow (Fig. 90-9).
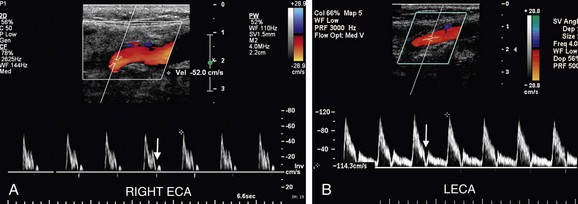
 FIGURE 90-6
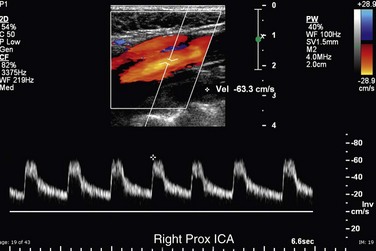
 FIGURE 90-7
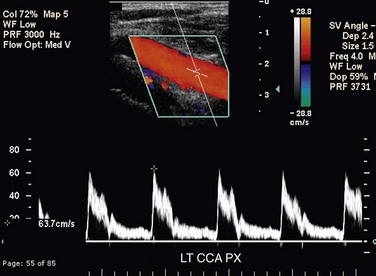
 FIGURE 90-8
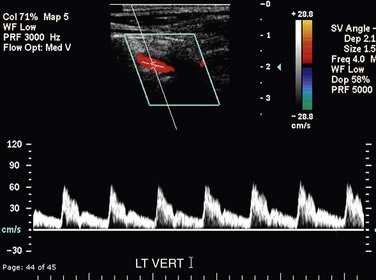
 FIGURE 90-9
Differentiation of the ICA from the ECA is critically important to avoid misinterpretation of a stenosis in the ECA as a more clinically significant ICA stenosis. The best method of identifying the ECA is by visualization of branches arising from the vessel (Fig. 90-10A). The ICA virtually never gives rise to branch vessels in the neck. Temporal tapping over the ophthalmic artery will generate sharp, spike-like deflections in the waveform of the ECA during diastole (Fig. 90-10B). However, on occasion, transmitted pulsations to the ICA will be observed after temporal tapping, although the deflections are typically blunted in comparison to the deflections observed in the ECA.7,8 In general, the ECA is smaller, is more medial, and has a higher resistance waveform pattern than the larger posterolateral ICA. However, location and vessel size are not reliable criteria for differentiation of the ICA from the ECA in all patients.

 FIGURE 90-10
Grading Stenoses in the Internal Carotid Artery
Grading of stenosis in the ICA by Doppler velocity criteria is based on the simple precept that flow volume is equal to vessel area multiplied by PSV. Because flow volume is a relative constant, PSV is inversely related to vessel lumen diameter. Therefore, if the vessel diameter decreases, PSV must increase to maintain flow volume. As demonstrated by the Spencer diagram, once the vessel diameter decreases by more than 50%, PSV at the site of the stenosis rises exponentially, and this compensatory increase in PSV maintains flow volume until the stenosis reaches approximately 70%.9 When a stenosis exceeds 70%, flow volume will begin to drop despite continued exponential increase in PSV. Once a stenosis in the ICA becomes greater than approximately 96%, the gradient across the stenosis becomes too high for the pressure generated by the combination of myocardial contractility and vessel elasticity to force blood through the residual lumen, and PSV begins to drop until the vessel occludes and velocity is zero.9
Numerous studies have attempted to correlate Doppler measurements of PSV, PSVR, and EDV criteria with angiographically calculated percentage stenosis. Widely variable results have been reported.10–14 In general, velocity criteria have a higher accuracy and positive predictive value for high-grade stenoses (>70%) and are less reliable for accurate grading of more moderate stenoses (<50%).12,14 Criteria are probably both machine (possibly even transducer) and laboratory specific and therefore should be validated for each laboratory and machine upgrade if possible. Studies have also demonstrated that vascular laboratories cannot reliably differentiate stenoses in the ICA by 10% increments.12,14 Accuracy is best achieved by focusing on whether a stenosis is greater than or less than a specific percentage stenosis. In most institutions, carotid endarterectomy is recommended in patients with ICA stenosis of more than 70%. Hence, most vascular laboratories categorize ICA stenoses as less than 50%, 50% to 69%, 70% to 96%, and more than 96%.
A meta-analysis published by Grant and colleagues12 found that accuracy varied little over a wide range of threshold values for PSV and PSVR, although the sensitivity and specificity were inversely proportional. Hence, the authors recommend that if the Doppler examination is to be used as a screening test, lower thresholds with higher sensitivity should be used. However, if the Doppler examination is intended as a diagnostic test without anticipating confirmation by some angiographic imaging modality, then specificity should be emphasized and higher thresholds are recommended.12
In 2002, the Society of Radiologists in Ultrasound (SRU) convened a multidisciplinary panel of experts, including both radiologists and vascular surgeons, to develop a consensus for grading of ICA stenoses by Doppler ultrasonography. The published recommendations of this consensus conference are as follows13:
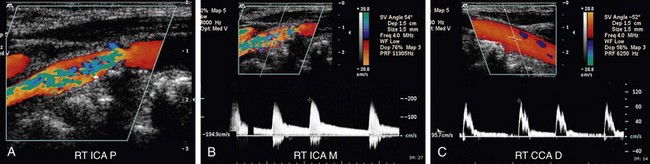
 FIGURE 90-11
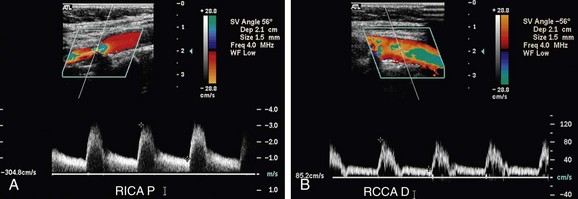
 FIGURE 90-12
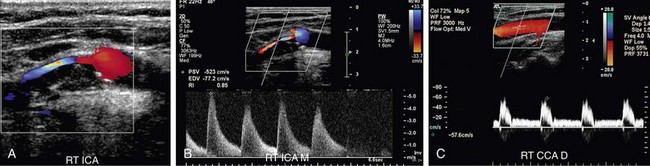
 FIGURE 90-13
Once an ICA stenosis becomes greater than an approximately 96% diameter reduction, PSV velocity begins to drop (Fig. 90-14) until the vessel occludes and the velocity reaches zero.9 Hence, the panel also recommended that the estimation of diameter reduction by plaque on gray-scale and color Doppler imaging be correlated with the velocity-based estimate of percentage stenosis.13
 FIGURE 90-14


