Chapter 3 Ultrasound of Muscle
In 1980 it was discovered that diseased muscles have a different ultrasound appearance compared with healthy muscles.1 Patients with neuromuscular disorders were found to have higher muscle echogenicities, that is, whiter muscles. Beside neuromuscular disorders, malignancies, infections, hematomas, and ruptures of the musculoskeletal system can be detected with ultrasound.2–5 Over time, ultrasound techniques have improved, resulting in the display of muscle tissue with resolutions up to 0.1 mm.6 This is higher than the resolution that can be achieved with 3 Tesla magnetic resonance imaging (MRI), which has a resolution of up to 0.2 × 0.2 × 1 mm.7 Moreover, ultrasound’s dynamic imaging and real-time function make it possible to detect muscle movements and even spontaneous muscle activity such as fasciculations. This chapter provides insight into the technique of quantitative and dynamic muscle ultrasound imaging and an introduction of its use in neuromuscular disorders.
Basics of Ultrasound Physics in Relation to Muscle Ultrasound Imaging
Reflections and Acoustic Impedance
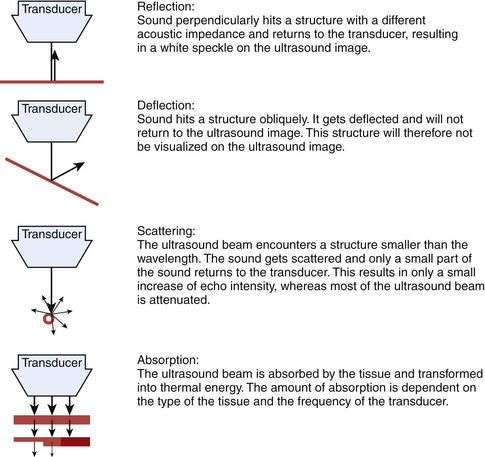
Sound waves and their reflections form the basis of ultrasound images. A transducer sends out pulses of high-frequency sound waves and receives their echoes. Reflection of sound waves can occur when the ultrasound beam encounters a different tissue. Two factors influence the amount of reflection: the acoustic impedance of the two tissues and the angle between the direction of the sound wave and the reflecting surface (Fig. 3.1).8–9
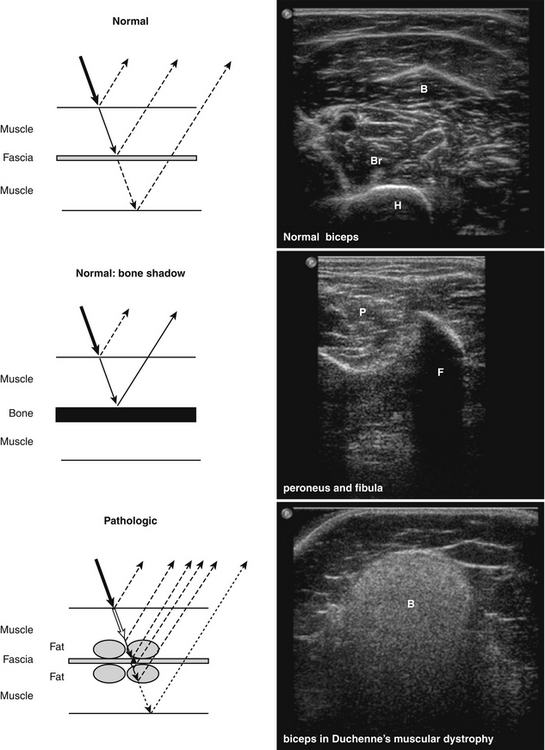
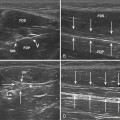
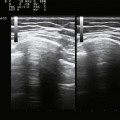
The acoustic impedance is made up by the combination of density of the tissue and the sound velocity within the tissue. The latter is different for each tissue type (Table 3.1). The largest differences in acoustic impedance are found between bone and air, in which sound has a velocity of approximately 300 and 4000 m/s, respectively, whereas in muscle the sound velocity is approximately 1580 m/s.9 The larger the difference in acoustic impedance, the larger the amount of reflection of the ultrasound beam. A small difference in acoustic impedance will result in no reflection or reflection of only a small part of the sound wave, whereas most of the ultrasound beam can pass through to deeper layers. This is also the case in muscle: histologic structures in healthy muscle will mostly transmit sound (Fig. 3.2). Conversely, a transition with a very large difference in acoustic impedance will result in reflection of all sound waves. Beneath such a transition no imaging is possible. For example, the difference in acoustic impedance of air and skin is very large, which makes it impossible to produce ultrasound images without the help of a gel or another contact fluid between the transducer and the skin (Fig. 3.3). A transition from muscle to bone or calcifications will also cause a strong reflection. As the amplitude of the sound wave corresponds to the brightness of the image, the strong reflections of bone result in a bright spot on the ultrasound image. Additionally, because hardly any sound gets through, no structures beneath this transition can be displayed, resulting in a characteristic bone “shadow” (see Fig. 3.2).
Table 3.1 Sound Velocity in Various Tissues
| Tissue | Sound Velocity (m/s) |
|---|---|
| Air | 330 |
| Fat | 1450 |
| Water | 1540 |
| Connective tissue | 1540 |
| Blood | 1570 |
| Muscle | 1585 |
| Bone | 4080 |
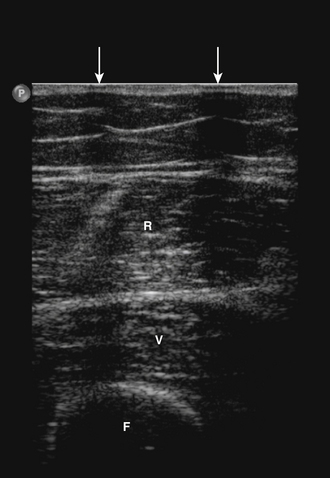
The amount of sound reflection is also determined by the angle at which the ultrasound beam reaches a tissue transition.8–9 A large angle will result in deflection (away from the transducer) instead of reflection of the sound. In this way, the sound wave will not return to the transducer and the structure will not be displayed (see Fig. 3.1). Because of this, fascia surrounding muscle, nerves, and bone will be especially echogenic when they are reached perpendicular by the ultrasound beam. Oblique scanning will cause deflection and diminishes the echogenicity of these structures (Fig. 3.4). Moreover, fascia between muscles that are in line with the ultrasound beam is difficult to visualize; the fascia remains either black or is displayed as an interrupted line (Fig. 3.5).
When the ultrasound beam encounters structures smaller than the wavelength of the sound emitted, such as individual muscle fibers, the sound waves are not reflected but scattered (see Fig. 3.1).9 Only a small part of this sound will return to the transducer, and will therefore result in only a small increase of the gray level in the picture.
Choice of Transducer Frequency
When the sound beam travels to deeper layers, attenuation of the ultrasound beam occurs. Less sound reaches deeper levels, caused by reflection and scattering, but also by absorption and transformation of the beam into thermal energy. The amount of absorption depends on the type of tissue and is, for example, very high in bone. It increases with higher transducer frequencies (Fig. 3.6). For average soft tissues, the loss amounts to approximately 1 dB per 10-mm tissue depth for each MHz. As a rule, the depth penetration is limited to about 200 mm for a 3-MHz probe, 100 mm for a 6-MHz probe, and 12 mm for 50-MHz probe.6
Axial resolution is determined by the transducer frequency. As higher frequencies are accompanied by smaller wavelengths, a transducer with the highest frequency will achieve the best axial resolution. The lateral resolution is best in the focal zone of the ultrasound beam and is several times larger than the axial resolution.6 This means that when the focus of the ultrasound beam is positioned at a depth that contains the structures of interest (i.e., the muscles under investigation) these structures will be visualized with the best lateral resolution.
Normal Muscle
Histology
To understand what is visualized with muscle ultrasound, it is also necessary to know the architecture of muscles up to the maximum resolution of muscle ultrasound. Muscles are composed of individual muscle fibers that normally have a diameter of approximately 40 to 80 μm.10 The resolution of muscle ultrasound is around 100 μm, which means that either one large fiber or a group of small muscle fibers are the smallest structures within muscle that can be visualized. Each muscle fiber is surrounded by thin fibrous tissue called endomysium. A group of muscle fibers forms a muscle fascicle, surrounded by perimysium. This connective tissue also contains small blood vessels and nerves. The outside covering of the muscle is made of fibrous tissue called epimysium, which is thicker and stronger than perimysium (Fig. 3.7). The epimysium continues at the origin and insertion to form tendons and sheetlike tendons called aponeuroses.11
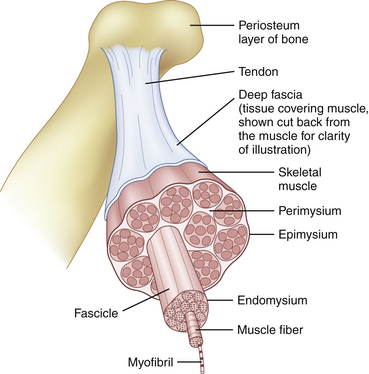
Fig. 3.7 Normal muscle architecture.
(Adapted from The structure of muscle and associated connective tissues. lvyRose Holistic: Holistic Health, Alternative Medicine, Human Biology, and Anatomy & Physiology. Available at www.ivy-rose.co/uk/humanbody/muscles/muscle_structure.php. Accessed June 2008.)
The organization of muscle fascicles results in the macroarchitecture of a muscle. In some muscles, the fibers run parallel to the long axis of the muscle and a few of them run through its whole length (Fig. 3.8A). In other muscles, the fibers are obliquely oriented to the long axis of the muscle. Because of their resemblance to feathers these are called pennate muscles (see Fig. 3.8B). They can be divided in unipennate muscles when the fibers have one linear origin resembling one half of a feather; bipennate muscles when the fibers arise from a broad surface resembling a whole feather; multipennate muscles when septa extend into the attachment of the muscles, dividing them into several feather-like portions; and circumpennate muscles when the fibers converge on a tendon extending into their substance (like the feathers of a dart). In other muscles, the fibers converge from a wide attachment to a fibrous apex (see Fig. 3.8C). This type of muscle is described as a fan-shaped or triangular muscle.12
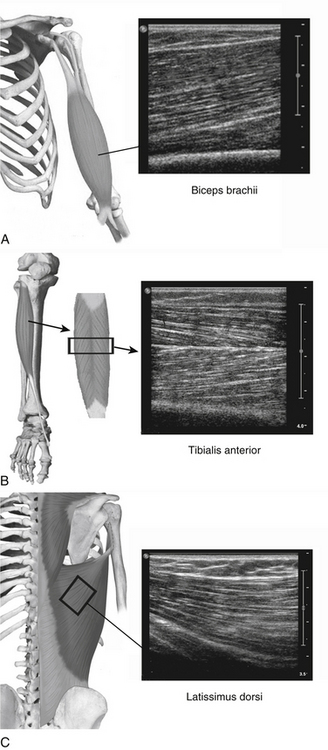
(Part of the anatomical drawings were modified and used with permission from PreventDisease.com: Muscle atlas. Available at www.preventdisease.com/home/muscleatlas.shtml. Accessed June 2008.)
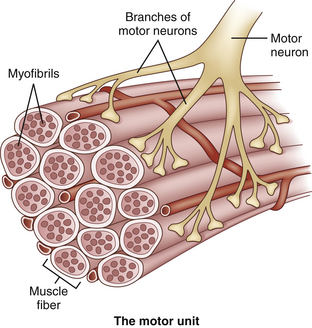
Apart from a structural or histologic organization, muscles also have a functional or physiologic organization. This functional unit is called a motor unit, consisting of one motor neuron and the muscle fibers it controls (Fig. 3.9). The number of muscle fibers in a motor unit varies from less than 10 to several hundred, according to the size and function of the muscle. Large motor units, where one neuron supplies several hundred muscle fibers, are found in the trunk and thigh muscles, whereas motor units of small eye and hand muscles, where precision movements are required, contain only a few muscle fibers. The muscle fibers of a motor unit are not grouped together but spread among the muscle fascicles.11 Therefore, the diameter of a motor unit can range from less than one millimeter to more than one centimeter wide. Because muscle fibers have no anatomic features that attribute them to one particular motor unit, it is impossible to tell with an imaging technique which muscle fibers belong to which motor unit. Hypothetically, if pathology was confined to one motor unit or a single motor unit was activated and would contract, imaging techniques might be able to visualize this particular motor unit provided that the resolution is sufficient.
Ultrasound of Normal Muscle Tissue
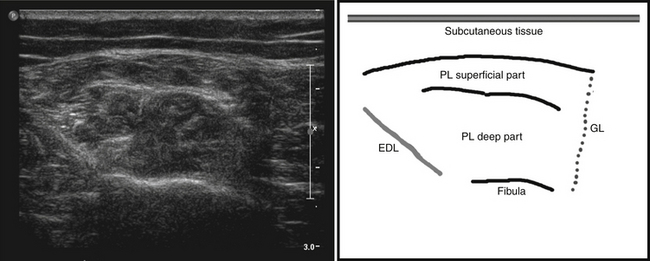
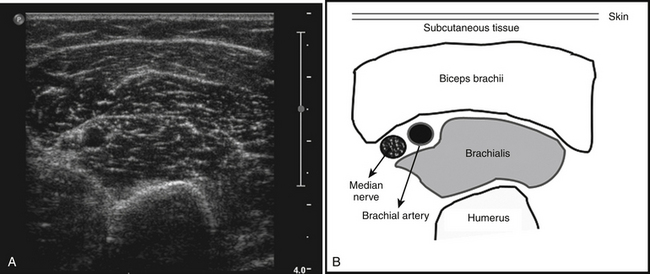
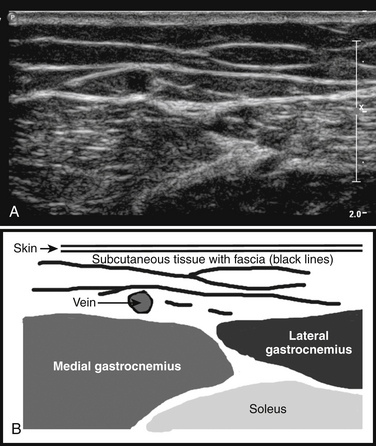
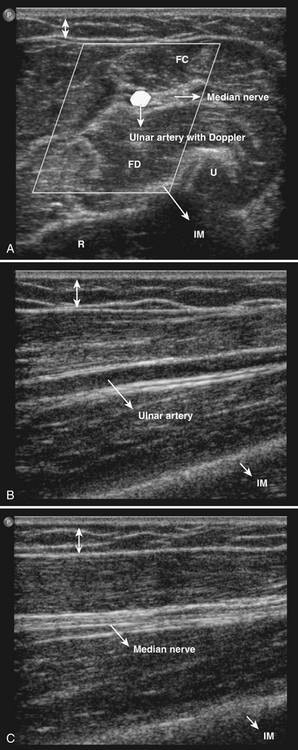
The ultrasonographic appearance of muscles is fairly distinct and can easily be discriminated from surrounding structures such as subcutaneous fat, bone, nerves, and blood vessels (Fig. 3.10).13–14 Normal muscle tissue is relatively black, that is to say, it has a low echogenicity. In the transverse plane, which is perpendicular to the long axis of the muscle, muscle tissue has a speckled appearance because of reflections of perimysial connective tissue that is moderately echogenic (see Fig. 3.10). In the longitudinal plane (parallel to the long axis of the muscle) the fascicular architecture of muscle tissue becomes visible. Reflections of the perimysial connective tissue result in a linear, pennate, or triangular structure on the ultrasound image (see Fig. 3.9). The boundaries of the muscle are clearly visible because the epimysium surrounding the muscle is a highly reflective structure. In normal subjects, the bone echo beneath the muscle is strong and distinct with an anechoic bone shadow underneath (see Fig. 3.2B). Subcutaneous fat has a low echogenicity, but several echogenic septa of connective tissue may be visible within this tissue layer (Fig. 3.11). Nerves and tendons are relatively hyperechoic compared with healthy muscles, whereas blood vessels are hypoechoic or anechoic circles or lines depending on the direction of the ultrasound beam (Fig. 3.12A). When one is unsure about the nature of a round or linear structure, Doppler imaging can confirm the presence of arteries or veins, by showing blood flow (Fig. 3.12B).
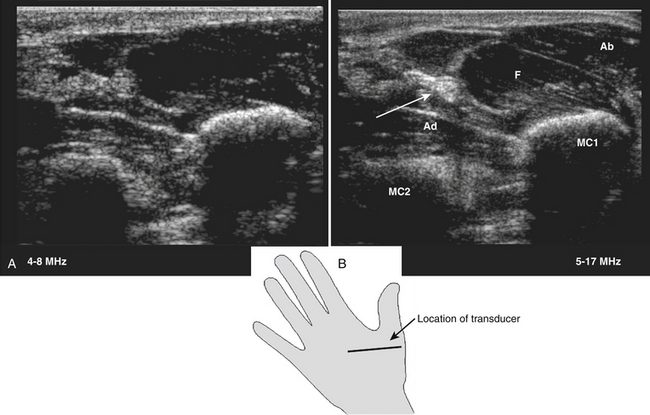
All superficial muscles can easily be imaged with ultrasound, although it can be difficult to identify individual small muscles when multiple muscle groups overlap. Recent ultrasound technology using higher transducer frequencies with corresponding higher axial resolutions has made it possible to image individual superficial small muscles in, for example, the hand (Fig. 3.13). Deeper muscles, especially in the pelvic region or around the trunk, can be difficult to visualize with sufficient resolution because of the reflection or absorption of sound by superficial tissue layers, such as skin, subcutaneous tissue, or other muscles.
Muscle Thickness
Muscle ultrasound is a reliable method to measure muscle thickness and cross-sectional areas,15–17 with a test-retest correlation of 0.98 to 0.9915,18 and a 0.99 correlation MRI.15 Several studies have used ultrasound to establish muscle thickness in healthy subjects. During childhood, muscle thickness increases rapidly. The main variable to predict muscle thickness in this age group is weight.19 Gender differences do not influence muscle thickness until puberty, when men start to develop bigger muscles than women.20–22 After puberty muscle thickness increases further in both genders, until a peak is reached between 25 and 50 years of age. Thereafter, muscle thickness declines.21–24 The influence of age and gender is different for each muscle group and should be taken into consideration when evaluating muscle ultrasound scans of individual patients.
Muscle Echogenicity
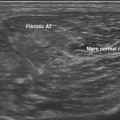
Muscle structure can also be evaluated with ultrasound by evaluating muscle echogenicity. Normal muscles are relatively black, but different muscles have specific appearances on ultrasound because of the variability in proportion of fibrous tissue and the orientation of muscle fibers. For example, the anterior tibial muscle has generally a whiter appearance than the rectus femoris.19
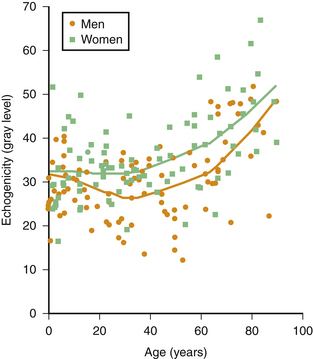
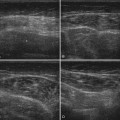
Muscle echogenicity increases with age, which is caused by age-related replacement of muscle fibers by fat and fibrous tissue.25,26 Figure 3.14 shows an example of this age-related increase in muscle echogenicity of the biceps brachii muscle. Fat and fibrous tissue have a different acoustic impedance, increasing the number of reflecting interfaces in the muscle, which gives the muscle a whiter appearance (see Fig. 3.2B). Essentially, the same mechanism also causes increased muscle echogenicity in neuromuscular disorders.1,27 The visibility of structures in and surrounding the muscle can provide additional clues about the presence of structural muscle changes. In several neuromuscular disorders, such as muscular dystrophies and spinal muscular atrophy, this finding can be as prominent as the increase in muscle echogenicity.28,29
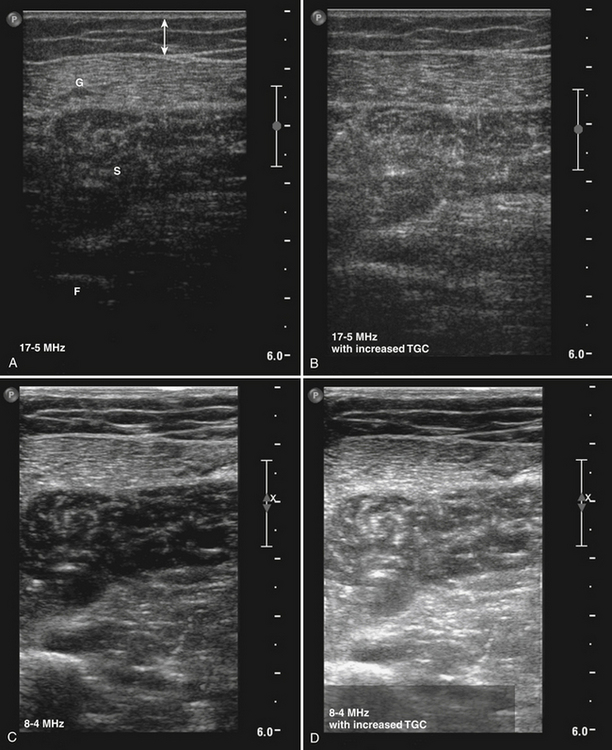
Visual detection of slightly increased muscle echogenicity can be difficult and its accurate interpretation depends on the experience of the observer, especially because different muscles have different appearances, and muscle echogenicity increases with age. Changes in ultrasound system settings, such as increased gain, can also give muscles a whiter appearance that can be mistaken for pathologically increased echogenicity. For these reasons, visual evaluation of muscle ultrasound has shown a relatively low interobserver agreement (kappa 0.53) that further deteriorated when an inexperienced observer interpreted the images.30 To overcome this problem, computer-aided techniques were introduced to help image interpretation. Quantification of muscle echogenicity can be achieved with simple gray scale analysis (Fig. 3.15).23,30–32 Quantitative echogenicity analysis is a robust clinical technique with a high interobserver agreement (kappa 0.86).30
Stay updated, free articles. Join our Telegram channel

Full access? Get Clinical Tree


