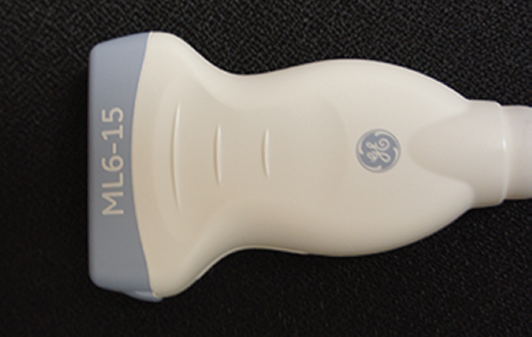
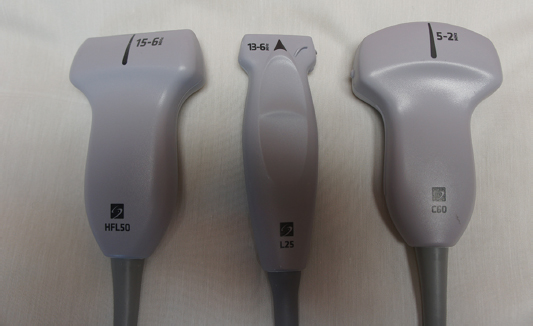
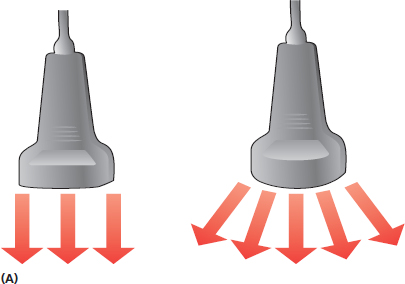
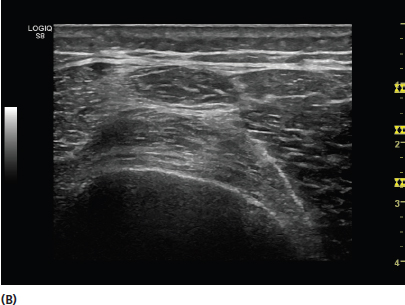
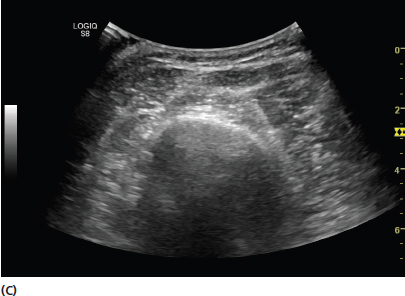
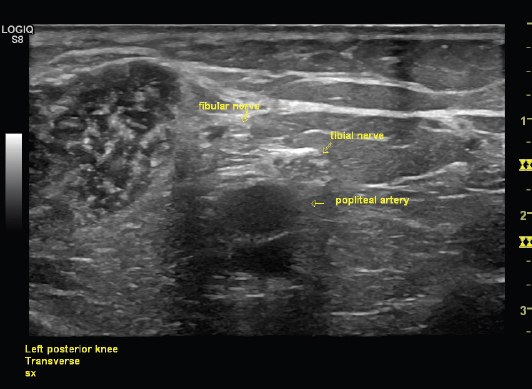
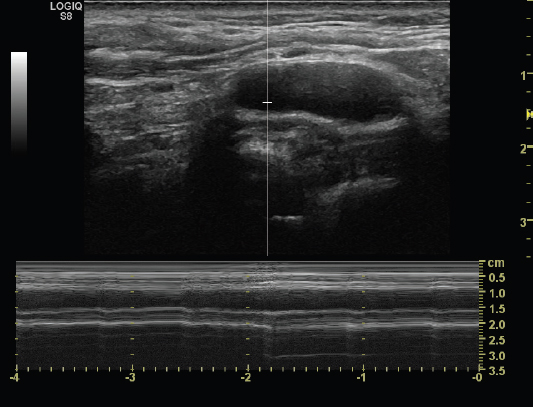
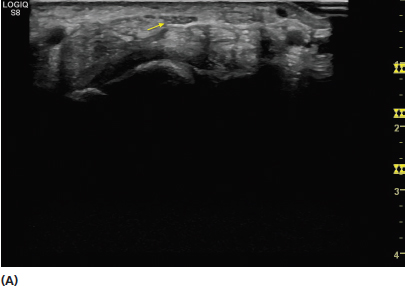
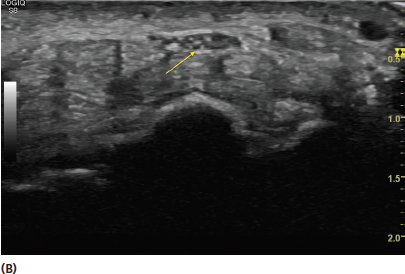
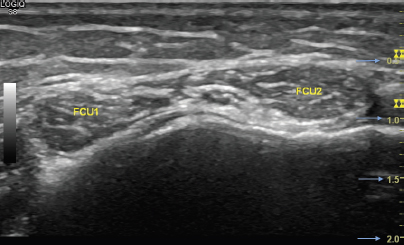
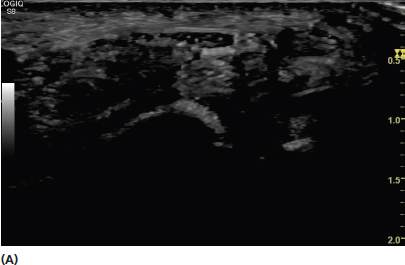
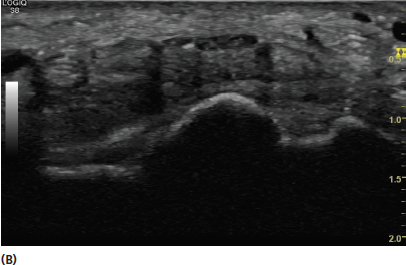
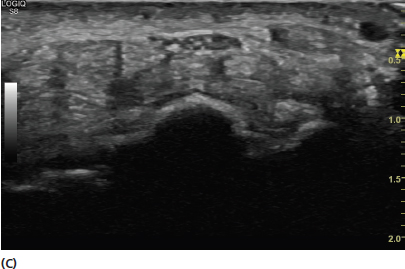
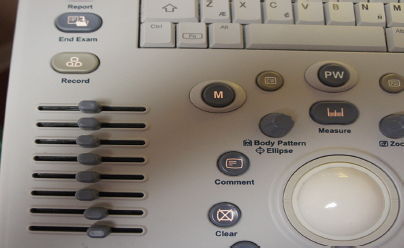
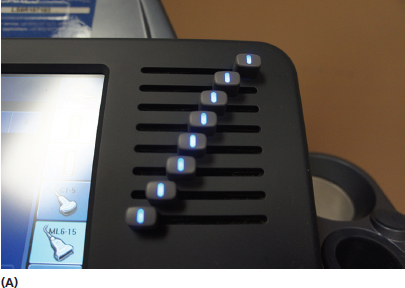
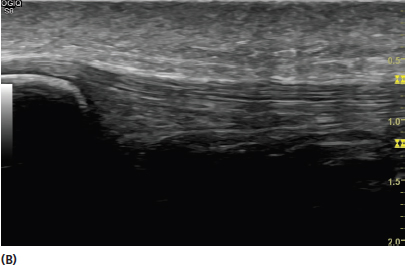
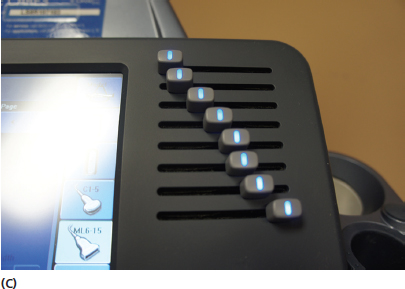
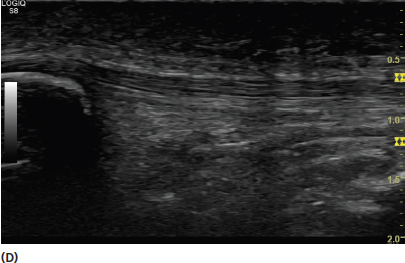
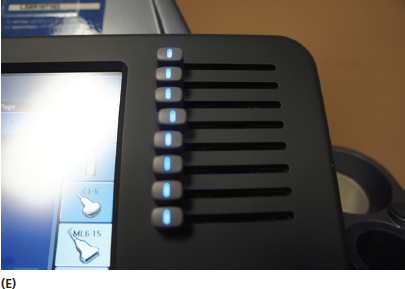
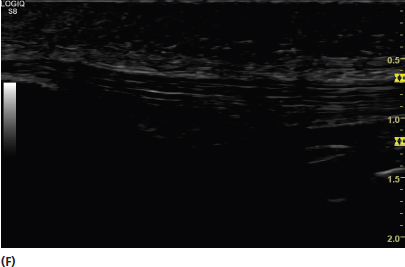
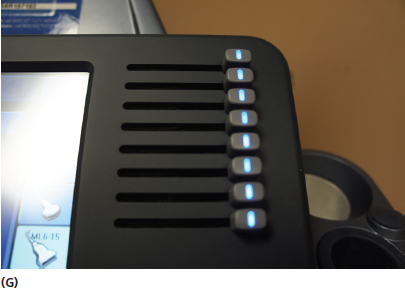
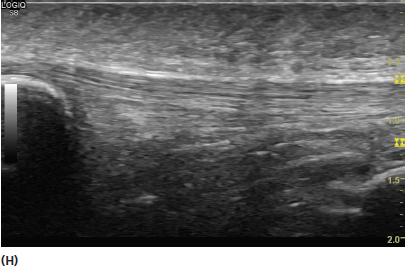
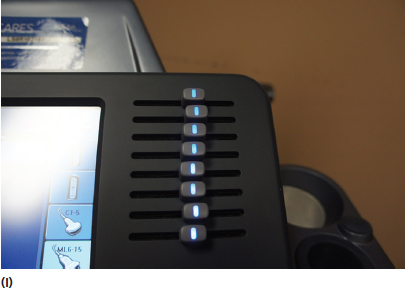
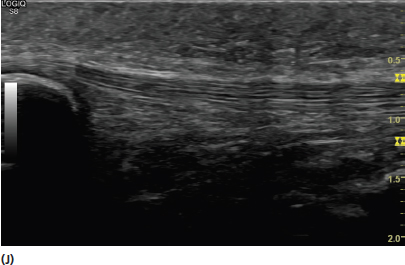
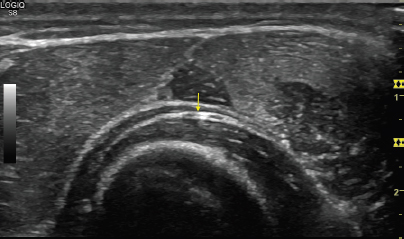
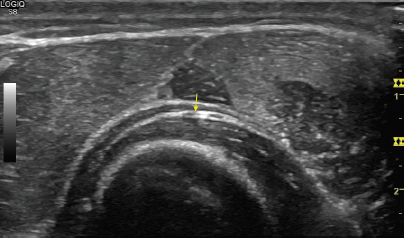
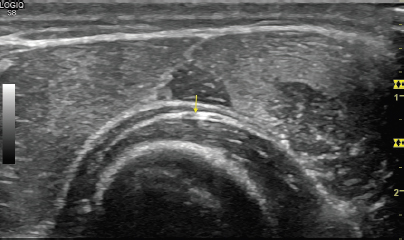
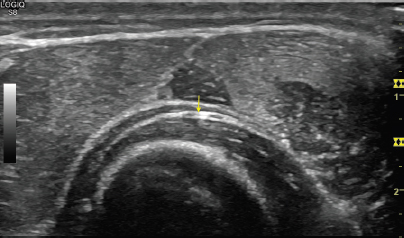
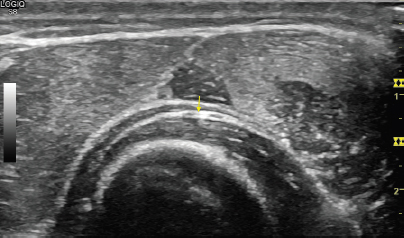
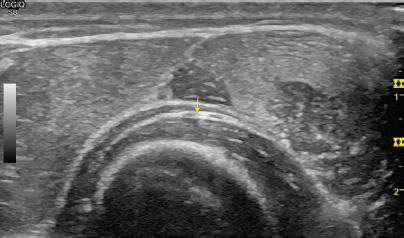
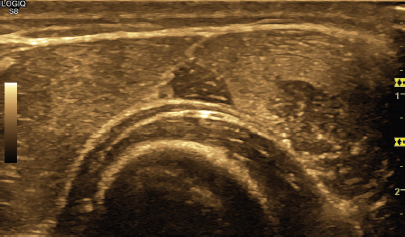
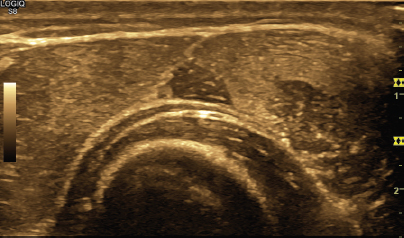
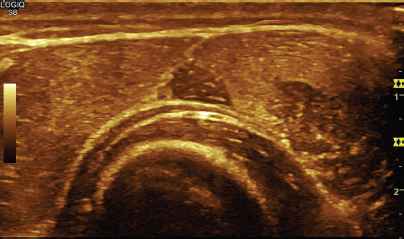
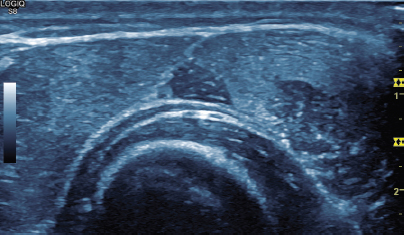
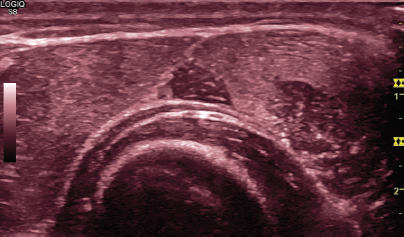
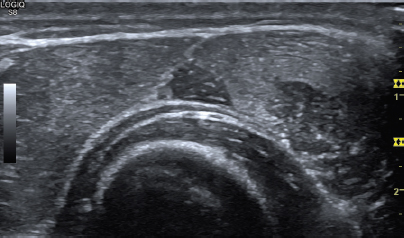
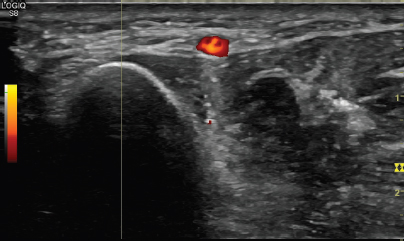
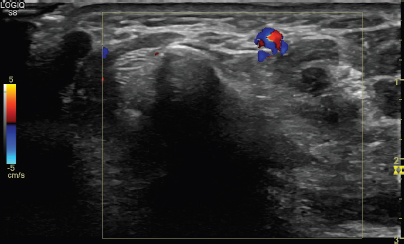
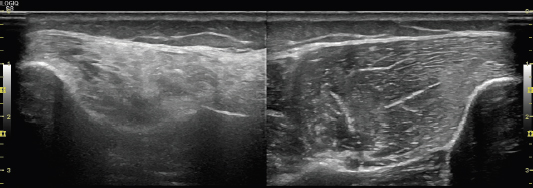
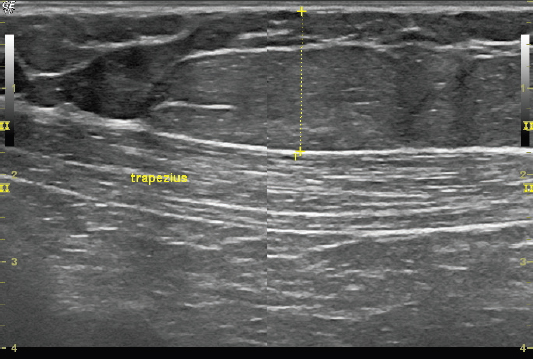
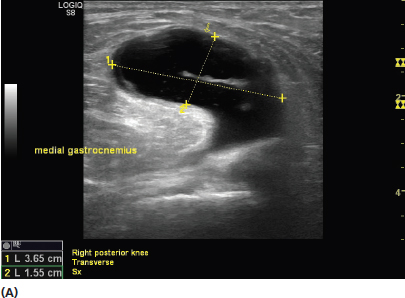
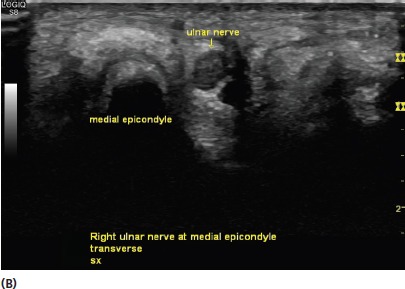
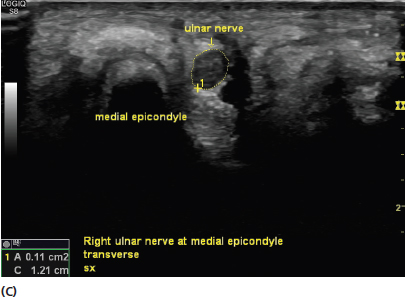
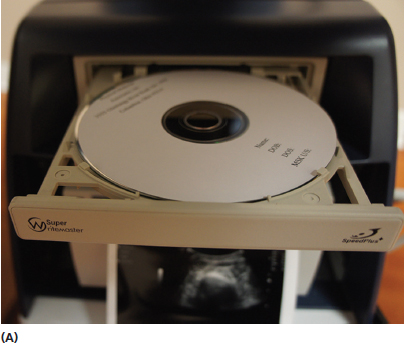
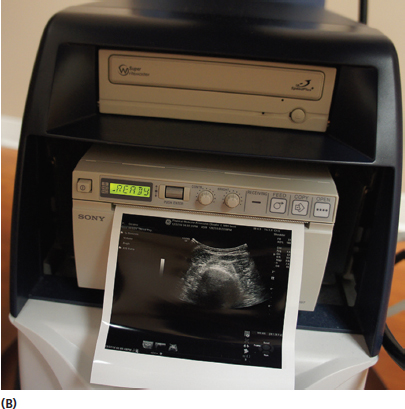
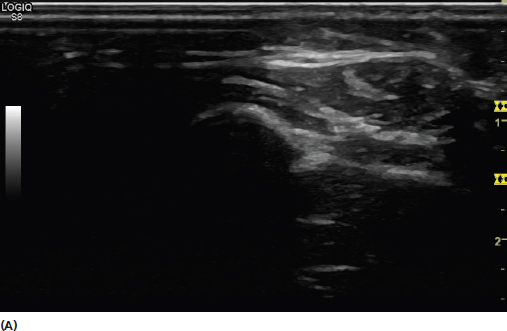
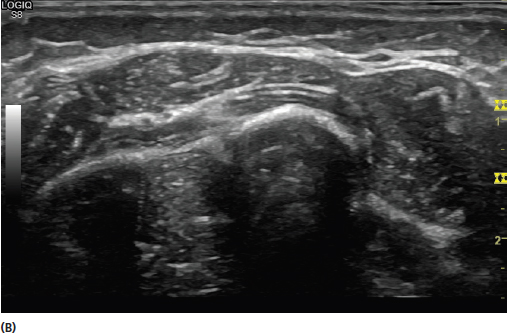
The vast array of controls on most ultrasound machines can create anxiety for the beginner. Developing an understanding of the purpose of the instrumentation will facilitate the ability to create an optimal image of the tissue intended. Although daunting to some at first glance, systematically learning the purpose and utility of the controls can be accomplished easily in a relatively short amount of time. The transducer is often considered the most important component of the ultrasound machine (Figure 3.1). The characteristics of the transducer determine much of the frequency and resolution of the image. The transducer contains a crystal matrix, typically quartz. It uses the reverse piezoelectric effect described in Chapter 2, to create sound waves that enter the tissue of interest, which are then reflected back. The transducer receives the reflected sound waves and converts them into electrical impulses (piezoelectric effect) used to create the ultrasound image. During active scanning, the transducer typically receives sound waves 80% of the time and transmits sound waves during the other 20%. There are different types of transducers used in ultrasound. The traditional transducer types utilized for high-frequency musculoskeletal ultrasound include linear, curvilinear, and small footprint or hockey stick (Figure 3.2). Linear transducers are used for most musculoskeletal applications. They are generally high-frequency broadband transducers that are designed to provide high-resolution images of relatively superficial structures (Figure 3.3). By contrast, curvilinear transducers should be used when images of deeper structures are needed, such as the hip. In general, the higher frequency linear transducers should be used whenever possible to provide the best image. The small footprint transducers are linear transducers that are sometimes desirable when imaging around smaller areas or bony prominences. FIGURE 3.1 Picture of a linear broadband transducer. FIGURE 3.2 Picture of different types of transducers typically used for musculoskeletal ultrasound evaluations. From left to right, there is a linear, small footprint, and curvilinear transducer. FIGURE 3.3 Demonstration of differences between a linear and curvilinear transducer. (A) An illustration of beam direction emitted from a linear (left) transducer versus a curvilinear (right). Note that the beam direction emitted from a curvilinear transducer extends to a wider area. It also emits lower frequency sound waves that extend deeper. The profile of the higher frequency linear transducer provides better resolution for more superficial structures. (B) Sonogram showing the appearance of the image created by a linear transducer. (C) Sonogram showing the appearance of the image created by a curvilinear transducer. There are different echo display modes used by ultrasound machines. This includes A-mode (amplitude), B-mode (brightness), and M-mode (motion). A-mode provides a display of the processed information versus time. It is the simplest form of ultrasound. A single transducer scans a line through the body and the images plotted are a function of depth of the tissue. Currently, A-mode is rarely used for medical diagnostic ultrasound, with the exception of some ophthalmology applications. B-mode uses A-mode information and converts it into dots that are modulated by brightness (Figure 3.4). B-mode is also known as 2D-mode and uses a linear array of transducers to create a two-dimensional (2D) image of a plane of tissue. This is the imaging mode used in most medical ultrasound applications and currently almost exclusively in musculoskeletal sonography. The basic physics of the creation of the B-mode image is discussed in Chapter 2. FIGURE 3.4 Sonogram showing the characteristic gray scale image of B-mode (2D) ultrasound. M-mode uses B-mode information and displays the echoes from a moving organ. Ultrasound pulses are emitted in quick succession and the reflections from the moving organ provide information on the position of its boundaries. This is roughly analogous to recording an ultrasound movie (Figure 3.5). FIGURE 3.5 Sonogram showing M-mode ultrasound. This mode captures the returning echoes in only a single line of the B-mode image and displays them over time. In this sonogram, the B-mode (top) and M-mode (bottom) images are displayed in the same view on the screen. The depth control changes the size of the area imaged. The goal of selecting the appropriate depth setting is to see deep enough into the field desired, but also limit wasted space below the image. An excessively deep setting minimizes the size of the structures desired (Figure 3.6). Most machines have depth measurement on the screen (Figure 3.7). This facilitates measurement of the structure size and depth of the field. FIGURE 3.6 Sonograms demonstrating the proper use of the depth setting. (A) Demonstrates an image with excessive depth resulting in significant wasted space and more difficulty seeing the desired structure (median nerve—yellow arrow). (B) Demonstrates a more appropriate use of the depth setting to provide a better image of the structure of interest. FIGURE 3.7 Sonogram showing the depth scale to the right of the screen (in yellow, illuminated by the blue arrows). This scale is labeled in centimeters with each mark representing 1 mm. The depth of this entire image is 2 cm. The frequency control determines the frequency of the sound wave emission from the broadband transducer. As discussed in Chapter 2, the higher frequencies provide better resolution for superficial structures, but do not penetrate to deeper tissue as well as lower frequencies Figure 2.3). It is common to change the frequency setting repeatedly during an ultrasound evaluation to optimize visualization of both deep and superficial structures. The gray scale gain essentially controls the brightness of the image. It is analogous to the volume knob on a radio. It is increased if a brighter image is desired and decreased if a darker image is desired (Figure 3.8). Changing the gain does not affect the resolution but can often provide variations in contrast between different types of tissues. FIGURE 3.8 Sonogram of a short-axis view of the median nerve and surrounding flexor tendons with progressively higher gain. The image in (A) has the lowest gain and is darkest. The image in (C) has the higher gain and is the brightest of the three. The time gain compensation (TGC) is often the most intimidating control on the ultrasound machine for beginners (Figure 3.9). Despite the multiple knobs, it is simply a control to allow segmental gain changes from top to bottom of the image (Figure 3.10). With the instrument shown, when the control is moved toward the right, that corresponding segment becomes brighter. Conversely when the control is moved to the left, its corresponding segment of the image becomes darker. All of the controls are generally kept close to the middle for most scanning purposes. The controls are moved when there is a desire to emphasize or de-emphasize a certain level or levels of the image. FIGURE 3.9 Picture of the TGC controls (lower left portion of the picture) on the ultrasound machine. FIGURE 3.10 Picture of the TGC control configuration and the corresponding result of the sonogram appearance. The gain control for each control knob corresponds to its relative position on the screen. For example, the control knob at the top alters the gain for the top segment of the image and the control knob at the bottom alters the gain for the bottom segment of the image. The control settings positioned as in picture (A) creates an image as in (B) with the top segment the brightest, the middle segment moderately bright, and the lower segment the darkest. Reversing the control settings (C) makes the top segment the darkest and the bottom the brightest (D). Moving all of the TGC controls to the left (E) creates the darkest image based on the gain settings (F). Moving all of the TGC controls to the right (G) creates the brightest image (H). Placing the TGC controls to the middle (I) creates a uniform gain (J). Note that the darker appearance in the deeper aspect of the image in (J) is mostly a reflection of the depth of tissue and that level and the relative penetration of the incident sound waves. Mapping is used to create differences in image color and contrast. Some of the mapping changes can be relatively subtle and the appearance of the image is often merely personal preference (Figure 3.11). For most common musculoskeletal examinations, frequent mapping changes are unnecessary. It is reasonable to become familiar with different mapping effects on the image as scanning skills progress. Changing the tint can also influence the appearance and color of the image (Figure 3.12). These changes are also personal preference and are less commonly utilized in routine musculoskeletal evaluations. FIGURE 3.11 Sonograms of the same structure with different mapping. Some of the differences are relatively subtle and mapping is often personal preference; however, mapping can be used to provide improved discrimination between tissues. In this image, mapping changes can help provide better conspicuity of the deep branch of the radial nerve (yellow arrow). FIGURE 3.12 Sonograms of the same structure shown in Figure 3.11 but with different tints. Both color and power Doppler controls are a vital part of musculoskeletal ultrasound scanning. Their application and clinical utility are discussed in more detail in Chapter 6. Doppler imaging detects movement and therefore, is useful for detecting blood flow. Power Doppler is highly sensitive for movement and is depicted by red (or orange) hue (Figure 3.13). Color Doppler detects direction of flow in relation to the transducer and is depicted by red (toward the transducer) and blue (away from the transducer) colors (Figure 3.14). FIGURE 3.13 Sonogram using power Doppler to demonstrate flow through the radial artery in short axis. Note that the flow in power Doppler is depicted exclusively in red. FIGURE 3.14 Sonogram using color Doppler to demonstrate flow through the radial artery in short axis. Note that the flow can be depicted in either red (toward the transducer) or blue (away from the transducer) or both. Many ultrasound machines allow simultaneous images to be produced on the video console. This feature can provide simultaneous visualization of side-to-side comparison images (Figure 3.15). It can also be used to juxtapose sequential images to create a smoother single image over a larger field when slight position changes of the transducer is needed to produce clarity (Figure 3.16). FIGURE 3.15 Sonogram demonstrating the value of using a split-screen image for side-to-side comparisons. In this instance, anterior compartment muscle in the leg with neurogenic atrophy (image on left) is compared with the normal leg at the same position (image on the right). FIGURE 3.16 Sonogram showing the use of the juxtaposed split screen to extend the view of a longer image (in this example, trapezius and overlying lipoma) in long-axis view. Ultrasound machines have capabilities of very precise tissue measurement. The examiner should be familiar with controls for measurement. Most machines have the capability to perform multiple linear measurements, as well as to trace circular structures for cross-sectional area (Figure 3.17). FIGURE 3.17 Sonograms demonstrating the use of measurement tools with ultrasound. The image in (A) shows the use of linear measurement of a Baker’s cyst. The length in centimeters is shown in the left lower corner. The image in (B) shows the ulnar nerve in short axis at the level of the ulnar groove. The image in (C) shows the postmeasurement view. The cross-sectional area (A) of the nerve is shown in centimeters squared, the circumference (C) is shown in centimeters. Detailed image labeling is helpful for communication of results as well as future reference. It is important to identify the right or left side of the body as well as the orientation of the structure being imaged. The pertinent structure should be named as well as its orientation. Markers such as arrows are generally available to indicate the focal area of interest. When side-to-side images are being used, it is often helpful to label the symptomatic and asymptomatic side for clarity for the observer (Figure 3.18). FIGURE 3.18 Sonogram demonstrating the use of labeling for orientation. In this example, the terminal branch level of the brachial plexus is shown. The structures of interest are identified. The side and area of the body are labeled. The view (transverse) is labeled and there is mention that this is the symptomatic side (sx) in the event there are left-to-right comparisons. The purpose of the detailed labeling is to allow review of the images and facilitate the correct orientation and identification for other observers. Image storage is needed to allow the pictures to be viewed at a later time. Printers are usually available with most machines and many can burn DVDs to allow the cinematography images to be carried to other locations, including physician appointments (Figure 3.19). Most machines have substantial data storage to allow the images to be viewed at a later time. The use of external hard drives for additional storage will help prevent the ultrasound machine from running out of memory. FIGURE 3.19 Pictures demonstrating examples of devices used for image storage and display. (A) DVD burner. (B) Printer for paper images. The printers allow easy viewing of the images. The DVDs can be transferred easily to other offices and include the motions loops. Ultrasound requires a solid medium to transmit a signal and provide a clear picture. Most frequently conduction gel or standoff pads are used for this purpose. Liberal use of this medium can prevent distortion of the image (Figure 3.20). FIGURE 3.20 Sonograms demonstrating the value of adequate medium (gel) between the transducer and the skin of the patient. (A) Image with insufficient transmission gel and resultant poor quality. (B) Image of the same body region (forearm) with adequate gel eliminating the artifact from incomplete sound transmission back to the transducer with greatly improved quality. The ultrasound transducer is the portion of the machine that makes contact with the patient and should be cleaned after each application. The transducer should be cleaned with soap and water or with low-level disinfectants such as quaternary ammonium sprays or wipes. Alcohol has the potential to damage the crystals in the transducer and should be avoided. The transducer should then be dried completely with a soft towel or cloth. Routine cleaning should not be confused with high-level disinfection required of internal and intraoperative probes. Protocols for higher level disinfection frequently change. In the United States, the Centers for Disease Control and Prevention website can be used for a reference. Some machines come with more advanced controls that include beam steering to change the angle of the incident sound waves emitted from the transducer, extended field of view to allow imaging over longer structures, and three-dimensional imaging among others. Detailed discussion of these and other advanced features are beyond the scope of this introductory text. Eventual mastery of these techniques will provide even greater imaging capabilities in the future. 1) Take the time to learn the instrumentation in detail to develop the highest quality scanning. 2) Select the appropriate broadband transducer for the tissue being scanned. Generally, the highest frequency available that can adequately reach the tissue is desired. 3) When first learning your way around the machine, use the B-mode button to return to the basic 2D scanning mode.
Understanding the Equipment
TRANSDUCERS
ULTRASOUND IMAGING MODES
DEPTH
FREQUENCY CONTROL
GRAY SCALE GAIN
TIME GAIN COMPENSATION
MAPPING
DOPPLER IMAGING
SPLIT SCREEN
MARKING AND MEASUREMENT TOOL
LABELING
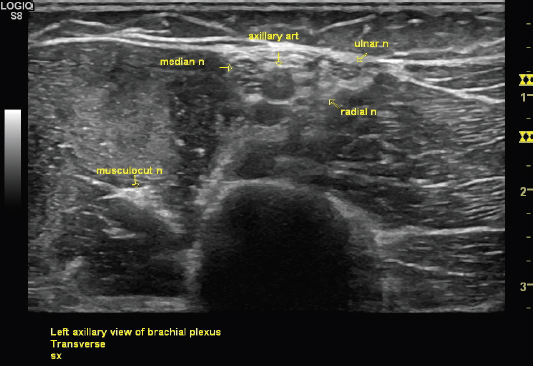
IMAGE STORAGE
GEL AND STANDOFF PADS
CLEANING THE INSTRUMENT
ADVANCED CONTROLS
REMEMBER
![]()
Related posts:
Stay updated, free articles. Join our Telegram channel

Full access? Get Clinical Tree


