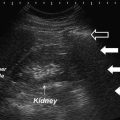
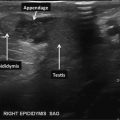
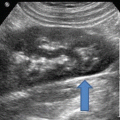
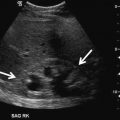
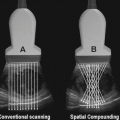
Fig. 16.1
The image should provide a clear , unimpeded ultrasound representation of the anatomy of interest. Gain, acoustic output, Time-Gain Compensation, Transducer frequency, Focal zone, Depth size, Image contrast, Image brightness, and Field of view must be set to be of ‘publishable’ quality
- 1.
Sufficient and uniform brightness
- 2.
Sharp and in focus
- 3.
Adequate size
- 4.
Proper image orientation
- 5.
Proper labeling which should be of uniform case and esthetically positioned
The use of electronic medical records has made the documentation of ultrasound examinations somewhat easier. However, it has also created challenges in managing the archives of images and assuring the accessibility of these records to only authorized personnel. Regulatory requirements for documentation have been promulgated by the American College of Radiology (ACR) and the American Institute of Ultrasound in Medicine (AIUM). In addition, Federal and state regulations governing electronic data storage of patient information also apply and need to be adhered to.
The AIUM PRACTICE GUIDELINES and in particular for Ultrasound in the Practice of Urology [2]. These guidelines discuss Qualifications and responsibilities of personnel as well as specifications for individual examinations.
Considerations regarding the documentation and storage of ultrasound studies include:
Providing a mechanism for the retrieval and storage of images and reports of all studies performed .
Storing ultrasound images and the report on a secure recording media.
The report and the information included on the images should meet or exceed the standards promulgated by accreditation organizations such as the AIUM.
Ultrasound images and a report from the interpreting physician must be maintained in a readily accessible fashion for comparison and consultation .
Recording media must have a shelf life compatible with the minimum number of years, required by law, for the maintenance of patient records. In most states, this will be for at least 7 years after the patient’s last examination was performed; however, these requirements vary from state to state. For pediatric patients, the recommended period is until the patient reaches the age of 21.
Images and the reports pertaining to them are considered protected health information and are subject to the regulations of the Health Insurance Portability and Accountability Act of 1996. Federal and State Regulatory Requirements for Document Storage.
Federal and State regulatory requirements must be implemented for storage of patient studies. These include the Health Insurance Portability and Accountability Act of 1996 (HIPAA) [3], HiTech Act of 2009 [4], possibly FDA regulations Title 21 CFR Part 1270 if human tissue is also being stored as part of the procedure, Subpart C [5], plus State regulations usually written and enforced by the State’s Department of Health .
Specific Ultrasound Protocols
To assist the urologic sonographer to develop a systematic way to scan a particular organ system I present the following set of ultrasound protocols. There is no “correct” way to perform a scan. Many alternative approaches exist. However, I strongly believe that having an organized approach will allow the sonographer to perform a comprehensive and expeditious exam that will provide optimum patient care. What follows represents one Urologist’s approach and should be used as a guideline for the novice and as a point of reference for the more experienced sonographer. Protocols for quick reference and templates for data entry are provided (Appendix). Many practices incorporate the templates as part of their electronic medical record.
Color and Spectral Doppler
The use of color Doppler imaging should be considered an integral part of all ultrasound exams. Many inflammatory, neoplastic, and benign conditions have characteristic flow patterns that can assist in diagnosis. Each examination requires images that document the blood flow in that organ and if a paired organ system is present then comparison of blood flow between the organs interrogated is required.
Spectral Doppler is evolving as an invaluable component of the several urologic ultrasound exams. There is an expanding literature suggesting that these modalities might be a noninvasive indicator of testicular function. Biagiotti et al. [6] provided data suggesting that resistive index (RI) and peak systolic velocity (PSV) were better predictors of dyspermia than FSH and testicular volume. In a companion study they demonstrated that Ri and PSV can differentiate obstructive azoospermia (OA) from nonobstructive azoospermia (NOA).
It is often difficult to interrogate intratesticular vessels when the intratesticular microcirculation is impaired. Unsal et al. [7] provided data supporting interrogation of the capsular vessel and capsular branches in lieu of the intratesticular vessels (Fig. 16.2).
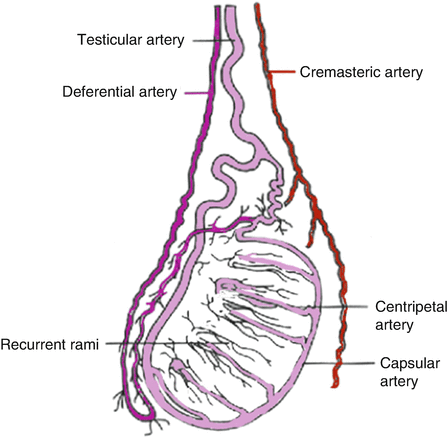

Fig. 16.2
Intratesticular arterial circulation consists of the centripetal and recurrent rami arteries which are branches off the capsular artery which is formed, in turn, from anastomosis of the testicular, deferential and cremasteric arteries
They found that RI of both capsular vessel and capsular branches could serve as indicators of impaired testicular microcirculation. Pinggera et al. [8] examined semen quality and the RI of intratesticular arteries in 160 men. Of interest, their study indicated that 80 with a normal sperm count had a Ri of 0.54 + 0.05 while the 80 with impaired sperm counts had a statistically higher Ri of 0.68 + 0.06. In addition, Balci et al. [9] demonstrated that a decrease in Ri, suggestive of an improved testicular microcirculation, was found after varicocele repair in patients with improvements in semen quality. More recently, we found (Hillelsohn et al. [10]) that an Ri greater than 0.6 was associated with dyspermia and as well as correlating with impaired spermatogenesis on testicular biopsy [11].
In the kidney and Ri of approximately 0.7 is considered normal. An elevated Ri is found in acute renal failure [12] and several other types of renal dysfunction including obstruction [13].
It is therefore our protocol to include Spectral Doppler measurements when examining the testis and kidney with ultrasound.
Sonoelastography
The ability to access pathology by palpation has long been a key part of the Physician’s physical examination. Hard lesions are often a sign of pathology. Sonoelastography (tissue elasticity imaging) is an evolving ultrasound modality which adds the ability to evaluate the elasticity of biological tissues. Essentially, it gives a representation, using color, of the softness or hardness of the tissue of interest.
But how do we use ultrasound to ‘palpate’ an organ? To do so requires a mechanical wave to be produced in the tissue of interest. There are two ways to produce this mechanical wave .
- 1.
A Compression Wave travels quickly in tissue (1500 m/s). The echoes produced by these waves successively compressing tissue layers produce scatter which is then received and processed by the ultrasound equipment. Since the Stress produced by the compression wave cannot be measured only a relative elasticity can be determined.
- 2.
A Shear Wave travels much slower (1–10 m/s) and propagates by creating a tangential ‘sliding’ force between tissue layers. The elasticity (E), density of the tissue (p, kg/m2), and shear wave propagation speed (c) are directly related through the equation E = 3pc 2. Therefore, by measuring the shear wave propagation speed the elasticity of the tissue can be directly determined.
Several approaches for elastography have been introduced. All of them have three common steps:
- 1.
Generate a low frequency vibration in tissue to induce shear stress.
- 2.
Image the tissue with the goal of analyzing the resulting stress.
- 3.
Define a parameter related to tissue stiffness.
The principle of elastography is based on the concept that a given force applied to softer tissue results in a larger displacement than the same force applied to harder tissue. By measuring the tissue displacement induced by compression, it is possible to estimate the tissue hardness and to differentiate benign (soft) from malignant (hard) lesions. This relationship between stress (s) and strain (e) is given by Young’s Modulus or Elasticity (E),
 E is larger in hard tissues and lower in soft tissues.

Visually, the elasticity of a tissue is represented by color spectrum. Be aware that the color given to hard lesions is determined by the manufacturer of the equipment as well as being able to be set by the user. Therefore, just as in using color Doppler, the user needs to look at the color bar (see Figs. 16.3 and 16.4) to know what color represents a ‘hard’ and ‘soft’ lesion.
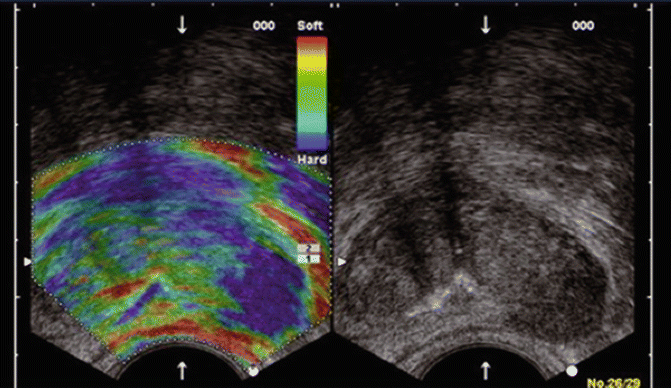
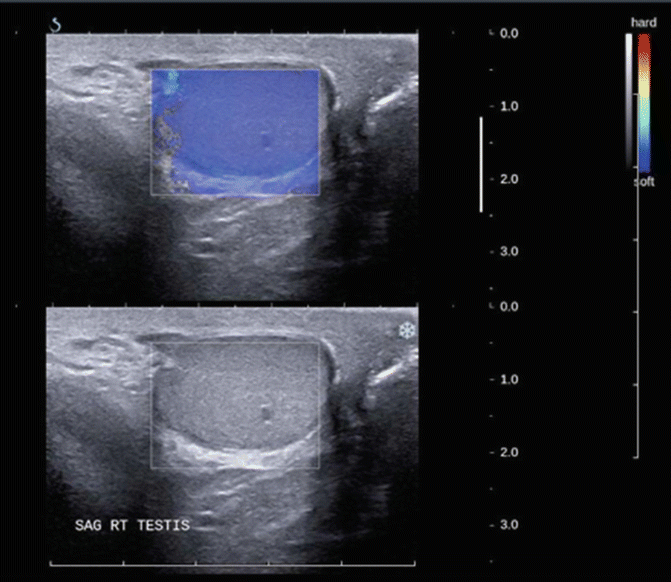

Fig. 16.3
Real-Time elastography of prostate (left image) and gray scale image on the right. In this set of images the harder/firmer tissue is blue while the softer tissue is red

Fig. 16.4
Shear wave elastography of the testis (top image) with B-mode (grey scale) image on the bottom. In this set of images the softer tissue is blue
The three methods commonly used for sonoelastography are as follows:
- 1.
Quasi-Static ultrasound or Real Time Elastography (RTE) and Fig. 16.3 In which the deformation is induced by manually pressing on the anatomy with the transducer, and measured using ultrasound. RTE is a qualitative technique. Due to the requirement of manual displacement, RTE is not able to measure absolute tissue stiffness as currently employed. Its major benefits are that it has a high spatial resolution, is a real time measurement, and does not require any modifications to conventional ultrasound hardware. Companies utilizing this technique including Siemens Healthcare, Toshiba Medical, Medison, GE Healthcare, and Philips Healthcare.
- 2.
Dynamic Elastography: A continuous Low-frequency vibration induces stationary waves which are evaluated to determine elasticity. This approach is used more often with MR since they require manipulation of two devices simultaneously.
- 3.
Shear wave elastography (Fig. 16.4) relies on the observation of the propagation of a transient pulsed (shear) wave to determine the viscoelastic properties of the tissues. This method allows rapid scanning of the organ of interest. A limitation of the generated shear waves is that they are very weak resulting in only a few millimeters of propagation. To compensate for this various electronic innovations have been developed to limit the ultrasound power and overheating that would occur with larger perturbations. Supersonic Imagine is the primary company using this technology .
Two recent studies have used real-time elastography to differentiate benign from malignant testicular lesions, as it is postulated that malignant lesions have an increased stiffness due to a higher concentration of vessels and cells compared to surrounding tissues. Goddi et al. assessed 88 testis with 144 lesions and found a 93 % positive predictive value, 96 % negative predictive value, and 96 % accuracy, and similarly Algner et al. assessed 50 lesions and found a 92 % positive predictive value, 100 % negative predictive value, and 94 % accuracy in differentiating malignant from benign lesions. Additionally, Li et al. have found that men with nonobstructive azoospermia had a significantly different elasticity compared to patients with obstructive azoospermia and healthy controls with a normal semen analysis. Real-time tissue elastography is an exciting new innovation in assessing abnormalities on scrotal examination; however, more data is necessary prior to avoiding surgical intervention based on the findings.
In the kidney, renal masses [14, 15] as well as the viability of renal transplants [16] have been assessed.
When compared with fusion MRI, sonoelastography of the Prostate has similar sensitivity and specificity [17]. The use of various ultrasound modalities, including sonoelastography, has been described as multiparametric ultrasound and appears to significantly improve diagnostic accuracy of ultrasound [18].
If your equipment has Sonoelastography enabled I would encourage you to use this burgeoning modality on all abnormal lesions detected in any organ system interrogated by ultrasound .
Specific Protocol for Scrotal Ultrasound
Specifics to be documented on report :
Indication for Procedure: For example, testicular pain, palpable mass, and thickened skin/contracted scrotum make physical exam difficult. Diagnosis code can also be included to document medical necessity.
Transducer: 12–18 MHz linear array transducer with a footprint that is greater than the testicular length.
Please note: if all components of the exam are not seen then the report should document that component was “Not Seen” and why.
Scanning Technique
The patient is examined in the supine position. There are several different techniques to support the scrotum. The easiest is to use the patient’s legs for support. Other approaches use towels placed across the patient’s thighs or under the scrotum. The phallus is positioned up on the pubis held by the patient and/or covered by a towel.
Transducer Selection
High frequency (12–18 MHz) linear array transducers are most often used for scrotal scanning. Broad bandwidth transducers allow for multiple focal zones, eliminating the need for adjustment during the examination. Multiple frequency transducers allow the transducer to be set at one of several distinct frequencies. A linear array probe with a “footprint” able to measure the longitudinal length of testis is ideal. A curved array probe can be used when there is a thickened scrotal wall or in the presence of scrotal edema or for large testis. The curved array transducer is also useful to compare echogenicity of the testes. However, the frequency is usually lower, resulting in a less detailed image. Color and spectral Doppler are becoming essential elements of scrotal ultrasound because they provide documentation of normal testicular blood flow and paratesticular findings .
Survey Scan
Evaluation of the scrotal contents begins with a longitudinal survey scan , progressing medial to lateral to get an overall impression of the testis and paratesticular structures. The standard orientation of the image should be with the superior pole to the left and the inferior pole to the right on the monitor screen (Fig. 16.5 Top). If the testis is larger than the footprint of the transducer it is difficult to visualize the entire midsagittal testis in a single image. It separately documents views of the superior and inferior portions of the testis including the epididymis in these regions. At least one image should visualize both testes to document the presence of two testes. In addition, a lateral and medial view of each testis should be documented.
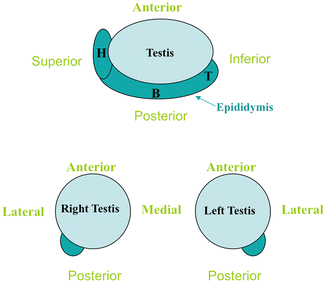

Fig. 16.5
The standard orientation for the right testis is to have the lateral aspect to the left and the medial aspect to the right. Conversely, for the left testis, the lateral aspect should be to the right and the medial aspect to the left. With a view demonstrating both testes the right testis is on the left side of the screen and the left testis is on the right
The transverse view is obtained by rotating the transducer 90° counterclockwise. The standard orientation for the right testis is to have the lateral aspect to the left and the medial aspect to the right. Conversely, for the left testis, the lateral aspect should be to the right and the medial aspect to the left (Fig. 16.5).
Using the mid-testis as a starting point of the survey scan, proceed first toward the superior pole and then back to the mid-testis before scanning to the inferior pole. Measurements of width and AP dimensions are taken and documented at the mid-testis. A measurement should also be made of the long axis at the mid-testis together with the mid-transverse AP measurement. Testicular volume is than calculated from these measurements. If the equipment being used has split screen capabilities, comparative views of echogenicity and blood flow can easily be made and documented.
Scrotal Imaging Protocol:
- 1.
Image showing both testes (single screen) is the first image obtained. This is important to document the presence of both testes and to compare echogenicity between the testes. If a testis is absent or a prosthetic is in place this should be labeled on the image and documented in the report. Comparative scrotal skin thickness can also be measured on this image (Fig. 16.6).
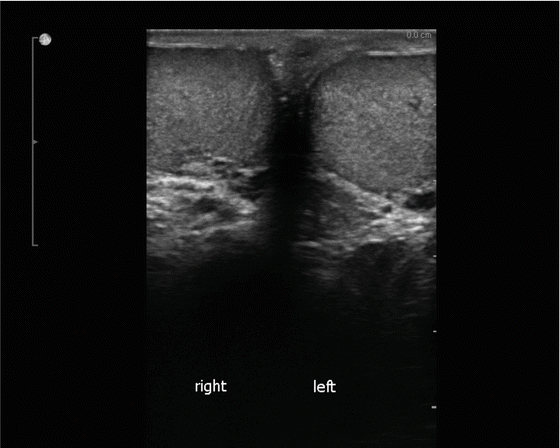
Fig. 16.6
Image showing both testes (single screen image)
- 2.
Video clip of survey scan of the left testicle (longitudinal and transverse). The presence of intratesticular and/or extratesticular masses and fluid collections (e.g., hydrocele fluid) are observed for later documentation.
- 3.
Left testicular measurements with the split screen: longitudinal view on left and transverse view on right (Fig. 16.7).
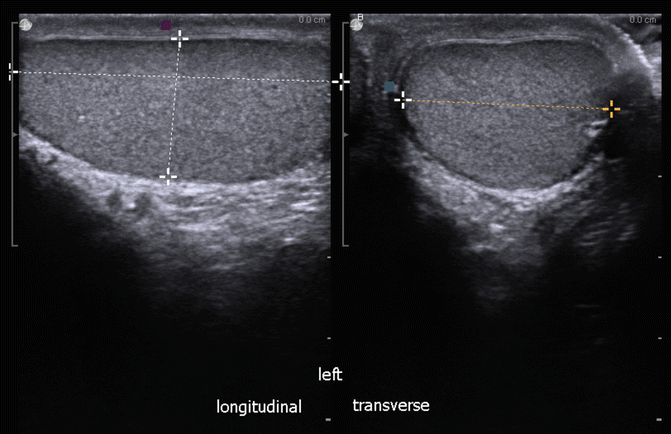
Fig. 16.7
Left testicular measurements (split screen images)
- 4.
Video clip of survey scan of the right testicle (longitudinal and transverse).
- 5.
Right testicular measurements with the split screen: longitudinal view on left and transverse view on the right of the screen (Fig. 16.8).

Fig. 16.8
Left testicular measurements (split screen images)
- 6.
Scrotal skin thickness measured (especially important if abnormal).
Split Screen (laterality is when looking at screen)
- 7.
EPIDIDYMIS #1: Epididymal caput (head), right and left side, split screen: right testis on left of screen and left testis on right of screen (Fig. 16.9).
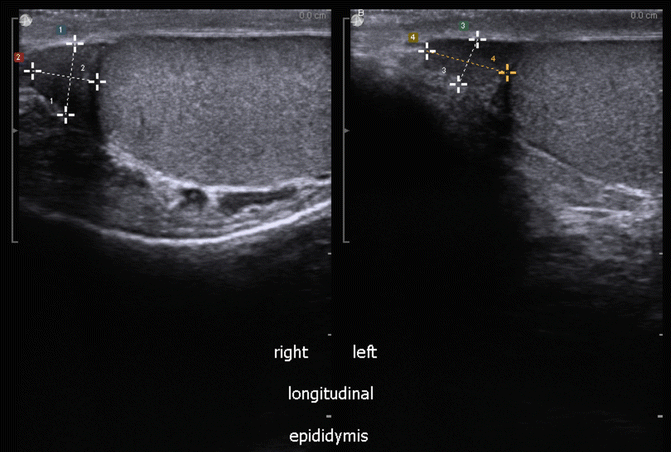
Fig. 16.9
Caput (head) of right and left epididymis (split screen images)
- 8.
EPIDIDYMIS #2: Epididymal corpus (body), right and left side, split screen: right epididymal body on left of screen and left epididymal body on right of screen (Fig. 16.10).
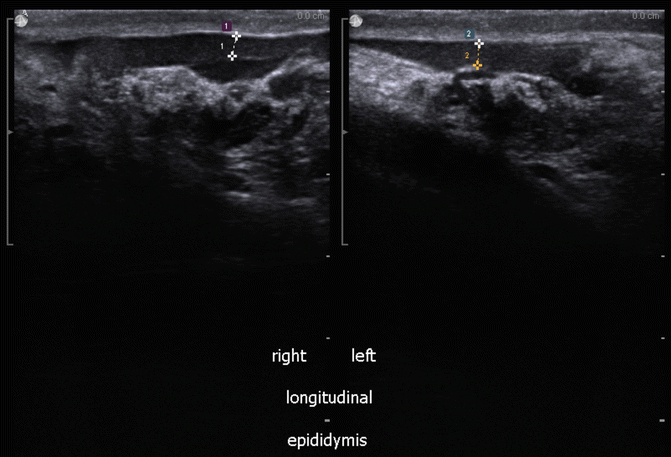
Fig. 16.10
Body of right and left epididymis (split screen images)
- 9.
EPIDIDYMIS #3 : Epididymal cauda (tail), right and left side, split screen: right epididymal body on left of screen and left epididymal body on right of screen (Fig. 16.11).
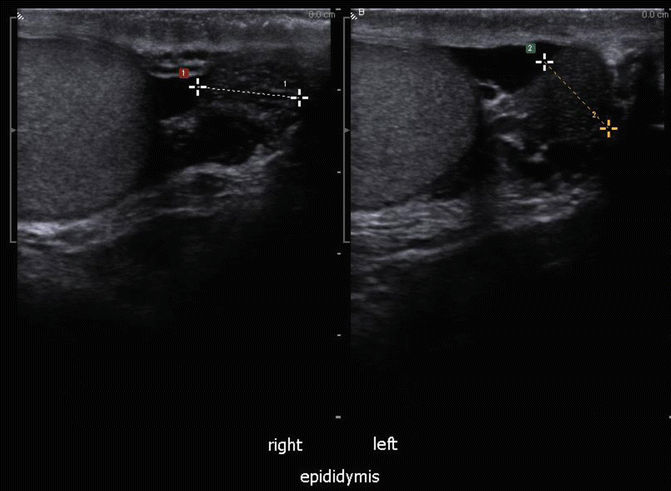
Fig. 16.11
Cauda (Tail) of right and left epididymis (split screen images)
- 10.
Lateral longitudinal view of the left and right testis: right testis on left of screen and left testis on right of screen (Fig. 16.12).

Fig. 16.12
Lateral longitudinal view of the left and right testis (split screen images)
- 11.
Medial longitudinal view of the left and right testis: right testis on left of screen and left testis on right of screen (Fig. 16.13).
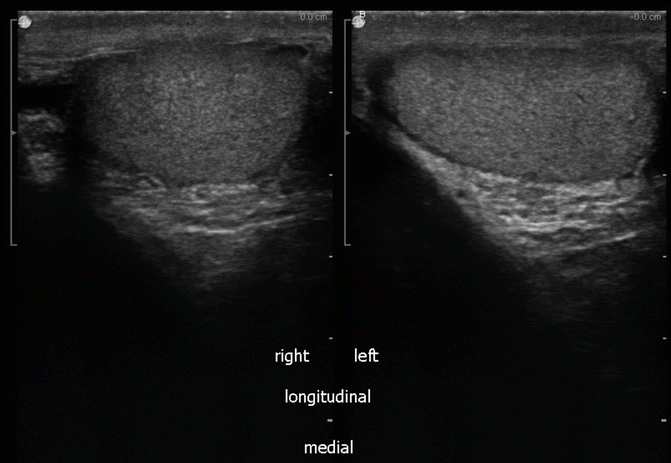
Fig. 16.13
Medial longitudinal view of the left and right testis (split screen images)
- 12.
Upper (superior pole) transverse view of the left and right testis: right testis on left of screen and left testis on right of screen (Fig. 16.14).
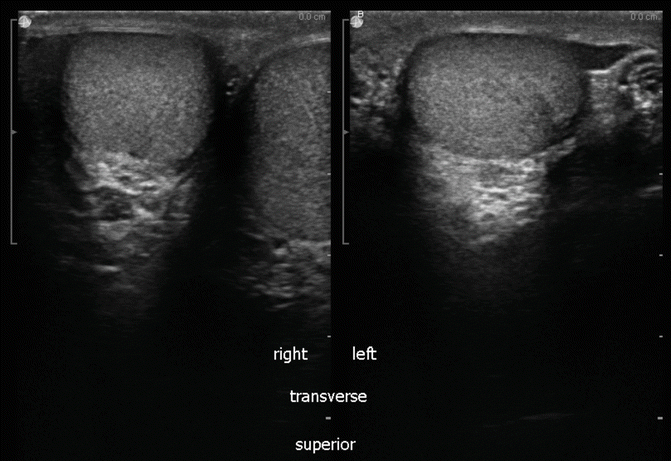
Fig. 16.14
Upper (superior) pole transverse view of the left and right testis (split screen images)
- 13.
Lower (inferior pole) transverse view of the left and right testis: right testis on left of screen and left testis on right of screen (Fig. 16.15).
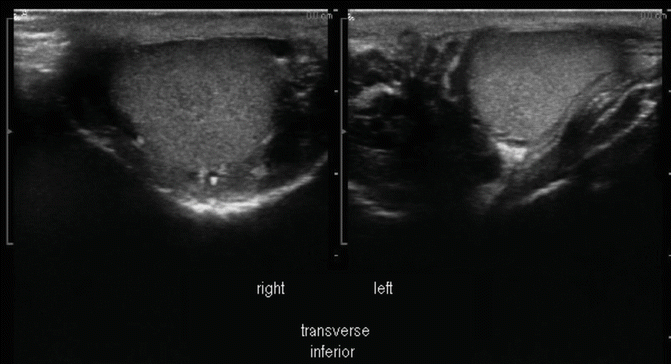
Fig. 16.15
Lower (inferior) pole transverse view of the left and right testis
Color Doppler
- 14.
Intratesticular blood flow pattern. Split screen of longitudinal view of both testes with the right testis on left of screen and left testis on right of screen. If a difference in flow pattern is noted this should be documented by obtaining an image and noting in report (Fig. 16.16).
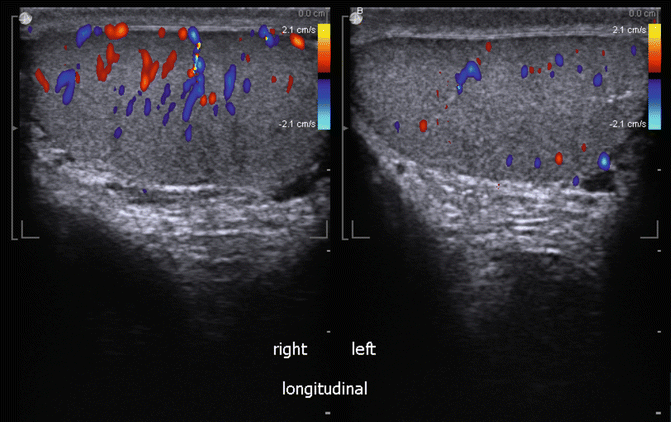
Fig. 16.16
Longitudinal view of Intratesticular blood flow pattern (split screen images)
- 15.
A single screen transverse view of both testes for comparative intratesticular blood flow (Fig. 16.17).
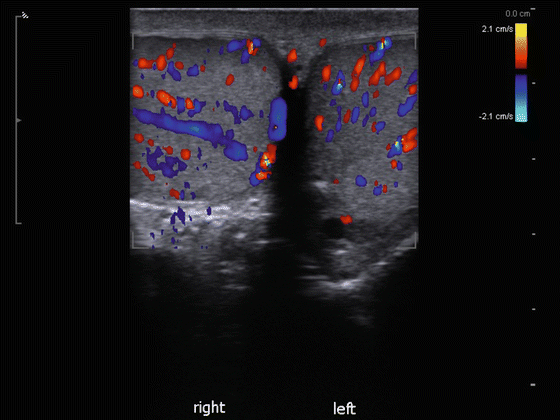
Fig. 16.17
Transverse view of Intratesticular blood flow pattern (split screen images)
- 16.
Varicocele evaluation #1. Longitudinal split screen of spermatochord superior to the testis with the right spermatochord on left of screen and left spermatochord on right of screen. Measurement of inner diameter of largest vein and width of entire complex (Fig. 16.18).
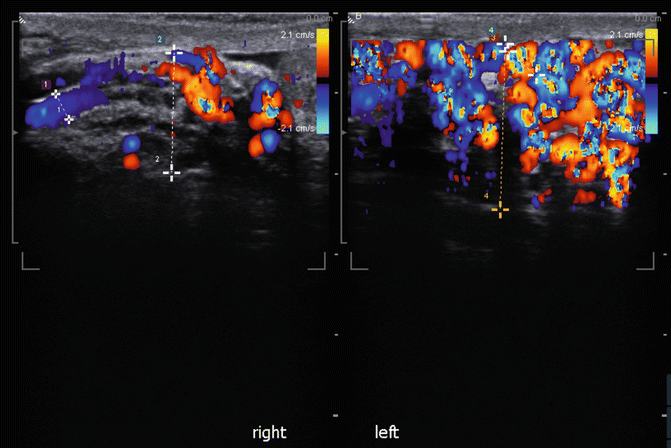
Fig. 16.18
Longitudinal view of spermatic cord for varicocele evaluation (split screen images)
- 17.
Varicocele evaluation #2. Longitudinal split screen of spermatochord posterior to the testis with the right spermatochord on left of screen and left spermatochord on right of screen. Measurement of inner diameter of largest vein and width of entire complex (Fig. 16.19).

Fig. 16.19
Transverse view of spermatic cord for varicocele evaluation (split screen images)
- 18.
Optional: Varicocele evaluation #3. Transverse split screen of spermatochord posterior to the testis with the right spermatochord on left of screen and left spermatochord on right of screen. Measurement of inner diameter of largest vein and width of entire complex (Fig. 16.20).
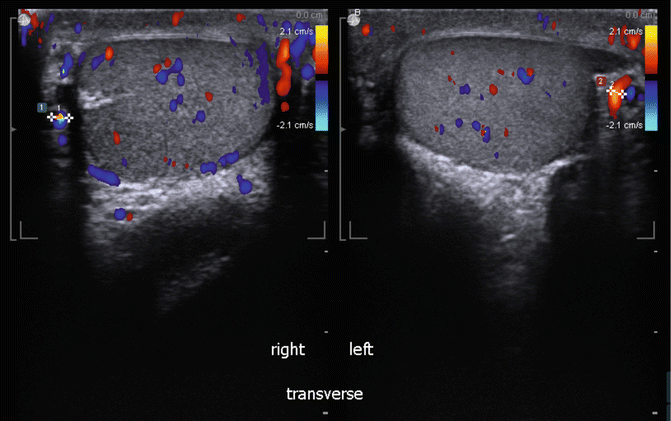
Fig. 16.20
Transverse view of Intratesticular blood flow pattern (split screen images)
Spectral Doppler
Get Clinical Tree app for offline access

- 19.
Evaluate a left intratesticular artery with psa, edv, ri and at (acceleration time) at the upper, upper, middle, and lower pole of the testis (Fig. 16.21).


