Aortic Valve
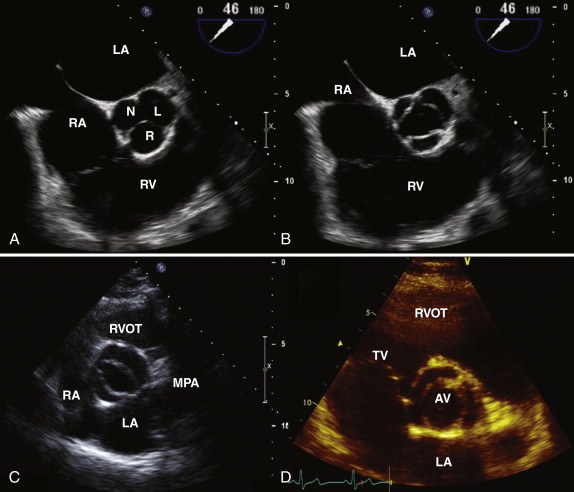
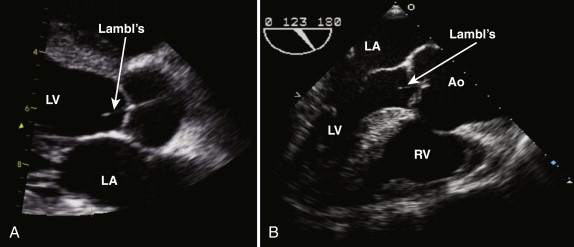
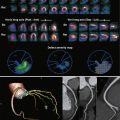
The normal aortic valve has three cusps: the right, left, and noncoronary cusps ( Fig. 34-1 , A and B ). A bicuspid aortic valve occurs in 2% of the population, and these patients tend to present earlier with aortic stenosis or aortic regurgitation. In the case of a bicuspid valve, the right and left cusps are most commonly fused, followed by fusion of the right and noncoronary cusps (see Fig. 34-1 , C ). Unicuspid or quadricuspid aortic valves are less commonly seen in clinical practice (see Fig. 34-1 , D ). Lambl excrescences, which are thin filamentous strands commonly seen on the ventricular surface of the aortic valve cusps, are important to recognize. These features are regarded as normal and are thought to result from degenerative change ( Fig. 34-2 ). These linear echodensities must be differentiated from abnormal masses such as vegetations and valve tumors.
Aortic Stenosis
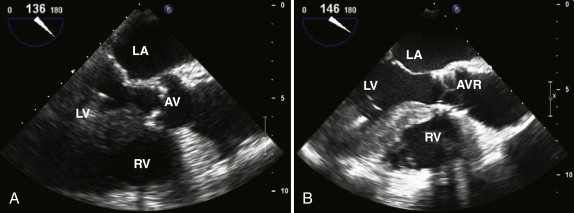
The common cause of aortic stenosis is age-related degenerative disease; 3% of patients who are more than 75 years old have severe stenosis. In the parasternal long-axis view, leaflet thickening and calcification may be seen. As the disease progresses, reduced excursion of the aortic valve leaflets in systole is observed ( Figs. 34-3 and 34-4, A ). The examiner must assess the morphology of the aortic valve in systole because a bicuspid valve with raphe may appear tricuspid during diastole, when the valve is closed. Rheumatic aortic valve disease is no longer a common cause of aortic stenosis in the West, but it remains an important cause worldwide. Aortic sclerosis is common in older patients and is associated with jet velocities of up to 2.5 m/second. The normal aortic valve area is 3 to 4 cm² ( Tables 34-1 and 34-2 ). As discussed in Chapter 1 :
Flow = CSA × Velocity
SV = CSA × VTI
| Mild | Moderate | Severe | |
|---|---|---|---|
| Jet velocity (m/sec) | 2.6-3.0 | 3-4 | >4 |
| Mean gradient (mm Hg) | <20 | 20-40 | >40 |
| Aortic valve area (cm²) | >1.5 | 1.0-1.5 | <1.0 |
| Problem | Solution |
|---|---|
| Underestimating peak velocity | Parallel orientation to beam required Peak velocity measured in several windows (apical, suprasternal, and right parasternal) to identify the highest Use of nonimaging continuous wave Doppler transducer in addition to standard imaging probe (higher signal-to-noise ratio) Averaging over several beats if irregular rhythm |
| Inaccurate aortic valve area | Careful measurement of left ventricular tract diameter required ∗ |
| Mistaking mitral regurgitant jet for aortic velocity | Careful Doppler interrogation required with attention to timing of signal |
| If ascending aorta <30 mm | Pressure recovery taken into account † |
| Significant difference in serial measurements | Aortic jet velocity verified to be from same window Left ventricular tract size checked because this rarely changes in adult patients |
∗ Small errors in the left ventricular tract diameter equate to significant errors in the calculated aortic valve area using the continuity equation because the radius of the left ventricular tract is squared.
† The conversion of potential energy to kinetic energy across a narrowed valve results in high velocity and a drop in pressure. Distal to the narrowed valve, flow decelerates. Some kinetic energy is reconverted into potential energy, with a resulting increase in pressure and a reduction in Doppler-derived gradient.
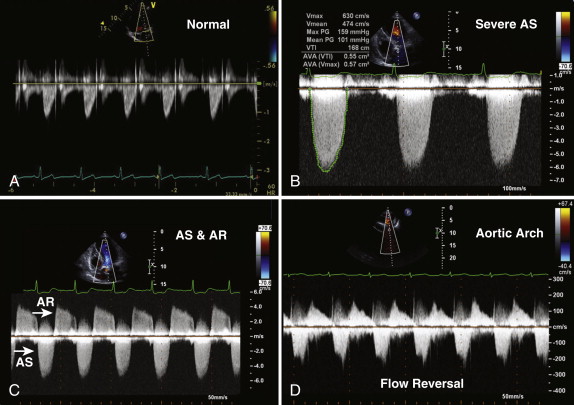
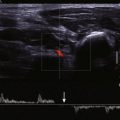
The continuity equation is based on the principle that the flow proximal and distal to a valve is equal, provided no intervening shunts are present. The continuity equation is routinely used to calculate aortic valve area in patients with aortic stenosis. To calculate the effective orifice area of the aortic valve, three measurements are required: (1) the left ventricular outflow tract (LVOT) diameter is measured in the parasternal long-axis view, in midsystole, from the septum to the anterior mitral leaflet, within 0.5 to 1.0 cm of the aortic valve; (2) in the apical, suprasternal, and right parasternal views, continuous wave Doppler across the aortic valve is obtained from which the peak velocity; and VTI may be calculated ( Fig. 34-5 , A and B ); the outer edge of the “envelope” is traced to provide both the VTI and mean gradient; and (3) pulsed wave Doppler in the LVOT is obtained, from which the peak velocity and VTI are derived. Using the following continuity equation, the aortic valve area can be calculated:
AVA = LVOT area × LVOT VTI Aortic valve VTI
Aortic regurgitation often coexists with aortic stenosis (≤80% of patients) and should also be quantified. Left ventricular hypertrophy is present in almost all patients with severe aortic stenosis and reflects concentric remodeling of the left ventricle in response to the pressure load. The examiner must assess left ventricular systolic function and look for evidence of poststenotic dilatation in the ascending aorta. The continuity equation remains accurate in the presence of both aortic regurgitation and left ventricular impairment. Pulmonary hypertension may be present in patients with aortic stenosis and increases operative risk.
Low-dose dobutamine stress echocardiography is useful in patients with low-flow, low-gradient aortic stenosis. These patients typically have an aortic valve area smaller than 1 cm², a left ventricular ejection fraction lower than 40%, and a mean gradient of 30 to 40 mm Hg. Current recommendations suggest infusing a low dose (2.5 to 5.0 mcg/kg/minute) of dobutamine and increasing it up to 20 mcg/kg/minute. This approach enables differentiation of aortic leaflets that cannot open because of stenosis from those that do not open because of reduced stroke volume. The test should be stopped in the following situations: (1) symptoms of chest pain, shortness of breath, or dizziness occur; (2) heart rate is faster than 100 beats/minute or increases by more than 20 beats/minute from baseline; (3) hypotension develops; or (4) arrhythmias occur. Severe stenosis is confirmed if the jet velocity increases to more than 4 m/second, the mean gradient is more than 40 mm Hg, and the aortic valve area is less than 1 cm². The absence of contractile reserve, demonstrated by a failure to increase the stroke volume or ejection fraction to more than 20%, is a predictor of high mortality and overall poor prognosis.
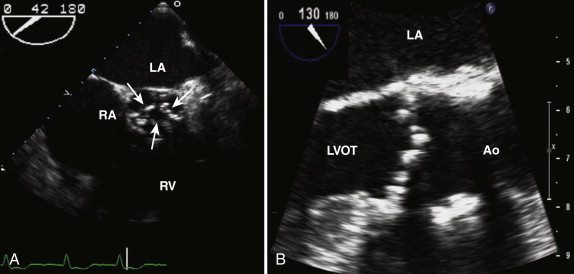
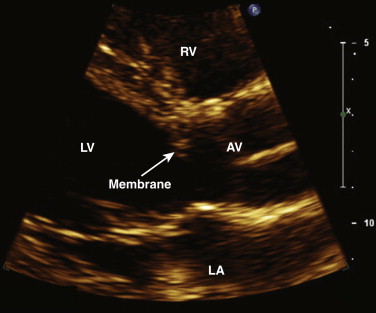
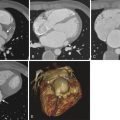
LVOT obstructive lesions occur in 6% of patients with congenital heart disease. Most of these lesions are valvular. Subvalvular stenosis may result from the presence of a fibrous membrane and is often associated with other congenital anomalies ( Fig. 34-6 ). It represents 10% to 14% of cases of congenital LVOT obstruction. Supravalvular stenosis is the least common form of LVOT obstruction and represents 8% to 14%. It is most commonly seen in children with Williams syndrome.
Aortic Regurgitation
Aortic regurgitation results from abnormalities of the aortic valve leaflets or the aorta. Trace aortic regurgitation is not regarded as physiologic and is observed in less than 1% of individuals less than 40 years old. Aortic regurgitation is associated with bicuspid valves, tricuspid valves with calcific degenerative change, rheumatic heart disease, myxomatous disease, and infective or noninfective endocarditis. Diseases affecting the aortic root and ascending aorta may also result in aortic regurgitation and include hypertension, aortic aneurysms, Marfan syndrome, aortic dissection, and inflammatory diseases. In chronic aortic regurgitation, the left ventricle is dilated as a result of chronic volume overload, whereas in acute aortic regurgitation, the left ventricle is usually normal in size. The most common causes of acute aortic regurgitation are endocarditis and aortic dissection.
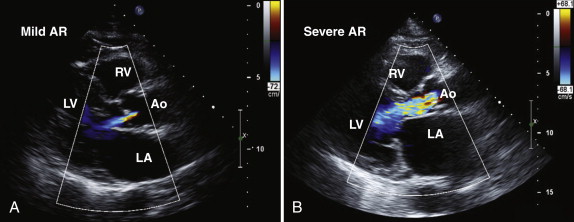
Assessment of the severity of aortic regurgitation tends to be more qualitative than quantitative in clinical practice, although several validated quantitative methods are available ( Table 34-3 ). In the parasternal long-axis view, the degree of aortic regurgitation is assessed using color flow Doppler ( Figs. 34-7 and 34-8 , A ). Color flow mapping is excellent for the detection of aortic regurgitation, with a sensitivity and specificity of 95% and almost 100%, respectively. The jet width in relation to the LVOT, rather than the length of the jet into the left ventricular cavity, allows assessment of severity. Severe aortic regurgitation is present when this jet width in the LVOT exceeds 65%. Eccentric jets, however, may be underestimated because the jet width may appear narrow and less significant. Furthermore, in patients with multiple jets, overestimating the severity of regurgitation is possible.
| Mild | Severe | |
|---|---|---|
| Central jet width in left ventricular outflow tract (%) | <25 | ≥65 |
| Vena contracta (cm) | <0.3 | >0.6 |
| Holodiastolic flow reversal in descending aorta | No | Yes |
| Pressure half-time (msec) | >500 | <200 |
The vena contracta is the narrowest portion of the jet at the level of the aortic valve and should be measured in the parasternal long-axis view. A vena contracta larger than 0.6 cm is associated with severe aortic regurgitation. Proximal isovelocity surface area (PISA) and effective regurgitant orifice area (EROA) may also be calculated, but these methods are more commonly used in the assessment of mitral regurgitation. When assessing aortic regurgitant jets, the examiner must be aware that parasternal views have a higher degree of axial resolution and are therefore preferable to apical views, which tend to make the jet appear larger as a result of beam spread.
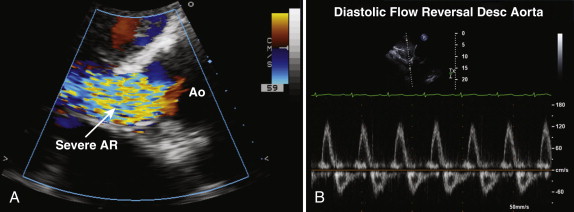
From apical views, a continuous wave Doppler recording across the aortic valve is obtained, and the signal density of the aortic regurgitation signal reflects the degree of regurgitation present (see Fig. 34-5 , C ). With increasing severity of aortic regurgitation, the aortic diastolic pressure falls rapidly. The pressure half-time is easily measured, and values lower than 200 msec reflect severe aortic regurgitation. The pressure half-time measurement is often the most useful marker of severity in acute aortic regurgitation because the left ventricular end-diastolic pressure rises quickly in the nondilated, less compliant left ventricle. Diastolic flow reversal in the descending aorta is easy to assess from suprasternal and subcostal views, by using pulsed wave Doppler, and can help confirm significant aortic regurgitation, if present. In severe aortic regurgitation, holodiastolic flow reversal may be seen in the descending aorta (see Fig. 34-8 , B ).
Mitral Valve
The mitral valve is a complex structure, consisting of anterior and posterior leaflets that are supported by a saddle-shaped annulus and subvalvular structures, namely, the chordae tendineae and the papillary muscles. By convention, each leaflet is divided into three portions, with A1 and P1 laterally and A3 and P3 medially. The normal mitral valve area is 4 to 5 cm². The posteromedial papillary muscle is supplied by the right coronary artery, whereas the anterolateral papillary muscle has a dual blood supply from the left anterior descending and circumflex coronary arteries. Consequently, the posteromedial papillary muscle is most susceptible to ischemic injury.
Mitral Stenosis
The most common cause of mitral stenosis is rheumatic disease. Other rarer causes include connective tissue disease, drug-induced disease, infiltrative disease, and congenital mitral stenosis. Echocardiography is an excellent noninvasive tool for confirming the presence of mitral stenosis, determining the severity of stenosis, and assessing the suitability for percutaneous valvuloplasty. Patients with a mitral valve area larger than 1.5 cm² do not usually report symptoms. Exercise stress echocardiography is useful for patients with a valve area smaller than 1.5 cm² who do not report symptoms to objectively assess symptoms, functional capacity, and right ventricular systolic pressure.
In rheumatic mitral stenosis, the classic appearance comprises reduced mobility and doming of the leaflet tips, resulting in a “hockey-stick” appearance ( Fig. 34-9 , A ). The leaflets may be thickened and calcified; however, commissural fusion is regarded as the hallmark of rheumatic mitral stenosis. The chordae tendineae may also be thickened, calcified, and restricted. The examiner must look for evidence of other valve disease, specifically involving the aortic or tricuspid valves. The left atrium is usually significantly dilated, and evidence of spontaneous echo contrast reflecting sluggish blood flow may be present. Patients with mitral stenosis commonly have pulmonary hypertension, and therefore the right ventricular systolic pressure should be estimated from the tricuspid regurgitation continuous wave Doppler signal. Right atrial pressure is estimated from the assessment of inferior vena cava size and inspiratory collapse. The presence or absence of mitral regurgitation is also relevant when mitral valvuloplasty is considered because moderate or more mitral regurgitation is a contraindication to percutaneous intervention.
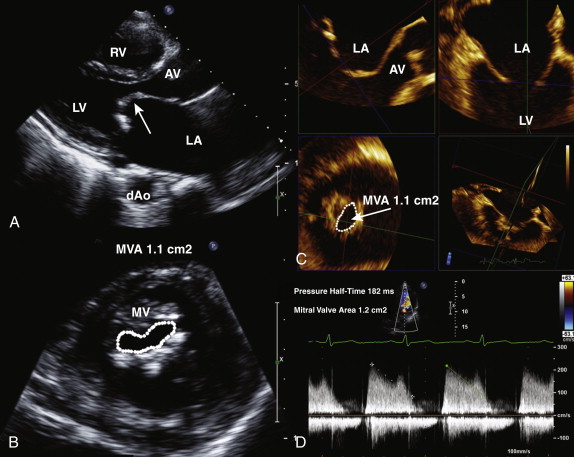
Assessment of Severity
Mitral valve area is calculated by direct planimetry using the parasternal short-axis view at the level of the mitral valve leaflet tips in mid-diastole (see Fig. 34-9 , B ). This measurement can be difficult if the valve is heavily calcified and may therefore not always be accurate. By using three-dimensional echocardiography, to the examiner can crop the image to obtain a true short-axis view, at the level of the mitral valve tips, increase the accuracy of the planimetered area (see Fig. 34-9 , C ). Alternatively, the mitral valve area can be derived from the pressure half-time, which is obtained by measuring the slope of the E wave. The mitral valve area is calculated as 220/pressure half-time and typically is automatically calculated by measurement software on the echocardiography machine or off-line work station (see Fig. 34-9 , D ).
MVA = 220 Pt 1 2
The peak and mean gradients are also obtained from the continuous wave Doppler mitral profile, but not from the pulse wave Doppler profile. The mean gradient is obtained by tracing the Doppler profile of the transmitral diastolic flow (see Fig. 34-9 , D ). The pressure gradient and pressure half-time measurements are accurate in the setting of normal atrial and ventricular compliance ( Table 34-4 ). In patients with severe aortic regurgitation, the pressure half-time is shortened, and this may result in an overestimate of mitral valve area ( Table 34-5 ).
Related posts:
Stay updated, free articles. Join our Telegram channel

Full access? Get Clinical Tree


