As an imaging modality, cardiovascular magnetic resonance (CMR) offers unrivaled versatility and freedom of anatomic access. In relation to heart valve disease, its relative strengths include the following:
- •
Depiction by cine imaging of valve movements and jet flow in planes, or stacks of planes, of any orientation.
- •
Measurement of right as well as left ventricular volumes and mass by multislice cine imaging.
- •
Measurement of volume flow and regurgitant fraction (pulmonary and aortic, at least) by phase contrast velocity mapping.
- •
Assessment of the context and consequences of heart valve disease using the wide fields of view, multiple image slices, and the versatility of tissue characterization available to magnetic resonance.
So although CMR is generally regarded as a second-line imaging modality after echocardiography for the assessment of heart valve disease, it can have important contributions to make toward decision making in regard to the timing and nature of surgical intervention, particularly in cases in which there have been inconclusive or conflicting findings, perhaps owing to inadequate echocardiographic access, or in which heart valve dysfunction is one aspect of more complex congenital or acquired pathology. And potentially, at least, CMR offers several possible methods for the measurement of valve regurgitation, although work is still needed to optimize and standardize acquisition protocols and to fully validate the techniques used.
If CMR is to become established as a reliable second-line modality, several potential weaknesses or pitfalls need to be recognized and avoided or corrected:
- •
The slice thickness (typically 6 mm) and the dimensions of voxels (typically about 6 × 1.5 × 1.2 mm 3 ) of cine and velocity map acquisitions need to be borne in mind.
- •
The images are not usually acquired in real time but are reconstructed from data gathered over several heart cycles during a breath-hold. For these reasons, valve leaflets are not always well seen, especially if there is arrhythmia; nor is CMR effective for visualizing the smaller, more mobile vegetations of endocarditis, although it can be useful for identifying an abscess or false aneurysm.
- •
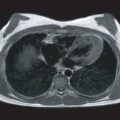
It is important to attempt to depict valve and jet structure by cine imaging in several planes and orientations, not just one; appearances and, potentially, interpretation can differ considerably between images of a particular valve acquired in different planes ( Fig. 30.1 ). Contiguous stacks of cine images are valuable for covering all parts of the mitral or tricuspid valves.

FIG. 30.1
Top left, A systolic frame of a steady-state free precession (SSFP) cine acquisition shows the bright core and dark edges of the jet through the slit-like orifice of a stenosed bicuspid aortic valve. Top right, A phase contrast velocity map, encoded through-plane, shows the dark jet, recording a peak velocity of 4.2 m/s. Bottom left, SSFP cine imaging aligned with the jet direction and orientated at right angles to the slit shows the narrower dimension of the jet, which appears bright and clearly delineated (arrow) . Bottom right, The jet appears broad, diffuse, and dark in the SSFP cine, which is aligned with the length of the slit, its voxels spanning the width of the narrow jet (arrows) .
- •
The accuracy of phase velocity mapping cannot be taken for granted. For jet velocity mapping, the dimensions of the voxels can be large in relation to the size and shape of a narrow or fragmented jet, leading to possible inaccuracies because of signal loss, partial volume averaging, and other artifacts. For the measurement of volume flow, particularly for the calculation of regurgitant fractions, surprisingly large inaccuracies have been found to occur as CMR systems have been “improved” to allow more rapid acquisition in the last 10 years, because of eddy currents and concomitant gradients. The severity of the problem can vary considerably according to the hardware and software that are used and can change between the upgrades of a system. The uncertainties do not end there, however. The sequence parameters and imaging plane that are needed have to be chosen appropriately relative to the characteristics of flow under investigation if artifacts are to be minimized.
- •
Measurements of biventricular volume and function are not necessarily as reliable and straightforward as has often been implied, particularly if there is arrhythmia or the right ventricle is structurally abnormal owing to congenital heart disease or previous surgery, and volume analysis remains time consuming and to some extent subjective. The methods of acquisition and analysis need to be specified appropriately for comparisons over time or between patients.
- •
In general, the unrivaled versatility of CMR is a strength, but it is also a challenge. There is an ongoing dilemma between continuing development on the one hand and standardization on the other.
With these cautionary remarks in mind, the aim of this chapter is to describe some important underlying principles and to guide users to the CMR techniques that we and others have found the most informative.
Stenotic and regurgitant lesions of each heart valve are considered later, and an overview of measures of the severity of valve dysfunction is given in Table 30.1 , which is adapted from the 2006 American College of Cardiology/American Heart Association Guidelines for the Management of Patients with Valvular Heart Disease. It is important to realize that right-sided valve lesions, particularly pulmonary or tricuspid regurgitation, differ from their counterparts on the left. Although echocardiography has become well established in the assessment of valvular lesions of the left heart, CMR, with phase velocity mapping, has particular strengths in relation to the assessment of valvular and perivalvular lesions of the right heart.
| Aortic Stenosis | |||
| Mild | Moderate | Severe | |
| Peak jet velocity (m/s) | <3 | 3–4 | >4 |
| Orifice area (cm 2 ) | >1.5 | 1.0–1.5 | <1.0 |
| Orifice area index (cm 2 /m 2 ) | <0.6 | ||
| Additional features | LV hypertrophy, poststenotic dilatation of the ascending aorta | ||
| Subaortic stenosis and coarctation should be considered and excluded. | |||
| Pulmonary Stenosis | |||
| Mild | Moderate | Severe | |
| Peak jet velocity (m/s) | <3 | 3–4 | >4.0 |
| Valve orifice area (cm 2 ) | <1.0 | ||
| Additional features | RV hypertrophy, poststenotic dilatation of the MPA and LPA | ||
| Subpulmonary and pulmonary artery stenosis should be excluded. | |||
| Mitral Stenosis | |||
| Mild | Moderate | Severe | |
| Peak jet velocity | <1.2 | 1.2–2.2 | >2.2 |
| Valve orifice area (cm 2 ) | >1.5 | 1–1.5 | <1.0 |
| Additional features | Possible evidence of pulmonary hypertension | ||
| Tricuspid Stenosis | |||
| Valve orifice area (cm 2 ) | <1.0 | ||
| Aortic Regurgitation | |||
| Mild | Moderate | Severe | |
| Regurgitant volume (mL/beat) | <30 | 30–60 | >60 |
| Regurgitant fraction | <30% | 30%–50% | >50% (CMR flow measurements tend to underestimate AR, unless corrected for aortic root motion) |
| Regurgitant orifice area (cm 2 ) | <0.1 | 0.1–0.3 | >0.3 |
| Pulmonary Regurgitation (Assuming Near Normal Pulmonary Resistance) | |||
| Mild | Moderate | “Free” or “Almost Free” (But May Be Well Tolerated) | |
| Regurgitant jet or stream width | Narrow, <2 mm | Moderate 2–5 mm | Unobstructed reversed stream, >6 mm across |
| Valve leaflet appearances | Mobile, coapting | Partly coapting | Ineffective leaflets with wide failure of coaptation |
| Regurgitant volume (mL/beat) | <30 | 30–40 | >40 |
| Regurgitant fraction | <25% | 20%–35% | >35%, but modified by up- and downstream factors |
| Additional features | Free PR occurs mainly in the first half of diastole, typically followed by late diastolic forward flow if the right ventricle is full and conduit-like when the atrium contracts | ||
| Mitral Regurgitation | |||
| Mild | Moderate | Severe | |
| Regurgitant jet width | Narrow, <1.0 mm | 1.0–2 mm | >2 mm, with extensive jet or swirling LA flow |
| No visible jet core | Narrow core | Bright jet core >2 mm width | |
| Regurgitant volume (mL/beat) | <30 | 30–60 | >60 |
| Regurgitant fraction | <30% | 30%–50% | >50% |
| Regurgitant orifice area (cm 2 ) | <0.2 | 0.2–0.4 | >0.4 |
| Additional features | Dilated left atrium and pulmonary veins | ||
| Systolic flow reversal in pulmonary veins | |||
| Tricuspid Regurgitation (Assuming Near-Normal Pulmonary Resistance) | |||
| Mild | Moderate | Severe | |
| Regurgitant jet width | Narrow, <2 mm | 2–6 mm | >6 × 6 mm, measured on a through-plane velocity map |
| Additional features | Dilated right atrium and caval veins | ||
Basic Principles
Slice Thickness and the Visualization of Thin Structures
The visualization by CMR of heart valves and flow through them is still done mainly by imaging in slices, and the thickness of a CMR slice, for example 6 mm, is generally considerably greater than that of pixel dimensions, which might be 1 to 1.6 mm. This means that the image is effectively made up of a layer of relatively long, narrow voxels, as shown in Fig. 30.2 . A thin structure such as a valve leaflet or narrow jet will be visualized more clearly if it is aligned parallel with the voxels rather than across the length of the voxels and will therefore be seen most clearly when the structure passes perpendicularly through plane of the image. This is one reason why valve leaflets are sometimes, but not always, visible in cine acquisitions. Awareness of this can help with the choice of imaging plane; for example, the leaflets of a closed mitral valve, particularly if it prolapses to the plane of the annulus or beyond, are likely to be seen clearly in certain long-axis but not the short-axis slices. And a flat jet through a slit-like orifice will be seen most clearly if the image plane cuts perpendicular to the line of the slit, although the jet will appear narrower in this orientation than if depicted, less clearly, in a plane aligned with the length of the slit (see Fig. 30.1 ).

Visualization and Planimetry of Jets by Cine Imaging
Stenosis or regurgitation of a diseased heart valve is associated with jet formation and consequent dissipation of energy through shear and turbulence. Appreciation of the structure of jet flow is fundamental to the interpretation of jet appearances on cine images. Jet flow is associated with an upstream region of convergence of streamlines where flow accelerates into the orifice; then, in most situations, there is a relatively stable, high-velocity jet core, typically extending two to three orifice diameters beyond the orifice and, lateral and distal to the core, a parajet region of shear and turbulence ( Fig. 30.3 ). The shear layer is the region with the most extreme spatial gradients of velocity, and this is where much of the turbulence of a jet originates and where there is likely to be most loss of signal in cine acquisitions and potential inaccuracies in phase velocity maps. It is the friction associated with shear and turbulence that dissipates fluid kinetic energy as heat, the fluid becoming less intensely turbulent as it loses kinetic energy and is swept downstream.

Each of the characteristic zones of a jet may be identifiable on cine images, but the appearances depend not only on jet shape and structure but also on the nature of the acquisition―the slice thickness, pixel dimensions and orientation, sequence design, and echo time ―and, importantly, on the location of the image slice relative to the jet. The relationships between flow features and the recovery of magnetic resonance signal are not straightforward. On the whole, coherent flow of the jet core is associated with local brightening of the signal on cine images. Acquisitions with longer echo times will be more subject to signal loss from regions of high shear and turbulence, whereas sequences with shorter echo times tend to be less susceptible to signal loss caused by turbulence.
Steady-state free precession (SSFP) imaging has become widely used in CMR because of the good contrast it gives between blood and adjacent tissues. Its properties also make it suitable for the delineation of jets, but appearances differ somewhat from those of gradient echo imaging. The echo times used for SSFP imaging are usually very short (e.g., 2 ms), thus minimizing signal loss because of the higher orders of motion associated with turbulence. But without velocity compensation, there is marked dephasing and consequent loss of signal in voxels that contain a wide range of velocities simultaneously, which means those that lie in the shear layer at the edge of a jet. SSFP sequences are also susceptible to slight inhomogeneities of the magnetic field, and there is more marked loss of signal in regions of flow disturbance if the magnetic field is slightly off shim. This can affect the appearance of flow in the vicinity of ferromagnetic prosthetic material such as that in the rings of mechanical heart valves. Under optimal conditions, however, typical appearances of a jet on SSFP imaging include a relatively bright jet core, clearly delineated on either side by dark lines that represent the shear layers (see Fig. 30.1 and Fig. 30.4 ). But this is the case only if there is a coherent core and the image plane is aligned with it. The same jet may appear dark, with no bright core, if the imaging plane is displaced slightly to one side, tangential to the shear layer. For this reason, careful alignment of planes, sequentially cross-cutting one cine acquisition with another and then another, is important in the assessment of heart valve disease by CMR. Each jet should be imaged in at least three planes (see Fig. 30.1 ), preferably six or more, before the operator can be reasonably confident that the size, shape, and functional significance of a jet have been adequately depicted.

Gradient recalled echo (GRE) cine imaging using segmented k -space, also known as fast low-angle shot (FLASH) imaging, is generally velocity compensated and less subject to signal loss in the shear layer than is SSFP imaging. For this reason, GRE cine imaging may be more suitable than SSFP for the direct measurements of orifice area by planimetry, as long as the echo time is sufficiently short for the high-velocity core of the jet, directed through the image plane, to appear bright. More work is needed to determine optimal imaging parameters and, if SSFP imaging is used, exactly where the jet should be outlined relative to the dark shear layer.
If planimetry is attempted, it is advisable to acquire a stack of slightly overlapping slices, shifting gradually from upstream to immediately downstream of the orifice in, say, 3-mm steps, to ensure that the minimum orifice/jet area is visualized. This approach is likely to be accurate only when the orifice is relatively simple in shape and the jet core is coherent. It is not likely to be accurate if the orifice is irregularly deformed or is a narrow slit, giving rise to a fragmented, splayed, or fan-like jet.
Phase Contrast Velocity Mapping
The principles of phase contrast velocity mapping are explained in Chapter 6 . In brief, one or more of the directional components of velocity are encoded in the phase of the signal in each voxel of the image for each phase of the cardiac cycle. Velocity can be encoded horizontally or vertically (in the X – or Y -direction) in the image plane, but more often, and generally more reliably, the through-plane Z -component is encoded, this being in the direction of the slice select gradient. As with Doppler flow measurement, phase contrast velocity mapping is represented by shifts of phase and so is subject to aliasing. To avoid this, an appropriate velocity-encoding range (Venc) should be chosen before acquiring velocity data in a particular cavity or vessel. An appropriate Venc exceeds the peak expected velocity by 20% to 50%, meaning that 180 degrees of phase contrast corresponds to 120% to 150% of the expected peak velocity. If the Venc is too low, set below the level of the peak velocity, the result is aliasing, in which case the acquisition should be repeated with the Venc increased appropriately. Too high a Venc, however, reduces the sensitivity of velocity mapping by reducing the amount of velocity-related phase shifts relative to background noise or other artifact-related phase shifts. Velocity mapping is used clinically for jet velocity measurements and for volume flow measurements. Each can be subject to artifacts, generally of distinct kinds in each case, and these can give misleading clinical results if they are not recognized and, if possible, corrected.
Jet Velocity Mapping for the Assessment of Stenoses
In jet flow, measurement of the peak velocity of the jet and the rates of change of the peak velocity through time or use of the velocity time integral may contribute to the assessment of the severity of stenosis or possibly regurgitation. Recovery of signal is a prerequisite for calculation of velocity, so it is necessary for voxels to lie sufficiently within the coherent core of a jet to measure its velocity accurately. If a jet is narrow and fragmented, this condition may be difficult to fulfill because there may not be a core of sufficient dimensions. Initial breath-hold cine acquisitions should be used, as described earlier, to decide whether it is worth trying to measure jet velocity by CMR. These, possibly followed by a preliminary in-plane breath-hold velocity map, can then be used to locate a through-plane breath-hold velocity map to measure the velocities of the core of the jet. Breath-hold sequences are recommended because their echo time will be short and so will minimize several potential artifacts, and any respiratory motion of the jet will also be avoided. What may be harder to avoid is movement of the valve related to cardiac motion. The plane chosen should therefore be located at the phase of peak flow, or, better still, a moving plane is located by using a motion-tracking method of acquisition, if available. In spite of these precautions, velocity maps, particularly of a narrow jet, may give misleading values. Of particular concern, voxels in shear layer at the edge of a jet are subject to signal loss and possible phase errors caused by abrupt deceleration. Apparent velocities of edge pixels should therefore be treated with suspicion if they differ from those in the core of the jet, and they may degrade attempts to measure volume flow at or downstream of a narrow orifice. These problems explain why CMR velocity mapping is generally less suitable than Doppler echocardiography for the assessment of right ventricular (RV) or pulmonary artery pressures by measurement of the velocities of relatively narrow tricuspid or pulmonary regurgitant jets.
In echocardiography, it became routine for jet velocity measurements to be converted to estimated differences of pressure, often referred to as gradients, in units (mm Hg) that were familiar from the use of catheterization. This conversion relies on assumptions that may not always be applicable (e.g., that all of the jet or stream reaches a uniform peak velocity and that virtually all of its kinetic energy is dissipated in turbulence). We recommend that peak velocities measured at specific locations, by either CMR or Doppler echocardiography, are quoted as such without conversion to presumed differences of pressure.
The velocity of a jet through an orifice is, of course, affected by the rate of flow as well as by the degree of narrowing, so a low rate of ejection, for example, because of ventricular dysfunction, will reduce the degree of elevation of velocity through a stenosed outflow valve.
Regurgitant Flow Measurements
Phase contrast velocity mapping is able to measure velocities in pixels throughout the plane of acquisition, which can be acquired in any chosen orientation. An advantage of this is that the volume of flow passing through an image plane can be calculated. This is done by multiplying the cross-sectional area of a vessel, for example, the aorta or pulmonary trunk, by the mean through-plane component of velocity in that area for each phase of the cardiac cycle, after delineating the area of the vessel in every frame of the acquisition. In this way, CMR is able to measure the volumes of forward or reversed flow in a large vessel. Furthermore, CMR velocity mapping is the only imaging technique that has the potential to acquire comprehensive information (i.e., three-dimensional [3D], three directionally encoded, time-resolved acquisition) and is well suited for studying spatial and temporal patterns of flow in the human cardiovascular system. This can be of interest where flow is multidirectional in cavities or in vessels that are curved or dilated, but measurement of one directional component of velocity is adequate for most clinical applications.
Through-plane flow measurements are subject to particular kinds of inaccuracy, however, especially when used for regurgitant or shunt flow rather than total flow measurements. Background phase offset errors can cause slight inaccuracies of velocity measurement across the whole field of view and through the whole cardiac cycle, typically increasing with distance from the center of the magnet. These errors have been identified as being mainly a result of concomitant Maxwell gradients, which can be calculated and corrected by using appropriate software, and to eddy currents in hardware components, which are harder to predict and eliminate. The result can be an upward or downward shift of the baseline of the flow curve, which can significantly affect the calculation of a regurgitant fraction. The amount of the shift of the flow curve depends not only on the underlying cause of the artifact but also on the Venc that is chosen (the higher the Venc, the greater the error), and on the cross-sectional area of the vessel measured (the larger the area, the greater the error). A further source of inaccuracy can be movement of the plane of a regurgitant valve itself relative to the plane of acquisition. Because such movements, for example, of the aortic valve in diastole or of the mitral valve in systole, displace a volume of blood in the direction opposite that of the regurgitant flow, they cause underestimation of the regurgitation measured, the error increasing with the amount of valve movement and the cross section of the flow area measured. It is an error that can be overcome by appropriately implemented motion tracking, although this is not yet available on most systems. Both manufacturers and users need to be aware of these potential sources of inaccuracy and work together toward the optimization of systems and sequences.
Fourier Cardiovascular Magnetic Resonance Velocity Traces
Another type of velocity acquisition that is worth mentioning, although not widely implemented, is CMR Fourier velocity mapping. In this technique, the spatial phase-encoding gradient pulses are replaced by velocity phase-encoding bipolar gradient waveforms. The resulting dataset has only a single spatial dimension (in the readout direction) and measures one component of velocity in the direction of velocity-encoding gradient. Like M-mode Doppler, this approach could be adapted to real-time acquisition and display of the time course of flow through a particular valve or orifice ( Fig. 30.5 ). Arguably, it should be made available for routine CMR investigation―for example, to assist in the evaluation of congenital and valvular heart diseases as well in the diagnosis of constrictive pericardial disease and diastolic ventricular dysfunction―although the technique has yet to be optimized and proven in a wide spectrum of clinical use.

Stenotic Heart Valve and Outflow Tract Lesions
Aortic Valve Stenosis
Stenosis at the level of the aortic valve can be a result of congenital malformation of the valve, rheumatic heart disease or degenerative disease in older patients. On the whole, echocardiographic assessment is reliable, but CMR may be called upon when there is limited echocardiographic access, when there are conflicting findings, in complex disease with stenosis at more than one level, or for the assessment of left ventricular (LV) volume and mass. Ranges of measurements reflecting different severities of aortic stenosis (AS) and other valve lesions are shown in Table 30.1 .
Several publications on CMR quantification of AS have used planimetry of the orifice, or rather the jet, to make direct estimates of orifice area. The results seem to have been encouraging, although the spatial resolution, meaning slice thickness as well as pixel dimensions, of cine acquisitions may not be adequate when it comes to the delineation of narrow, splayed, or fragmented jets. In our experience, there is a proportion of orifices and jets that cannot be adequately defined by CMR planimetry.
By echocardiography, direct planimetry on two-dimensional (2D) images, peak stenotic jet velocity and mean jet velocity are possible approaches to the assessment of the severity of stenosis, although planimetry may be unsatisfactory in calcified or deformed valves, and simple jet velocities depend on flow rate as well as stenotic severity. Probably the most widely accepted echocardiographic approach uses the continuity equation to calculate the area of the valve orifice. Using this, the volume flow through the left ventricular outflow tract (LVOT) is calculated by multiplying the LVOT velocity time integral (VTI) by the LVOT cross-sectional area (typically calculated echocardiographically from its diameter) to give outflow volume, then dividing this volume by the VTI of the jet at the stenosis, which gives a measurement representing the stenotic valve area. Comparable approaches using CMR measurements have been described.
A stenosed bicuspid aortic valve generally has a slit-like orifice (see Fig. 30.1 ), whereas degenerate or calcified valves can have irregular or three-pointed orifices, and the considerations described earlier regarding jet shape and the locations of image slices are important. Cine imaging should aim to depict the jet in several orientations, which also help to determine the best strategy for jet velocity mapping and planimetry of the valve. Both of these should be attempted; unfortunately, each is less likely to be accurate if the orifice is small and irregular and the jet is fragmented.
For direct planimetry of the valve orifice, high-resolution breath-hold FLASH or SSFP imaging in a stack of about five slices, shifting 3 mm at a time from immediately upstream to just downstream of the orifice, should be acquired. The best cine, which is probably the one that shows the smallest, most clearly delineated cross section of the jet, should then be used for direct planimetry. The jet velocity and orifice area might not be accurately measurable in severe stenosis or when the jet is fragmented. Multiple in-plane cine views together with assessment of the impact of the lesion of ventricular mass and function are particularly important in such cases and, in combination, should make the severity of the stenosis apparent.
Cine imaging should show the location and direction of the jet core, and the orientation of the slit, if applicable. In-plane breath-hold velocity mapping with the direction of velocity encoding aligned with that of the jet can be helpful to visualize the jet, but it is likely to underestimate peak velocity if the jet is narrow. The above acquisitions should then be used to align a velocity-mapping slice to transect the jet core, with velocity of an appropriate range (Venc) encoded through the image plane. The velocity of the jet should be analyzed with caution in the resulting image, particularly if the stenosis is severe. Signal loss can allow background noise or other artifacts to contribute spurious phase shifts, particularly in the shear region at the edge of a jet, so peak jet velocity should be measured in a region of good signal recovery within the core of the jet.
Emerging Role of Cardiovascular Magnetic Resonance for Selecting Anatomically Suitable Patients for Transcatheter Aortic Valve Implantation
Transcatheter aortic valve implantation (TAVI) is an effective alternative to surgical aortic valve replacement in patients with high surgical risk or who are inoperable. Cardiac imaging plays an essential role for assessment of severity of aortic calve stenosis and for selecting anatomically suitable patients for this procedure. A number of imaging modalities are often used for this purpose, including echocardiography, cardiac computed tomography (CCT) and CMR. Each imaging method has its advantages and limitations. The use of CMR in patients undergoing, or being considered for, TAVI is likely to expand. CMR provides several important pieces of structural information before consideration for TAVI; in addition to accurate quantification of ventricular volumes and function, aortic valve planimetry can be performed to accurately determine valve area, and late gadolinium enhancement (LGE) can show areas of myocardial scarring post TAVI. Furthermore, work from our institution has shown that CMR can provide accurate aortic annulus measurements that, in terms of predicting the presence and severity of aortic regurgitation (AR) after TAVI, are comparable with those obtained using CT ( Figs. 30.6 and 30.7 ). Also, in cases where CT angiography is not available or is deemed inappropriate, magnetic resonance angiography (MRA) of the peripheral vasculature can be performed to assess access routes ( Fig. 30.8 ). Following TAVI, CMR can be used to provide an accurate estimate of ventricular function, and a recent publication has also shown the accuracy of CMR to detect and quantify paravalvular leak. Ultimately, however, unless any postprocedural CMR-specific measurements can be shown to lead to treatment changes affecting prognosis, it will remain highly debatable whether it is worth the time and expense to perform CMR on a routine basis after TAVI; echocardiography may be sufficient for the majority of cases. But in the longer term, a role may arise for percutaneous valve interventions such as TAVI to be completely MRI guided; real-time transarterial implantation of the Medtronic CoreValve (using a modified, MRI-compatible delivery device) has already been described in a swine model.

Related posts:
 Use of Navigator Echoes in Cardiovascular Magnetic Resonance and Factors Affecting Their Implementation
 Clinical Cardiovascular Magnetic Resonance Imaging Techniques
 Atherosclerotic Plaque Imaging: Aorta and Carotid
 Cardiac Iron Loading and Myocardial T2*
 Pulmonary Vein and Left Atrial Imaging
 Noncardiac Pathology
Stay updated, free articles. Join our Telegram channel

Full access? Get Clinical Tree


