Venous thromboembolism is one of the most common cardiovascular diseases. It comprises two clinical disease entities: deep vein thrombosis, usually in the legs, and pulmonary embolism, with the latter having a more severe course for the patient. The spectrum of clinical manifestations ranges from lethal circulatory collapse to asymptomatic incidental findings. Several predisposing factors increase the risk of venous thromboembolism, e.g., major trauma, surgery, fractures of the lower limbs, spinal injuries, and malignant tumors. For younger women, the main risk factor is oral contraception.
The typical symptoms of pulmonary embolism include dyspnea of sudden onset, pleuritic chest pain, or retrosternal pain as well as cough. Hemoptysis, fever, or syncope occurs less commonly. In one-quarter of cases, signs of deep vein thrombosis of the leg can also be detected. Hypoxemia in arterial blood gas analysis is suggestive of pulmonary embolism, but it is seen only in around half of cases. Oligosymptomatic or asymptomatic pulmonary embolism is not uncommon.
The pathophysiologic mechanism of pulmonary embolism is generally based on impaired right heart function due to an increased right ventricular afterload. The resultant dilation of the right ventricle causes tricuspid valve insufficiency. At the same time, the rising wall tension of the right ventricular muscle cells activates neurohormones, triggering a myocardial inflammatory reaction. The resultant increase in myocardial oxygen demand leads to myocardial ischemia which, in turn, reduces heart muscle contractility. The now reduced right ventricular stroke volume decreases the left ventricular preload. The left ventricular blood volume drops, causing a lowered systemic blood pressure. Declining coronary perfusion exacerbates right ventricular ischemia. The interaction of these pathophysiologic processes culminates in cardiogenic shock and death.1
Table 14.1 Diagnostic and therapeutic strategy relative to the early mortality risk1
a Systolic blood pressure below 90 mm Hg or drop of at least 40 mm Hg for at least 15 min if this was not caused by new onset arrhythmia, hypovolemia, or sepsis.
The choice of treatment is based on the early mortality risk. Two strategies are available: an aggressive approach with thrombolysis (interventional thrombus fragmentation) or a less aggressive one with thromboendarterectomy and anticoagulation treatment. The former is associated with a higher complication rate, in particular bleedings. A simple initial risk stratification determines the adequate diagnostic and therapeutic strategy (▶Table 14.1).1,2
The widely used score systems illustrated in ▶Table 14.2 and ▶Table 14.3 have only moderate discriminatory power for assessment of the clinical probability of pulmonary embolism. Two-thirds of all patients with a score consistent with a high clinical probability do indeed have a pulmonary embolism. However, 10% of patients with a low probability are also revealed to have an embolism. D-dimer testing considerably increases the discriminatory power of the diagnostic algorithm for patients with a low or intermediate probability. Therefore, before resorting to computed tomography pulmonary angiography (CTPA), this laboratory parameter is measured for hemodynamically stable patients who do not have a high probability of pulmonary embolism.
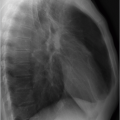
Chest radiography no longer plays any role in diagnostic imaging of suspected pulmonary embolism. Radiography is unable to directly visualize the embolism, relying instead on indirect findings: platelike atelectasis, pleural-based consolidations consistent with pulmonary infarction (so-called Hampton hump), pleural effusion, oligemia (Westermark sign), prominent central pulmonary arteries, or a high-riding diaphragm.7
CTPA has now supplanted the formerly common ventilation/perfusion (VQ) scan and is currently the imaging modality of choice in settings of clinically suspected pulmonary embolism. On CTPA, the embolism is directly visualized as an intravascular contrast filling defect (▶Fig. 14.1). Already a large-scale study conducted quite some time ago predominantly with four-row CT scanners demonstrated a high accuracy for that technique, with a sensitivity of 83% and specificity of 96%.8 More modern CT scanners will undoubtedly have higher sensitivity.
Table 14.2 Clinical Wells score for assessment of clinical probability of pulmonary embolism1
Previous pulmonary embolism or deep vein thrombosis
1.5
1
Heart rate ≥ 100/min
1.5
1
Surgery or immobilization within the past 4 weeks
1.5
1
Hemoptysis
1
1
Active cancer
1
1
Clinical signs of deep vein thrombosis
3
1
Alternative diagnosis less likely than pulmonary embolism
3
1
Clinical probability
Three-level score:
• Low probability
0-1
• Intermediate probability
2-6
• High probability
≥ 7
Two-level score:
• Pulmonary embolism unlikely
0-4
0-1
• Pulmonary embolism likely
≥ 5
≥ 2
Fig. 14.1 Acute pulmonary embolism.CT image. Contrast filling defects in the central pulmonary arteries (arrows).
Furthermore, CT provides additional information. An enlarged right ventricle indicates right heart strain of prognostic relevance. To that effect, the cross-sectional diameter (short axis) of the right (RV) and left ventricle (LV) is measured on the axial CT image; an RV/LV quotient >1 attests to right heart strain.9,10,11 Various parameters have been proposed for assessment of right heart strain or estimation of prognosis, e.g., several score systems for determination of the thromboembolic burden or measurement of the pulmonary artery diameter, its ratio to the aortic diameter, and protrusion of the ventricular septum toward the left heart. The validity of all these values is disputed and they are probably of no prognostic relevance.10
Table 14.3 Revised Geneva score for assessment of clinical probability of pulmonary embolism1
Previous pulmonary embolism or deep vein thrombosis
3
1
Heart rate:
• 75-94/min
3
1
• > 95/min
5
2
Surgery or fracture within the past month
2
1
Hemoptysis
2
1
Active cancer
2
1
Unilateral lower limb pain
3
1
Pain on lower limb deep venous palpation and unilateral edema
4
1
Age > 65 years
1
1
Clinical probability
Three-level score:
• Low probability
0-3
0-1
• Intermediate probability
4-10
2-4
• High probability
≥ 11
≥ 5
Two-level score:
• Pulmonary embolism unlikely
0-5
0-2
• Pulmonary embolism likely
≥ 6
≥ 3
Dilation of the superior vena cava or azygos vein is suggestive of congestive right heart failure, which has a poor prognosis.10,12IV contrast reflux into the hepatic veins is an indirect sign of tricuspid valve insufficiency. However, there is no proof of correlation with the severity of pulmonary embolism.13
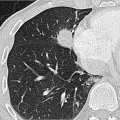
Triangular pleural-based consolidations or ground-glass opacities (▶Fig. 14.2) are consistent with pulmonary infarction and can occasionally be identified in patients with pulmonary embolism.
Clinical management of pulmonary embolism has to contend with two challenging constellations:
Isolated subsegmental pulmonary embolism: Exclusively subsegmental localization is seen on CTPA in up to10% of all pulmonary embolisms.14 Such findings have a low positive predictive value and high interobserver variability.15 Their clinical significance depends on the extent of embolism (solitary or multiple emboli) and the underlying comorbidities. Adjunctive compression sonography of the leg veins is advisable to rule out deep vein thrombosis of the leg requiring treatment. In the event of negative compression sonography in settings of isolated subsegmental pulmonary embolism, the need for anticoagulant therapy should be considered in individual cases. To that end, the clinical probability of pulmonary embolism and the existing cardiopulmonary reserve must be weighed up against the treatment-induced bleeding risk.1,15
Fig. 14.2 Pulmonary infarction secondary to acute pulmonary embolism.CT images. (a) Pulmonary infarction: pleural-based consolidation and ground-glass opacity in the right apical upper lobe segment. (b) Underlying pulmonary embolism in the right upper lobe artery (arrow).
Asymptomatic pulmonary embolism: Another problem emanates from completely asymptomatic pulmonary embolism incidentally identified in 1 to 2% of all CT scans.16,17,18,19,20 Anticoagulant treatment is recommended at least for patients with a malignant tumor and central pulmonary embolism.1,21 Study data increasingly suspect overdiagnosis of pulmonary embolism with widespread use of CTPA.1,22,23,24,25
Deep vein thrombosis (DVT) of the leg is the most common cause of pulmonary embolism. CT venography and compression sonography are diagnostically equivalent for detection of DVT.26 However, preference should be given in principle to compression sonography since CT venography involves considerable radiation exposure for the patient.1 But an exception should be made for patients whose cases are known in advance to provide insufficient ultrasound examination conditions. In such cases, CT venography can be performed at the same time as CTPA to exclude DVT.
Fig. 14.3 Acute pulmonary embolism.DECT, coronal. On the iodine map (color depiction) bilateral wedge-shaped perfusion defects (blue). Same patient as in ▶Fig. 14.1.
Dual-energy CT (DECT) and MRI are able to directly visualize embolism-related defects in lung perfusion.27 If CTPA is carried out as DECT, iodine maps can be generated from the CT dataset. These show the contrast distribution within the lung parenchyma and will thus demonstrate perfusion defects (▶Fig. 14.3) and provide additional information on the vascular architecture.28 Not all embolisms identified on CTPA are associated with a perfusion defect. The converse applies to a lesser degree, i.e., it is not possible on CTPA to find a correlate for every perfusion defect. The clinical significance of this additional information is still unclear but extensive perfusion defects are possibly associated with a poor prognosis.29
Simultaneously, DECT spectral imaging can enhance the vascular contrast in the pulmonary arteries. A lower virtual kV setting thus helps increase diagnostic reliability and allows for use of lower concentrated IV contrast media, if necessary.30 At times, there may be inadequate contrast enhancement of the pulmonary arteries because of a Valsalva maneuver during the CT scan (transient interruption of contrast phenomenon31). Retrospective increase of vascular contrast by lowering the virtual kV setting may be helpful in such cases.
Only gold members can continue reading. Log In or Register to continue