(12.1)
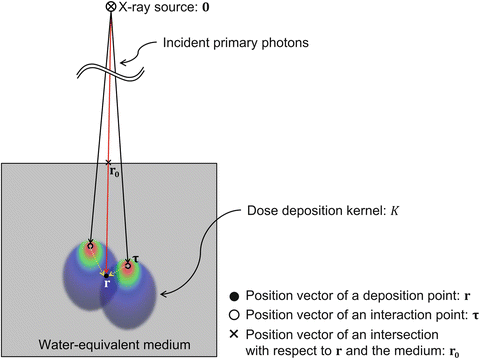
where r is the three-dimensional (3D) position vector, D is the dose, T is the total energy released per unit mass (TERMA), and K is the dose deposition kernel (DDK). τ is the position vector of an interaction point (described later). The dose distributions are calculated by convolving the DDK with the TERMA for all positions.

Fig. 12.1
A conceptual illustration of a dose calculation using a pencil beam convolution (PBC) method
The TERMA is the total released radiant energy per unit mass that results from interactions of the primary photons with the medium (Ahnesjö et al. 1987; Ahnesjö 1989). The TERMA at a position is calculated by using the following equation:

where E is the energy (often measured in mega-electron volts (MeV)), Φ is the fluence (MeV−1∙m−2), and (μ/ρ) is the mass attenuation coefficient (m2∙kg−1). The TERMA at any arbitrary position, r for the PBC method can be described by

where 0 is the position vector of the linac source (origin), μ w is the linear attenuation coefficient of the water (m−1), W is the water-equivalent path length (WEPL) (m), and (μ/ρ) w is the mass attenuation coefficient of the water (m2∙kg−1). 1/‖r‖2 is a correction term for beam divergence (Ahnesjö 1989). Equation (12.3) is rewritten by

where

r 0 is the position vector of an intersection with respect to r and the body or phantom surface (Mackie et al. 1985; Boyer and Mok 1985, 1986; Mohan et al. 1986; Ahnesjö et al. 1987; Ahnesjö 1989; Battista and Sharpe 1992; Papanikolaou et al. 1993; Sharpe and Battista 1993). The WEPL at each position can be calculated by using the following equation:

where ρ e,re (r i ) is the relative electron density at the ith sampling position vector r i and d r is the sampling interval on a ray (Seco and Evans 2006). The TERMA distributions within the irradiation field are calculated from the WEPL distributions, the energy spectrum of the fluence, and the mass attenuation coefficients of the water by using Eq. (12.6).

(12.2)

(12.3)

(12.4)

(12.5)

(12.6)
Figure 12.2 shows a diagram chart for calculating the TERMA distributions. The planning CT images are converted into relative electron density maps between the medium and the water using a conversion curve between Hounsfield unit (HU) and the relative electron density between the medium and the water. The electron density of a medium, ρ e, med , can be calculated by

where N A is the Avogadro constant (mol−1), Z med is the atomic number of a medium, A med is the atomic weight of the medium (kg∙mol−1), and ρ med is the mass density of the medium (kg∙m−3) (Seco and Evans 2006; Yang et al. 2008). According to the PBC method, the relative electron density of the medium to the water is required for calculating the WEPL distributions. In particular, the relative electron density of the medium to the water, ρ e,re , can be calculated by

where ρ e ,water is the electron density of the water (Seco and Evans 2006; Yang et al. 2008). Figure 12.3 shows an example of the conversion curve between HU and the relative electron density. It is worth noting that the conversion curve should be produced and calibrated using an electron density phantom in each institution because the HU depends on X-ray spectra produced by CT scanners. The WEPLs for all positions within the irradiation field are calculated based on an electron density scaling method (Seco and Evans 2006).


(12.7)

(12.8)

Fig. 12.2
A diagram chart for calculating total energy released per unit mass (TERMA) distributions

Fig. 12.3
An example of a conversion curve between Hounsfield unit (HU) and the relative electron density between the medium and the water
The X-ray spectra depend on the linacs and accelerating voltages. Since it could be very difficult to measure the high-energy X-ray spectra, the spectra should be estimated by using Monte Carlo simulations so that the estimated percent depth dose (PDD) curves can be similar to the measured PDD curves. Mohan et al. (1985) calculated the energy spectra of the fluence for each voltage in the range of 4–24 MV using Monte Carlo simulations. Sheikh-Bagheri and Rogers (2002) also modeled the energy spectra of the fluence for each voltage in the range of 4–25 MV for a variety of manufacturers (Varian, Elekta, and Siemens) using Monte Carlo simulations. Figure 12.4 shows the relative fluence spectra of the X-rays estimated by using Monte Carlo simulations for 4, 6, and 10 MV in a linac manufactured by Varian derived from the original data of Sheikh-Bagheri and Rogers (2002).


Fig. 12.4
Relative fluence spectra of X-rays estimated by using Monte Carlo simulations for 4, 6, and 10 MV in a linac manufactured by Varian derived from the original data of Sheikh-Bagheri and Rogers (2002)
According to the PBC method, the DDK is required in order to calculate the energy deposited by scattered photons. The DDK describes the spatial distribution of total released energy from the interaction point in the water (Mackie et al. 1985, 1988; Boyer and Mok 1985; Mohan et al. 1986; Ahnesjö et al. 1987; Ahnesjö 1989; Battista and Sharpe 1992; Sharpe and Battista 1993). Ahnesjö (1989) modeled the DDK using Monte Carlo simulations based on the following equation:

where the following equation holds:

where τ is the position vector of the interaction point, θ is the scattering angle between τ and r − τ (Fig. 12.5), A θ and a θ are parameters of the energy deposited by primary photons, and B θ and b θ are parameters of the energy deposited by scattered photons (Ahnesjö 1989).


(12.9)

(12.10)

Fig. 12.5
The geometry used for calculating the dose deposition kernel (DDK)
These parameters for 4–24 MV were provided in Ahnesjö’s (1989) paper. We produced the DDKs as image data based on Ahnesjö’s (1989) paper. Figure 12.6 shows DDKs for 4, 6, and 10 MV based on Ahnesjö’s (1989) model. The lateral scattering decreases as the voltages of the linac increase. In addition, the forward scattering increases, and the shape of the DDKs becomes narrow for high voltages.


Fig. 12.6
Dose deposition kernels (DDKs) for 4, 6, and 10 MV based on an Ahnesjö’s model
12.2.2 Convolution/Superposition Method
According to the PBC method, the heterogeneity of tissues in the directions of primary photons can be calculated using the WEPLs for all points based on the electron density scaling method. However, the heterogeneity of tissues in the other directions can be ignored because of the fact that the homogeneity DDKs in the water, as expressed by Eqs. (12.9) and (12.10), are convolved in Eq. (12.1). Therefore, according to the convolution/superposition method, the DDK is modeled by considering the heterogeneity based on the electron density scaling method (Sharpe and Battista 1993; McNutt et al. 1996a, b; Liu et al. 1997). Figure 12.7 shows an illustration of the dose calculation differences between the PBC and convolution/superposition methods. The basic concept used in calculating the dose distributions for the convolution/superposition method is equal to that of the PBC method, except the modeling of the DDK. More specifically, the DDK used in the convolution/superposition method can be expressed by

where


(12.11)

(12.12)

Fig. 12.7
An illustration of the dose calculation differences between the pencil beam convolution (PBC) method and the convolution/superposition method
In order to model the DDK in the convolution/superposition method, the WEPL between the interaction point and the deposition point is required (instead of the physical distance); that is because the heterogeneity (i.e., variation in the relative electron density) must be considered. Although the dose distributions calculated by considering the heterogeneity in all directions are more accurate (as compared to the PBC method), it should be noted that the dose calculation is time-consuming because of the fact that the DDK must be modeled for each point.
12.3 Estimation of Delivered Dose Distributions Based on Electronic Portal Imaging Device Images
Electronic portal imaging device (EPID) images are taken before the actual dose delivery in order to verify whether the patients are appropriately positioned on a treatment couch in the radiation therapy based on the treatment plan. More specifically, these images are compared with digitally reconstructed radiograph (DRR) images that are derived from planning CT images. Since the EPID detector can also acquire dynamic portal images acquired using therapeutic beams during treatment delivery, tumor motions can be monitored on the EPID during the treatment delivery.
Certain studies have estimated 2D dose distributions on the EPID detector plane based on the portal images (Heijmen et al. 1995; Pasma et al. 1998; de Boer et al. 2000; Greer and Popescu 2003; Chen et al. 2006; Mizoguchi et al. 2013). Chen et al. (2006) proposed two main clinical applications for estimating the 2D dose distributions on the EPID detector planes, which were verification of the delivered energy fluence in IMRT, and monitoring the exit-beam dose distribution from the patient during the treatment time. In this section, an effective method for estimating the delivered 2D dose distributions using the EPID images based on previous studies (and in particular the approach of Chen et al. (2006)) is introduced.
The basic approach of the method is to convert the EPID images into images that represent the 2D dose distributions in a water-equivalent phantom at the same level of the EPID detector planes (hereafter referred to as the portal dose images (PDIs)). Figure 12.8 shows a conceptual diagram for calculating PDIs based on the method of Chen et al. The EPID images include signals of laterally scattered photons in the EPID. Therefore, an EPID signal can be formulated by

where i E is the EPID signal, p E is the incident primary X-ray signal, k E is the lateral scatter kernel (LSK) of the EPID, r is the position vector in the spatial domain, and r′ is a shift vector in the spatial domain. The incident primary X-ray signals are extracted by deconvolving the EPID signals from the LSK of the EPID. The deconvolution can be performed in the spatial frequency domain, as follows:


(12.13)

Fig. 12.8
A conceptual diagram for calculating portal dose images (PDIs) based on the method of Chen et al. (2006)

(12.14)

(12.15)

(12.16)

(12.17)
The LSK is a model that represents the spread of the laterally scattered X-rays caused by interaction with incident primary X-rays (Heijmen et al. 1995, Steciw et al. 2005, Chen et al. 2006, van Elmpt et al. 2006, Mizoguchi et al. 2013). The LSK is a point spread function (PSF) for describing the blurring effect caused by the scattered X-rays. The LSKs of the EPID and water-equivalent phantom were experimentally determined in the approach of Chen et al. (2006). The LSKs were obtained using Monte Carlo simulations (Mizoguchi et al. 2013). The LSKs of the EPID and water-equivalent phantom obtained by Monte Carlo simulations at 6 and 10 MV are shown in Fig. 12.9.


Fig. 12.9
Lateral scatter kernels (LSKs) of an electronic portal imaging device (EPID) and water-equivalent phantom obtained by Monte Carlo simulations at 6 and 10 MV
The pixel-to-dose conversion function was measured experimentally (Chen et al. 2006). We also measured the pixel-to-dose conversion function at 6 MV based on the method of Chen et al. (2006) (Mizoguchi et al. 2013). Figure 12.10 shows an experimental geometry for measuring the pixel-to-dose conversion function at our institution.


Fig. 12.10
Experimental geometry for measuring the pixel-to-dose conversion function at our institution
The field size was 5×5 cm2 at an isocenter plane, and an ion chamber was located in the water-equivalent phantom at the same level of the EPID detector plane. The EPID signal and dose were measured at the level of the detector plane with off-axis distances at the detector plane of 0, 7.2, and 14.4 cm while changing the thickness of the water-equivalent phantom on the treatment couch. Then, the pixel-to-dose conversion function was produced by approximating measured values using a first-order polynomial. Figure 12.11 shows the pixel-to-dose conversion function at 6 MV at our institution.


Fig. 12.11


Pixel-to-dose conversion function at 6 MV at our institution. Pink dots indicate experimentally measured points with off-axis distances of 0, 7.2, and 14.4 cm. Blue dots indicate approximated points using a first-order polynomial
Stay updated, free articles. Join our Telegram channel

Full access? Get Clinical Tree


