Daria Motamedi, MD
Cecilia M. Jude, MD
INTRODUCTION
Magnetic resonance imaging (MRI) has created a new opportunity in the diagnosis and treatment of musculoskeletal diseases of the ankle and foot. The superior soft tissue contrast resolution, multiplanar capability, and noninvasive nature of MRI make it highly valuable in the detection and evaluation of soft tissue pathology of the ligaments, tendons, ankle impingement syndrome, sinus tarsi syndrome, compressive neuropathies, and synovial disorders. MRI is also excellent for early detection and evaluation of osseous abnormalities including bone marrow edema.1
IMAGING TECHNIQUE
Routine ankle MRI is performed in the axial, coronal, and sagittal planes relative to the tabletop. The foot is imaged in the oblique axial plane, oblique coronal plane, and oblique sagittal plane. The patient is supine with the foot in about 20° of plantar flexion. An extremity surface coil is used to enhance spatial resolution. A combination of anatomical pulse sequences such as spin-echo T1 or fast-spin echo proton density (FSE PD) and fluid-sensitive sequences such as fat-suppressed FSE T2 or short-tau inversion recovery (STIR) is used. In general, T1-weighted (T1W) images provide good anatomic detail and T2-weighted (T2W) images are useful for assessing the abnormal increase in water that characterizes most pathologic conditions.
MRI ANATOMY OF THE ANKLE TENDONS AND LIGAMENTS
 Normal MRI Tendon Anatomy
Tendons around the ankle are divided into four groups: anterior, posterior, medial, and lateral. The posterior group includes the Achilles (Figure 18-1A,B) and plantaris tendons. The medial (flexor) group from medial to lateral is composed of the posterior tibialis tendon (PTT), flexor digitorum longus (FDL), and flexor hallucis longus (FHL), which are associated with the mnemonic “Tom, Dick, and (posterior tibial artery and nerve) Harry” (Figure 18-1A,C). The lateral (peroneal) tendons include the peroneus brevis medially and the peroneus longus tendon laterally (Figure 18-1A,D). The anterior (extensor) group from medial to lateral is composed of anterior tibialis tendon (ATT), extensor hallucis longus (EHL), and extensor digitorum longus (EDL), which are associated with the mnemonic “Tom, Harry, and (anterior tibial artery and nerve) Dick” (Figure 18-1A,E).2
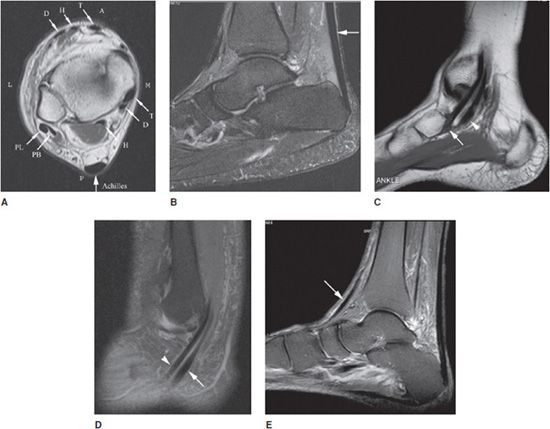
Figure 18-1. Normal tendon anatomy. (A) Axial T1W image shows normal, low-signal tendons of the ankle. The medial (flexor) group pneumonic “Tom (T), Dick (D) and Harry (H)” stands for posterior tibialis tendon (PTT), flexor digitorum longus tendon (FDL), and flexor hallucis longus tendon (FHL). The anterior (extensor) pneumonic “Tom (T), Harry (H) and Dick (D)” stands for anterior tibialis tendon (ATT), extensor hallucis longus (EHL), and extensor digitorum longus (EDL). The lateral (peroneal) group includes peroneus brevis (PB) medially and peroneus longus (PL) tendons laterally. The posterior group includes Achilles tendon and plantaris tendon (not shown). M = medial, L = lateral, A = anterior, P = posterior. (B) Sagittal STIR image shows normal, low-signal Achilles tendon with parallel anterior and posterior walls (arrow). (C) Sagittal T1W image shows normal, low-signal PTT tendon with navicular insertion (arrow). Also seen is FDL (arrowhead). (D) Sagittal STIR image shows normal, low-signal PB (arrowhead) and PL (arrow) tendons. (E) Sagittal STIR image shows normal, low-signal ATT (arrow).
Ankle tendons are seen as low-signal intensity structures on all MRI sequences. Axial images are optimal for evaluating morphologic appearance, longitudinal splits, tendon sheath fluid, and other soft tissue abnormalities. Sagittal images are useful for assessing conditions of the Achilles tendon. Coronal images have no significant value for evaluation of ankle tendons. The magic angle effect produces increased signal within normal tendons when they form an angle of about 55° with the main magnetic vector. This phenomenon is common in ankle tendons and is usually seen in T1W, PD, or gradient-echo sequences. The PTT is the most susceptible to the magic angle effect at its insertion on the navicular bone. Imaging the ankle in 20° of plantar flexion decreases the magic angle effect.1
The ankle retinacula are localized thickenings of the superficial aponeurosis that maintain approximation of the tendons to the underlying bone. There are five retinacula about the ankle: the flexor retinaculum under which the medial tendons pass, the superior and inferior extensor retinacula under which the anterior tendons pass, and the superior and inferior peroneal retinacula under which the peroneus brevis and longus tendons pass. The retinacula appear as thin, low-signal-intensity bands on MRI.3
 Normal MRI Ligament Anatomy
The ligamentous groups that support the ankle joint include the lateral complex, the medial complex (deltoid) ligaments, the ankle syndesmosis, and the spring calcaneonavicular ligament complex. On MRI, the ligaments appear as thin, linear, low-signal intensity structures connecting adjacent bones, usually delineated by high-signal intensity fat.
Lateral Complex
The lateral complex comprises the anterior talofibular (ATFL), posterior talofibular (PTFL), and calcaneofibular (CFL) ligaments. This complex is adequately assessed with routine axial and coronal MRI. The anterior and PTFLs are usually seen on a single axial image obtained slightly distal to the tibiofibular ligaments (Figure 18-2A). Fluid within the joint highlights the ATFL on T2W images. This ligament appears as a thin, straight, low-signal-intensity band extending from talus to the lateral malleolus. The PTFL has a fan-shaped insertion on the distal fibula and may show heterogeneity and thickening (Figure 18-2A). The CFL is frequently seen as a band of low-signal-intensity parallel to the lateral wall of calcaneus on axial MRI. This ligament is more consistently visualized in sequential coronal images extending from its fibular origin to its calcaneal insertion (Figure 18-2B).1,4
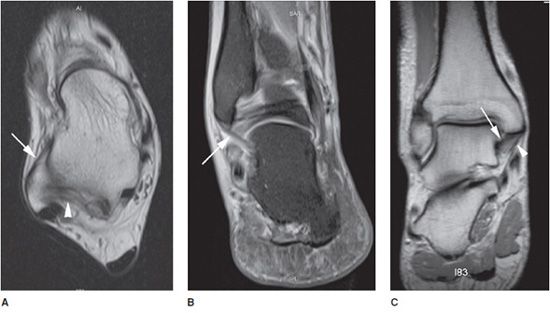
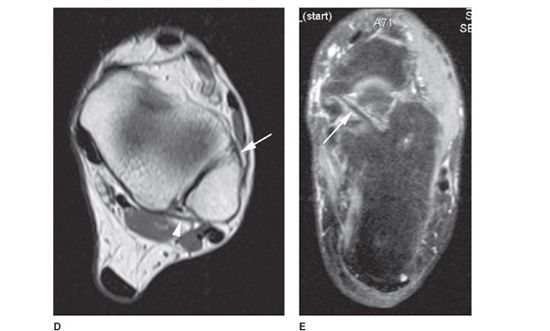
Figure 18-2. Normal ligament anatomy. (A) Axial T1W image shows normal anterior talofibular (ATFL) (arrow) and posterior talofibular (PTFL) (arrowhead) ligaments. (B) Coronal STIR image shows normal, low-signal calcaneofibular ligament (CFL) (arrow). (C) Coronal T1W image shows normal tibiotalar ligament (arrow) of the deep layer of the deltoid ligament, and normal tibiocalcaneal ligament (arrowhead), a component of the superficial layer. (D) Axial T1W image shows normal anterior (arrow) and posterior (arrowhead) tibiofibular ligaments. (E) Axial STIR image shows normal spring calcaneonavicular ligament.
Medial Complex (Deltoid) Ligaments
The deltoid ligament has five bands. The medial collateral ligament complex is divided into superficial and deep layers. The deep layer is composed of the anterior and posterior tibiotalar ligaments (Figure 18-2C). The superficial ligaments comprise the tibionavicular, tibiospring, and tibiocalcaneal ligaments that have variable attachments (Figure 18-2C). The various components of the deltoid ligament are well visualized on both axial and coronal images. The three components that are most often visualized on MRI are the tibiospring, tibionavicular, and posterior tibiotalar ligaments. The anterior and posterior tibiotalar ligaments appear heterogeneous due to interposition of the fat between the ligamentous fibers.1,4
Ankle Syndesmosis
The syndesmotic ligaments include the anterior inferior tibiofibular ligament, the posterior inferior tibiofibular ligament, the inferior transverse tibiofibular ligament, and the inferior interosseous ligament or membrane. The anterior and posterior inferior tibiofibular ligaments are usually seen on multiple sequential axial and coronal images obtained at the level of the tibial plafond and talar dome (Figure 18-2D). On axial MRI images, these ligaments often appear striated and discontinuous due to fat interposition between the ligament fibers and the oblique course of the ligaments.1,4
Spring Calcaneonavicular Ligament Complex
The spring ligament complex (plantar calcaneonavicular ligament) extends from the calcaneus to the tarsal navicular (Figure 18-2E). The spring ligament consists of three components: the superomedial calcaneonavicular ligament, the medioplantar oblique calcaneonavicular ligament, and the inferoplantar longitudinal calcaneonavicular ligament.4
PEARLS
![]() There are four groups of tendons around the ankle: anterior, posterior, medial, and lateral. The tendons of the medial group are known under the mnemonic “Tom, Dick and Harry” and the anterior group as “Tom, Harry and Dick.”
There are four groups of tendons around the ankle: anterior, posterior, medial, and lateral. The tendons of the medial group are known under the mnemonic “Tom, Dick and Harry” and the anterior group as “Tom, Harry and Dick.”
![]() Ankle tendons are seen as low-signal-intensity structures on all MRI sequences.
Ankle tendons are seen as low-signal-intensity structures on all MRI sequences.
![]() The ligamentous groups that support the ankle joint include the lateral complex, the medial complex (deltoid) ligaments, the ankle syndesmosis, and the spring calcaneonavicular ligament complex.
The ligamentous groups that support the ankle joint include the lateral complex, the medial complex (deltoid) ligaments, the ankle syndesmosis, and the spring calcaneonavicular ligament complex.
![]() The ligaments appear as thin, linear, low-signal intensity structures connecting adjacent bones, usually delineated by high-signal intensity fat.
The ligaments appear as thin, linear, low-signal intensity structures connecting adjacent bones, usually delineated by high-signal intensity fat.
TENDINOSIS, TENDON, AND LIGAMENTOUS INJURIES
 Tendon Pathology
Tendon pathology can be categorized as tendinosis, tenosynovitis, entrapment, rupture, and dislocation. These conditions can overlap or coexist and be indistinguishable at MRI. Etiology of these conditions includes trauma, overuse, infection, and inflammatory arthropathies. MRI features of tendinosis include fusiform thickening and intermediate signal intensity of the tendon on T1W and PD images, and hyperintense signal on T2W image that becomes more extensive with progressive degeneration. MRI findings of acute tenosynovitis include fluid within tendon sheath with normal shape and signal of the tendon. With chronic tenosynovitis, focal or diffuse thickening of the tendon and scarring of peritenon is noted. Stenosing tenosynovitis results from synovial proliferation and fibrous adhesions between the tendon and the sheath, resulting in tendon entrapment or rupture. MRI shows diffusely thickened tendon sheath appearing as intermediate-to-low-signal-intensity tissue, and variable amount of fluid surrounding the tendon. There is significant overlap in the imaging appearance of asymptomatic tendon degeneration and symptomatic tendinopathy; therefore, MRI changes of the tendon alone cannot reliably predict a clinically significant lesion.1,3
Partial tendon tear shows heterogeneous signal intensity similar to advanced tendinosis in all MRI sequences, without complete interruption. Longitudinal intrasubstance tendon tears may be difficult to distinguish from tendinosis and severe tendon degeneration. Complete tendon tear is seen as complete disruption of the tendon fibers in all MRI sequences, with fraying and retraction of the torn edges of the tendon. The tendon gap demonstrates intermediate signal intensity on T1W and high signal on T2W images in acute tears from hemorrhage and edema. This space is filled with scar and fat in chronic tears. MRI is also valuable in evaluation and detection of tendon subluxation and dislocation.3
Achilles Tendon Injuries
The Achilles tendon has the largest diameter and is the strongest tendon, and the primary plantar flexor of the foot at the ankle joint. The tendon arises from the medial and lateral heads of the gastrocnemius muscle and from the soleus muscle, and inserts on the posterior aspect of the calcaneus. Achilles tendon pathology can be divided as noninsertional and insertional, and is manifested by acute and chronic peritendinosis (also referred to as peritendinitis), tendinosis, and tears. Noninsertional tendinopathy occurs most often 4-6 cm above the calcaneal insertion, due to presence of a hypovascular zone. Insertional tendinopathy is commonly associated with Haglund deformity, chronic traction injury, and seronegative arthropathy.2,3
The anterior margin of the Achilles tendon is flat or slightly concave, with a small focal bulge sometimes seen anteriorly. The thickness of the tendon is constant on sagittal images, resulting in parallel anterior and posterior margins. The Achilles tendon is low signal on T2W images; however, the signal intensity is often slightly heterogeneous on T1W and PD images, and it is quite heterogeneous at its insertion.2,3 Sagittal and axial images are the most useful in assessment of the Achilles tendon (Figure 18-1A,B).
Appearance of Achilles tendinosis on MRI includes loss of the anterior concave or flat surface of the tendon on axial images, fusiform thickening on sagittal plane, and areas of increased signal intensity in all sequences. Acute partial tendon tears are often associated with edema and hemorrhage within the Kager fat pad and intratendinous signal intensity on T2W images. Acute full-thickness tendon tears demonstrate complete discontinuity of the tendon, with tendon retraction and surrounding soft tissue edema (Figure 18-3A). Other imaging findings associated with insertional tendinopathy are calcaneal marrow edema, Haglund deformity (enlarged posterosuperior calcaneal tubercle), and retrocalcaneal and retroachilles bursitis.1
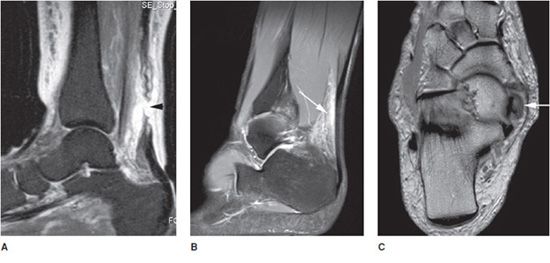
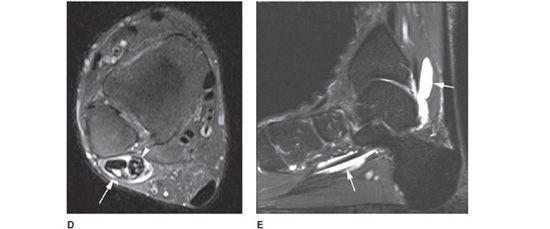
Figure 18-3. Tendon pathology. (A) Sagittal STIR image shows high Achilles tendon tear with complete disruption and retraction of tendon fibers (arrowhead), with surrounding soft tissue edema. (B) Sagittal STIR image in different patient shows high-signal intensity in the Kager fat pad (arrow), anterior to Achilles tendon, consistent with peritenonitis. (C) Axial T1W image in different patient shows enlarged posterior tibialis tendon (arrow) with increased internal signal consistent with tendinosis. (D) Axial STIR image in different patient shows tenosynovitis and partial tear of the peroneal tendons (arrowhead) with fluid within the common peroneal tendon sheath (arrow). (E) Sagittal STIR image in different patient shows fluid-distended flexor hallucis longus tendon sheath (arrows) consistent with tenosynovitis.
The Achilles tendon does not have a synovial sheath, instead is surrounded by a paratenon laterally and posteriorly. MR manifestation of Achilles peritendinosis (peritendinitis) includes thickening of the paratenon with areas of altered signal intensity in the pre-Achilles (Kager) tendon fat pad secondary to edema (Figure 18-3B). Coexisting tendinopathy is often present.3
Patients with familial hypercholesterolemia may present with xanthoma of the Achilles tendon, which demonstrates fusiform thickening, intrasubstance stippling and heterogeneity. This entity should be differentiated from tendinosis.1
Posterior Tibialis Tendon Injuries
The posterior tibialis muscle originates from the interosseous membrane and proximal tibia and fibula. The PTT then courses posterior to the medial malleolus, and inserts mainly on the navicular tuberosity, with additional mid and distal tarsal and metatarsal attachments. The PTT is normally approximately twice the size of the adjacent FDL tendon. Most pathology occurs near the medial malleolus and distally at the navicular insertion. PTT degeneration and tear are associated with progressive flatfoot deformity.3
Chronic injury of the PTT is one of the most common tendon abnormalities seen around the ankle. The most common injuries are tenosynovitis, tendinosis, tears, and tendon dislocation. The imaging findings of tendinosis, tenosynovitis, and tears are similar to those seen in other tendons. Tendinosis and tears are often grouped together as PTT dysfunction. Based on MRI appearance, PTT dysfunction is categorized into three types. In type I, the tendon is thickened so that its diameter is greater than two times that of the FDL tendon, with or without internal increased signal (Figure 18-3C). Type II injury is a partial tear with stretching and elongation of the tendon, decrease in PTT tendon diameter on axial MRI, which is equal or smaller than FDL tendon, and usually without signal intensity alteration. Type III tear is rare and shows complete discontinuity of the tendon. With progressive tear of the tendon, there is loss of arch of the foot (flatfoot deformity), which appears on MRI as increased plantar flexion of the talus at the talonavicular joint seen best on sagittal images, and also lateral subluxation of the navicular. Other soft tissue and bony abnormalities include fluid within the tendon sheath and bursae, accessory navicular bone, sinus tarsi syndrome, and bone marrow edema. Dislocation of posterior tibial tendon is rare, seen in young patients following ankle injury, leading to tear of flexor retinaculum and tendon dislocation. On axial MRI, a partially torn, subluxed tendon is seen medial or anterior to the medial malleolus.1,2
Peroneal Tendon Injuries
The peroneus longus muscle originates from the posterolateral condyle of the tibia, the interosseous membrane, and the proximal fibula. The peroneus brevis muscle originates from the distal fibula and interosseous membrane, deep to the peroneus longus. The peroneus longus and brevis tendons pass beneath the fibula within the retromalleolar sulcus and are held in place by the superior peroneal retinaculum, then run beneath the inferior peroneal retinaculum at the level of the calcaneus. Distally, the peroneus longus tendon courses in the peroneal groove of the cuboid and inserts on the plantar aspect of the first metatarsal and first cuneiform. The peroneus brevis tendon courses laterally and inserts on the base of the fifth metatarsal.2
The peroneal tendons have an oval shape; however, they may appear flattened at the level of the malleolus. The peroneal brevis tendon may appear crescentic at this level, but should not be thinner in the middle than periphery.
Tenosynovitis, tendinosis, or tears of the peroneal brevis tendon occur commonly at the level of the lateral malleolus, due to compression between the peroneal longus tendon and lateral malleolus (Figure 18-3D). Chronic tenosynovitis can progress to stenosing tenosynovitis at this level. Peroneal brevis tears are usually longitudinal and appear as lentiform, boomerang, or C-shaped tendon, or in more severe cases as two separate peroneus brevis tendons on either side of the peroneus longus tendon. Tears of peroneal longus tendon may coexist with peroneal brevis tendon tear at the malleolar level. Isolated tears of the peroneal longus tendon are more common at the level of the peroneal tubercle or cuboid tunnel. Os peroneum is a sesamoid bone that may be seen within the peroneus longus tendon at the level of the calcaneocuboid joint and may be associated with tendon degeneration.1,2
Shallow retromalleolar sulcus or a lax superior retinaculum predisposes to peroneal brevis tendon dislocation and tear. Peroneal tendon dislocation is best seen on axial MRI that shows the tendon seated anteriorly and laterally to distal fibula within a pouch formed by a stripped-off superior peroneal retinaculum. Calcaneal fractures predispose the peroneal tendons to partial tears, dislocation, or entrapment. The tendons are seen outside of the retromalleolar sulcus, lateral to the lateral cortex of the malleolus. Marrow edema of the lateral calcaneus and peroneal tubercle may also be noted.
Flexor Hallucis Longus Tendon Injuries
The flexor hallucis muscle originates from the lower two-thirds of the fibula and the interosseous membrane. The tendon courses through a shallow groove in the distal tibia, beneath the flexor retinaculum, then between the medial and lateral talar tubercles of the posterior talus, and subsequently beneath the sustentaculum talus. The tendon then crosses beneath the FDL (anatomic location called the knot of Henry) and inserts on the great toe. This tendon is best visualized on axial and sagittal MRI.
Tendinosis, tenosynovitis, and tears occur commonly at or distal to the groove between the posterior tubercles of the talus, or at the decussation with the FDL (knot of Henry). The tendon is susceptible to entrapment at the level of the posterior talus, usually seen in patients with a large os trigonum. Synovial fluid surrounding a normal appearing tendon in the absence of significant joint effusion is consistent with tenosynovitis. This finding in the presence of a large joint effusion is most likely due to communication between these two structures, a normal variant. Repeated and extensive inflammation of the peritenon results in stenosing tenosynovitis leading to a functional hallux rigidus. FHL tendinosis and tensynovitis may be seen as the tendon passes between the hallux sesamoid bones at the head of the first metatarsal bone. MRI can help to distinguish this condition from hallux sesamoiditis.1,2
 Ligamentous Injuries
Ankle ligaments provide mechanical stability and directed motion for the joint. Common mechanisms for ligamentous injuries are inversion, eversion, external rotation, and dorsiflexion. On MRI, ligaments are best evaluated on fluid-sensitive sequences such as T2 and STIR. Ligament injury appears as increased signal intensity within the ligament, thickening, discontinuity, or wavy appearance within the ligament. Adjacent soft tissue and bone marrow edema may be present.
Acute ligament injuries can be classified on MRI based on severity of findings. Grade I injury shows a stretched ligament with normal morphology, with surrounding edema. Grade II injury demonstrates a partially torn ligament that may appear thickened with intrasubstance edema, or discontiguous fibers. Grade III injury is a complete disruption of the ligament with marked surrounding edema.
Lateral Ligament Injuries
The lateral collateral ligament complex is the most commonly injured group of ankle ligaments and is often associated with other ligamentous injuries in the ankle (Figure 18-4A,B). Ankle inversion injuries are the most common cause of lateral ligament tears. The ATFL is the weakest ankle ligament and the most frequently torn, followed by the CFL. The PTFL is the strongest lateral ankle ligament and less commonly injured. Chronic ankle instability occurs in up to 20% of patients with lateral complex injury, and is characterized by multiple ligament injuries.4
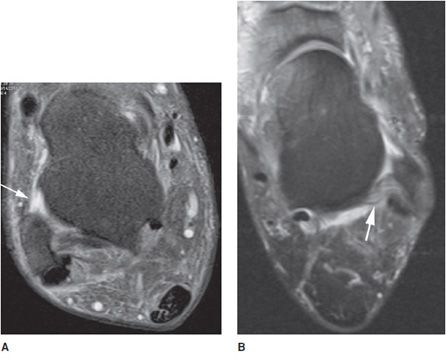
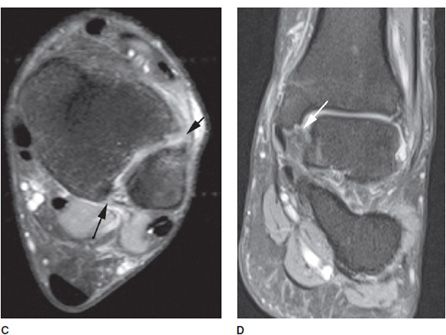
Figure 18-4. Ligament pathology. (A) Axial STIR image shows full-thickness tear of anterior talofibular ligament (arrow). (B) Axial STIR image in different patient shows waviness of the posterior talofibular ligament (arrow) consistent with a partial tear. (C) Axial STIR image in different patient shows full-thickness tear of the anterior tibiofibular ligament (short arrow) and partial tear of posterior tibiofibular ligament (long arrow). (D) Coronal STIR image in different patient shows partial thickness tear of tibiotalar fibers (deep layer) of the deltoid ligament (arrow).
At MRI, the ATFL is seen as a linear low-intensity structure extending from the talus to the fibula at the level of the malleolar groove. At the same level, the PTFL may be seen. The PTFL normally demonstrates an inhomogeneous appearance due to interdigitating fat. The CFL may be seen on coronal or axial images as a thin low-signal structure extending from the fibular tip to the posterolateral calcaneus.
Anatomic classification of lateral ligament tear is based on the number of ligaments involved. A first-degree sprain consists of partial versus complete tear of ATFL (Figure 18-4A). With a second-degree sprain, the ATFL and CFL are torn. A third-degree sprain includes injuries of the ATFL, CFL, and PTFL. Fluid within the peroneal tendon sheath can be a secondary sign of CFL injury.1,5,6
Syndesmosis Injury
The anteroinferior and posteroinferior tibiofibular ligaments and the interosseous membrane are most commonly injured in external rotation and hyperdorsiflexion. This injury is far less common than the lateral ankle sprain. At MRI, the anterior and posterior tibiofibular ligaments are oriented obliquely and seen on sequential axial and coronal images. Injury to these ligaments is also called a “high ankle sprain” (Figure 18-4C). On MRI, these injuries present with edema of the syndesmosis, with or without discontinuity of ligament fibers. These injuries may be isolated or may occur in conjunction with injury of other ligament groups. It may be associated with fibular fractures (Weber B or C ankle fracture).4–6
Deltoid Ligament
The deltoid ligamentous complex consists of a deep layer that extends relatively horizontally from the medial malleolus to the talus, and a superficial layer that extends more vertically from the medial malleolus to the calcaneus and navicular. Isolated medial collateral or deltoid ligament injuries are infrequent. These injuries are usually associated with other ligamentous injuries or malleolar fractures.4 MRI finding of deltoid ligament contusion includes loss of normally seen striations within this ligament, showing homogeneous intermediate signal intensity (Figure 18-4D). Reactive fluid within the PTT sheath can be a secondary sign of deltoid ligament injury.1
Spring Calcaneonavicular Complex
The plantar calcaneonavicular ligament is also known as the spring ligament complex. The superomedial calcaneonavicular ligament is the most often injured component of the spring calcaneonavicular complex. Because of the proximity of the spring ligament to the PTT and its integral function in stabilizing the plantar arch, spring ligament injuries are often associated with PTT dysfunction.4
PEARLS
![]() Tendon pathology can be categorized as tendinosis, tenosynovitis, entrapment, rupture, and dislocation.
Tendon pathology can be categorized as tendinosis, tenosynovitis, entrapment, rupture, and dislocation.
![]() MRI features of tendinosis include fusiform thickening and intermediate signal intensity of the tendon on T1W and PD images, with hyperintense signal on T2W. MRI findings of acute tenosynovitis are fluid within tendon sheath with normal shape and signal of the tendon. With chronic tenosynovitis, focal or diffuse thickening of the tendon and scarring of peritenon is noted.
MRI features of tendinosis include fusiform thickening and intermediate signal intensity of the tendon on T1W and PD images, with hyperintense signal on T2W. MRI findings of acute tenosynovitis are fluid within tendon sheath with normal shape and signal of the tendon. With chronic tenosynovitis, focal or diffuse thickening of the tendon and scarring of peritenon is noted.
![]() On MRI, ligaments are best evaluated on fluid-sensitive sequences such as T2 and STIR.
On MRI, ligaments are best evaluated on fluid-sensitive sequences such as T2 and STIR.
![]() Ligament injury appears as increased signal intensity within the ligament, thickening, discontinuity, or wavy appearance within the ligament.
Ligament injury appears as increased signal intensity within the ligament, thickening, discontinuity, or wavy appearance within the ligament.
PLANTAR FASCIA TENDINOSIS AND TEAR
The plantar fascia is a connective tissue structure that arises from the inferior aspect of the calcaneus and runs along the plantar aspect of the foot to blend with the deep fascia and transverse ligaments at the level of the metatarsal heads. The plantar fascia has an important role in maintaining the longitudinal arch of the foot.7
Plantar fasciitis is most likely due to repeated trauma resulting in microtears and inflammation of the fascia and perifascial soft tissues. Plantar fasciitis is more common in runners and obese patients. The patients present with pain at the origin of the plantar fascia, more severe in the morning and exacerbated by dorsiflexion of the toes.1
Lateral foot radiographs often demonstrate plantar calcaneal spurs; however, calcaneal spurs can be seen in 25% of asymptomatic patients and are not specific for plantar fasciitis. MRI is useful in distinguishing plantar fasciitis and tear from other causes of heel pain. On sagittal and coronal MRI, the normal plantar fascia appears thin and hypointense, measuring 3–4 mm in thickness at the calcaneal insertion (Figure 18-5A). The fascia slightly flares at the calcaneal insertion and extends along the plantar aspect of the foot. MRI findings of acute plantar fasciitis include fusiform thickening of up to 7–8 mm, intermediate signal on T1W and PD images, and hyperintense signal on T2W images (Figure 18-5B). These changes are best seen near the calcaneal insertion. A bone spur may be seen on sagittal T1W images. In more severe cases, edema may be seen in the adjacent bone marrow or surrounding soft tissue. MRI findings of tear include discontinuity of the fibers, focal edema, and hemorrhage, which may occur at the origin or 1–2 cm distal to the origin of the plantar fascia (Figure 18-5C).1,7,8
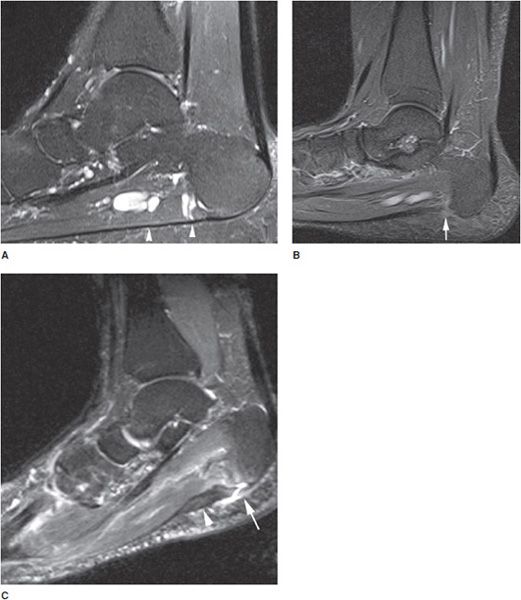
Figure 18-5. Plantar fascia tendinosis and tear. (A) Sagittal STIR image shows the low-signal normal plantar fascia and the calcaneal insertion (arrowheads). (B) Sagittal STIR image in different patient shows increased signal of the proximal plantar fascia at the calcaneal insertion consistent with plantar fasciitis (arrow). (C) Sagittal STIR image in different patient shows full-thickness tear of the proximal plantar fascia (arrow) with diffuse tendinosis (arrowhead).
Related posts:
Stay updated, free articles. Join our Telegram channel

Full access? Get Clinical Tree


