Basic Technical Principles and Radiation Safety
Basic Principles of Image Interpretation
J. Eckardt
N. Meier
Basic Technical Principles and Radiation Safety
Basic Technical Principles
Basic Physical Principles of PET-CT
The first prototype of a hybrid PET-CT system consisted of a PET scanner connected to a CT scanner and was used in the examination of cancer patients (Beyer et al. 2000). Since both subsystems were already well advanced by that time, integrating the two scanners intoa hybrid system was more of a technical challenge than a physical one.
Besides optimizing process quality in patient care, there are several physical reasons for combining PET and CT into a single system:
- Automatic coregistration is necessary in cases where image data acquired separately cannot be fused into one because the anatomical information in the PET scan is insufficient to allow it to be matched to the CT scan.
- Patient positioning is different for PET and CT due to differences in arm positioning (down for PET, up for CT), in the scanner tables, and in the scanning goals (e.g., supine position for diagnostic scanning vs. prone position for radiotherapy planning). This leads to non-linear displacement of organs, especially in the trunk, that prevents accurate fusion of the image data.
Both modalities use electromagnetic radiation to produce an image. The radiation for CT (X-rays) is produced in an X-ray tube, while the radiation for PET (gamma radiation) is a product of nuclear decay. The X-ray tube emits a continuous energy spectrum up to a peak energy determined by the voltage of the tube. A gamma spectrum, on the other hand, is discrete, i.e., only gamma quanta of particular energy levels occur.
Basic Principles of Computed Tomography
CT imaging is based on the attenuation of X-rays due to absorption and scattering. Fan-shaped projection images of submillimeter thickness are used to compute axial images of the scanned region. Just as in projection radiography, a detector positioned opposite the X-ray source registers the transmission of X-rays through the patient. Generally the radiation is picked up by a series of detectors mounted on photodiodes (e.g., by gadolinium oxysulfide scintillation). The detectors are arranged in a linear array along a circular arc segment and are aimed at the focal spot of the X-ray tube. Modern CT scanners are “multislice” units in which multiple data lines are acquired simultaneously to shorten the acquisition time and optimize image quality (Kalender 2000).
Data Acquisition and Image Rendering
Each individual measured value in CT represents the sum of a heterogeneous attenuation process caused by the presence of different tissues along the projection path. All the attenuation values detected simultaneously along one of these paths is called a projection. All of the projections are assembled to produce a raw dataset, which is called a “sinogram” because of the sinusoidal motion of the projected objects during rotation of the tube and detector. Each data line in the sinogram corresponds to a specific slice location in the patient.
In the simplest case, a sectional image can be produced by a parallel, line-by-line back-projection assuming a homogeneous distribution of measured summation values over all of the image matrix elements along the projected path. The result of this process is called a “strip image” (Fig. 1.1).
Additional strip images for this slice position can be superimposed or summed to reconstruct the X-ray attenuation values in the patient. Despite the plausibility of this rendering process, however, the resulting image is blurred. Mathematical analysis will show that the projections projections must first be multiplied by a filter function, or convolved, before the back-projection is performed (Fig. 1.1). This filter function is called a kernel. The mathematical solution is not unique, however, as it may be satisfied by a host of functions. Familiar examples of these discrete filter functions are the Ramachandran–Lakshminarayanan kernel and Shepp–Logan kernel (Morneburg 1995).
This mathematical variety is advantageous, as it permits the operator to use specific selection criteria and algorithms to manipulate the appearance of the final image. Thus, a single raw dataset in CT can be manipulated to yield a spectrum of images ranging from soft, low-noise, low-contrast soft-tissue images to edge-enhanced, noisier, higher-contrast images without exposing the patient to additional radiation (Fig. 1.2).
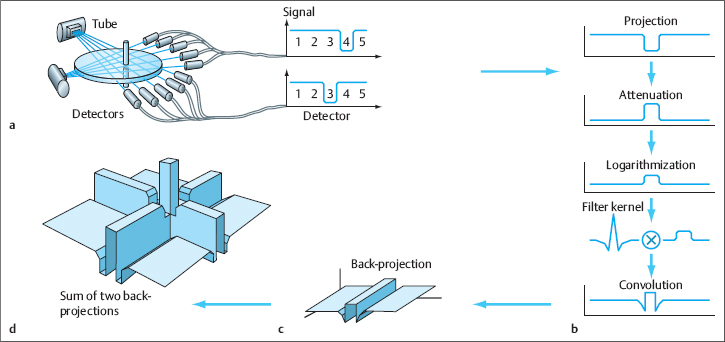
Fig. 1.1a–d Principle of image reconstruction in CT.
Images are reconstructed by filtered back-projection, illustrated here for two projections, each with five narrow beams and five detectors.
a The cylindrical object attenuates X-rays in front of detector 4 along the first projection and in front of detector 3 along the second projection. The corresponding measured values are shown in the adjacent diagrams.
b Next the attenuation value is converted to absorption and logarithmized. This converted projection is stored as the first line in the raw dataset (1 projection=5 measured values). Image rendering begins with mathematical multiplication of the individual projections from the raw dataset by a selected convolution filter, or kernel. Various kernels may be used depending on the clinical question (reason for referral for imaging), the region examined, and the manufacturer.
c The convolved projection is now distributed uniformly over the entire image in the direction of the original projection (we do not know the point along the beam path where the absorption occurred). This process yields the “strip image” of a simple back-projection of the measured attenuations (or transmissions). This computation is performed for all measured projections and is summed to produce a final CT image.
d The basic shape of the cylindrical object is already visible as a result of only two projections, but streaky summation artifacts are still present along both projections. These streaks almost completely disappear when a sufficiently large number of projections (several thousand) are used, owing to the negative components contained in the filtering kernels.
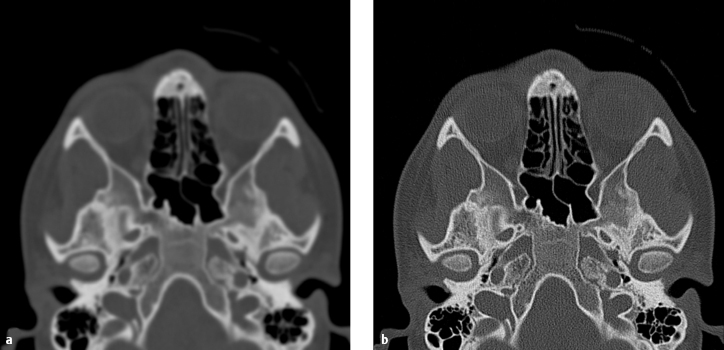
Fig. 1.2a, b Image reconstruction with different kernels. Different kernels were used to reconstruct these images from an identical raw dataset acquired by multislice CT with a 4×1.0-mm slice thickness.
a Soft kernel (smoothing filter).
b Sharp kernel (edge-enhancing filter).
CT displays the distribution of the transformed X-ray attenuation coefficients (Hounsfield units, HU) in the form of a gray-scale pattern. The gray levels are displayed as dimensionless quantities relative to the attenuation of water and air. In the calibrated state, water is assigned an attenuation value of 0HU while air is assigned a value of–1000HU (Fig. 1.3). The distribution of the attenuation properties of the scanned tissue structures is known and can be used, for example, in planning a surgical procedure or radiation therapy.
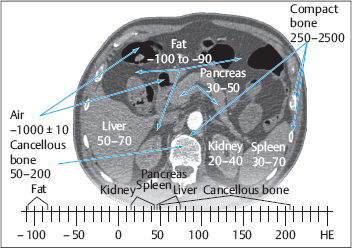
Fig. 1.3 Hounsfield scale.
Tissue attenuation values in CT are expressed in Hounsfield units (HU) on a relative scale based on the attenuation produced by water and air. The attenuations of specific tissues are subject to interindividual variations and may show considerable overlap. This results in a somewhat imprecise correlation between tissue types and attenuation values.
Spiral CT
Principle of spiral acquisition. Instead of slice-by-slice scanning, almost every CT examination today employs spiral or volume acquisition in which the patient table feeds steadily through the gantry while the X-ray tube rotates continuously around the patient. This technique provides rapid, complete coverage with no interslice gaps. Spiral CT is particularly advantageous for scanning moving organs, in which case a single projection is repeatedly acquired in a precisely defined plane. Owing to the continuous table feed, all other projections are either in front of or behind the desired position for image reconstruction. The “missing” projections are mathematically calculated by interpolation between the previous and subsequent rotational positions.
Approximation methods. The lower the pitch of the spiral acquisition, i.e., the more slowly the patient moves through the gantry for a constant rotation speed, the closer this approximation is to the actual attenuation that would have been measured at the desired location. The approximation can be improved by making use of the fact that rotating the acquisition geometry by 180° would theoretically yield the same sum of absorption values. If these inverted values are now input as actual measured values for computational purposes, the distances between the measured values will be reduced by half, and this gain can be translated into a faster or more accurate acquisition. It is clear, however, that this method does not accurately reflect data at the start and end of data acquisition, because these data are absent for one-half of a detector rotation before the start of the acquisition and after its completion. As a result, one is forced to acquire additional data in one complete rotation past the volume of interest for the computer algorithm.
Table speed. The speed at which the table is fed through the gantry, which controls the “pitch” of the spiral acquisition, is limited by the slice thickness selected (on the detector). Information about a given slice of tissue is contained only in those projections that have been subject to X-ray attenuation from anatomical structures situated in that slice. Based on the mathematical assumptions of the 180° algorithm, the maximum speed of table feed is two slice thicknesses for each complete detector rotation.
The ratio of table speed to slice thickness is called the “pitch.” The advantage of data acquisition in thin slices is that it reduces artifacts, sharpens image details, and provides thinner slices for 3D analysis. Disadvantages are that acquisition times are longer and the radiation dose to the patient is generally higher. A large number of thin slices also requires greater data storage capacity and longer transfer and computation times.
Reconstruction index. Spiral acquisition makes it possible to reconstruct an image at any desired location within the volume dataset. The reconstruction index determines where the individual images are acquired and which projections contribute to image computation. This index, or increment, describes the distance between two images or the difference in table position between two reconstructed images. It may be set at greater than or less than the slice thickness at which the projections are acquired. If the reconstruction index is set at equal to the slice thickness, the reconstructed image slices will be contiguous with one another in the classic fashion. If the increment is smaller than the slice thickness, the slices will overlap and identical projections from the sinogram will be used in consecutive reconstructions. If the increment is greater than the slice thickness, interslice gaps will occur.
Multislice Spiral CT
In a multislice scanner equipped with N adjacent detector rows, it is unnecessary to predefine a reconstruction index or a specific acquisition slice thickness (thickness of the projections). Once all the projections have been acquired, the operator can access the particular projections that are needed to give the desired slice thickness. Thus, many imaging protocols include the acquisition of projections in “thin” (detector) slices which can then be assembled assembled into thicker slabs. The lower limit is determined by the slice thickness at which the projections were acquired.
In principle, one can also increase the acquisition speed (table speed) by a factor of N. Generally, however, the potential gain in acquisition speed is sacrificed in favor of higher resolution. In addition, the data acquired from all the detector rows can be averaged over N rows to reconstruct a slice that contains less image noise and gives sharper details.
On the other hand, multislice spiral CT is subject to “cone beam artifacts,” especially in scanners with a large number of rows, caused by the broadening of the beam geometry in the axial direction. To correct for these artifacts, the various multislice projections must be mathematically converted to the projections that would have been acquired with a single detector row.
Image quality depends critically on the relationship between the slice thickness of the acquired projections, the dose per volume unit or detector unit, and the table speed. In the volume acquisition of a particular region of interest, the slice thickness can be selected so as to optimize the acquisition time and avoid respiratory misregistration, for example. Spatial resolution can also be optimized; this prolongs the acquisition time but can give more detailed reconstructions. Higher resolution and shorter acquisition times necessarily reduce the maximum volume that can be covered in the examination.
Basic Principles of PET
Positron emission tomography (PET) is a noninvasive method for mapping the spatial and temporal distribution of a radioactive substance in the human body based on the detection of radioactive emissions.
Beta-Plus Decay and Gamma Radiation
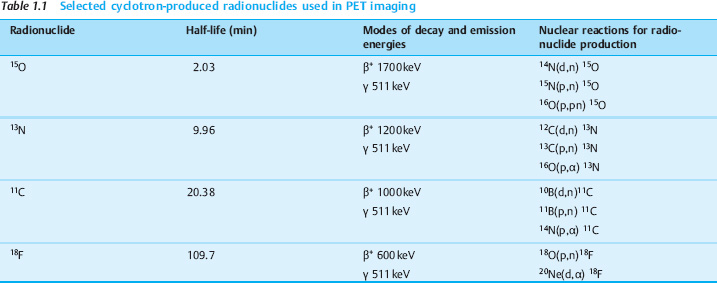
Positron emitters (substances that emit positively charged electrons, or β+ particles) are used in PET imaging. The radionuclides most commonly used for PET are listed in Table 1.1. As an example, the decay of the widely used radionuclide 18F is shown diagrammatically in Fig. 1.4. The first step in this process is a nuclear decay event in which a proton in the atomic nucleus is converted into a neutron. The liberated energy and positive charge are emitted in the form of a positron (e+, also designated β+). This particle has the same properties as an electron except for its positive charge.
When a positron enters the tissue, it travels only a few millimeters, depending on its energy (Table 1.1), before combining with an electron and emitting two gamma quanta, each having an energy of 511keV. Consistent with the law of mass–energy equivalence, the energy of the gamma quanta pair must equal the resting masses of the electron and positron. Because the electron and positron are mutually destroyed when they combine, this process is also called an annihilation event. It creates two gamma quanta, which fly apart in opposite directions at the speed of light, deviating slightly from a 180° angle when the reaction partners are not at rest. Despite the name “positron emission tomography,” this technique detects, not the positrons themselves, but the gamma quanta produced by their annihilation.
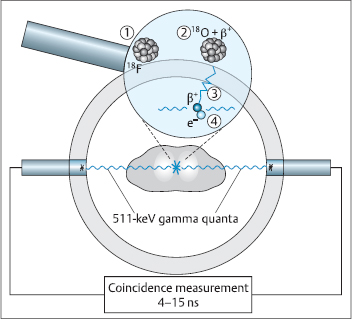
Fig. 1.4 Positron decay (magnifying lens) and coincidence detection. The radionuclide 18F (1) decays to 18O with the emission of a positron β+ (2). This particle is slowed down in the tissue by collisions (3) and is annihilated when it collides with an electron e− (4). When this annihilation takes place, two gamma quanta are produced and fly apart from each another at a 180° angle. The coincidence circuitry ensures that only results measured within the brief coincidence interval are registered as image data.
PET Detectors
As in conventional nuclear medicine, modern PET scanners use scintillation crystals coupled to photomultipliers for the detection of gamma radiation. The scintillator converts the gamma rays to weak light signals, which are transformed into electrical signals and amplified by photomultipliers. The detector materials must have a high density and high atomic number to ensure a high probability of detection of the high-energy gamma quanta. It is also important to use scintillators with a high light yield, as this parameter correlates with the energy resolution of the crystals. Energy resolution is the ability to filter out as many scattered coincidences (“scattered trues”) as possible. Newer designs employ avalanche photodiodes (Pichler et al. 2001, 2006), but these have not yet been introduced into PET-CT systems in clinical use.
Coincidence Measurement
An ideal imaging system should supply the complete data (time, location) about the emission of a gamma quantum in order to allow conclusions to be drawn about the tissue on the basis of the tracer principle. In themselves, scintillation detectors for gamma quanta are nonimaging systems because they can detect the quanta but not their angles of incidence, and without this information we cannot reconstruct an image—like exposing photographic paper without a lens (or, for a pinhole camera, without an aperture).
In conventional nuclear medicine imaging (scintigraphy, SPECT), the angle of incidence is defined by using lead shields (collimators) to absorb gamma quanta that are not incident at a perpendicular angle. In PET, coincidence detection is used to compensate for the incomplete utilization of information emitted toward the detector. It is accomplished by placing two detectors on opposite sides of the object to be imaged. Each positron source emits two gamma quanta in opposite directions during the annihilation event (Fig. 1.4). One gamma quantum takes approx. 3.3 nanoseconds to travel a distance of 1m. When one gamma quantum is detected and then a second quantum is registered by a different detector within a narrow coincidence window (4–15 nanoseconds), it is assumed that both quanta arose from the same annihilation event. The assumed emission site of both gamma quanta, and thus of the positron decay, is located on the line joining the two opposing detectors, called the line of response (LOR). This principle is also known as electronic collimation.
The annihilation site on the LOR can be localized to a zone of approximately 20cm by determining the time difference between the arrivals of the two gamma quanta (Lewellen 1998). This process is called time-of-flight (TOF) PET.
Composition of the Raw Data
When two unscattered gamma quanta from a positron decay are detected within the coincidence window, these “desired coincidences” are classified as true coincidences or “trues” (Fig. 1.5). But the detectors also register various other coincident events with a corresponding LOR which do not characterize the site of the positron decay and which degrade the quality of the PET image:
- Random coincidences: Gamma quanta that are detected within the coincidence window but originate from different positron decays are called random coincidences or “randoms” (Fig. 1.5). The probability of random coincidences increases with the total injected activity.
- Scattered coincidences: The emitted gamma quanta must pass through different tissue layers while traveling from their emission site within the body to the detector. The thicker the traversed tissue layer, or the higher its density, the greater the interaction between the radiation and the tissue. This may deflect the radiation from its original direction and cause it to lose some of its energy (Compton effect). When at least one gamma quantum is scattered in this fashion on its way to the detector, the registered events are called scattered coincidences or “scattered trues” (Fig. 1.5). They cause tissue-dependent blurring of the PET image.
- Attenuation: When at least one of the gamma quanta arising from the annihilation event is not detected because of energy loss or complete absorption, the corresponding annihilation event will go unregistered (Fig. 1.5). The probability of both gamma quanta reaching the detector is greater for superficial annihilation events than for those deeper in the body. It also depends on the density of the traversed tissue. Attenuation is smallest in air, greater in lung and water, and greatest in bone.
The PET acquisition, then, yields a sum of true, random, and scattered coincidences that are further influenced by attenuation of the gamma rays in the tissue.
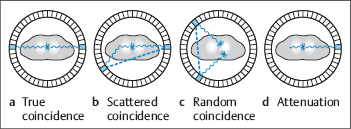
Fig. 1.5a–d Effects that influence or degrade image quality in PET.
a True coincidence (“trues”): both gamma quanta reach a detector without further interaction.
b Scattered coincidence (“scattered trues”): at least one gamma quantum is scattered on its way to the detector.
c Random coincidence (“randoms”): two gamma quanta arising from different annihilations are registered within the coincidence window.
d Attenuation: at least one gamma quantum is completely absorbed on its way to the detector.
Correction of the Raw Data
One of the strengths of PET is that it provides quantifiable images, and it is particularly important in this application to determine the activity distribution independently of the emission site and tissue attenuation. The effects listed above must be taken into account so that the registered gamma quanta can be properly analyzed to map the distribution of positron emission sites. The challenge is to identify the true coincidences while correcting for the contributions of random and scattered coincidences and tissue-dependent attenuation:
- Random coincidences: The proportion of random coincidences can be estimated by measuring the events outside the coincidence window that are separated by such a long time interval (say, 120nanoseconds) that they cannot be correlated, i.e., they cannot have originated from the same decay event. The proportion of these events provides a good estimate of the number of random coincidences that occur within the coincidence window.
- Scattered coincidences: Scintillation detectors register the energy of incident gamma quanta. Given the limited energy resolution of the detectors, it is difficult to distinguish between scattered and unscattered gamma quanta based on this energy information (scattered gamma quanta lose some of their energy in the scattering process). The gamma quanta excluded on the basis of the energy information increase the proportion of gamma quanta that the system interprets as absorbed. The many remaining scattered coincidences are determined with the aid of various models, some of which are complex (Bailey 1998).
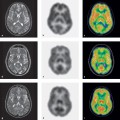
- Attenuation: Location-dependent attenuation within the body correlates strongly with the density of the tissue. This density can be measured with CT by converting the attenuation coefficients from the energy range of X-rays (40–130keV) to the range of gamma quanta (511keV). This yields the attenuation that occurs along the LOR. LORs with higher attenuation factor more heavily in the computation than LORs with low attenuation. Brain acquisitions with and without attenuation correction are compared in Fig. 1.6, where emissions from superficial areas of tracer uptake undergo less attenuation.
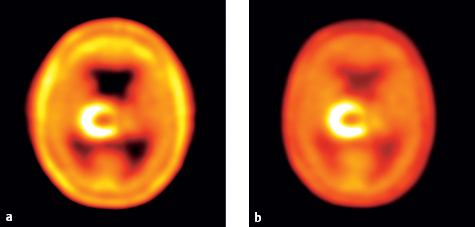
Fig. 1.6 a, b omparison of PET images with and without attenuation correction. Image of the brain after the intravenous injection of [11C]methionine (a) without and (b) with attenuation correction. Homogeneous uptake by brain tissue outside the tumor is accurately displayed in the attenuation-corrected image, but in the uncorrected image the lack of attenuation correction leads to its exaggeration in superficial tissue areas.
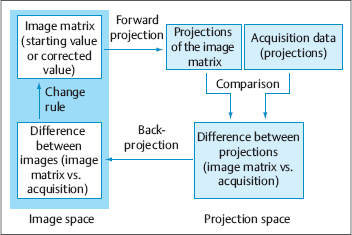
Fig. 1.7 Principle of iterative reconstruction. A starting value in image space is forward-projected into projection space. The difference between these forward projections and the acquired projections is evaluated and back-projected, and the starting value is corrected using a change rule to provide a new starting value for the next iteration.
Reconstruction of the Image Data
Correction of the data yields a dataset that, ideally, consists entirely of LORs with true coincidences. In the simplest case, images can be reconstructed from the corrected data by back-projection. The process of image acquisition—back-projection of the activity distribution to the detector elements at the proper angles—is reversed: the detector signals are projected into an empty data volume in accordance with the LOR angles, as described previously for CT (see above).
Filtered back-projection in PET increases the statistical noise component of the underlying raw data in the reconstructed image. Additionally, stellate artifacts may appear in areas that have large activity gradients. As an alternative, various statistical reconstruction methods are used and include iterative reconstruction algorithms, which come as standard equipment in modern PET systems.
The principle of iterative reconstruction is shown diagrammatically in Fig. 1.7. An image matrix is loaded with a suitable starting value (e.g., all values = 1), and the values are forward-projected to the individual detectors. These projections are then compared with the actual measured projections, and the differences are used to correct the image matrix. This process is repeated until the corrections fall below a threshold value or a specified number of iterations have been completed. Various implementations of this process are known, such as the OSEM algorithm (Hudson and Larkin 1994), an expanded version of the MLEM algorithm (Shepp and Vardi 1982).
Camera Design
In a “full-ring” PET system, a large number of detectors (6000–15000) are arranged cylindrically around the patient (Fig. 1.8) All modern scanners employ the “block detector” principle in which a certain number of individual crystals are arranged in blocks that are read by a small number of photomultipliers.
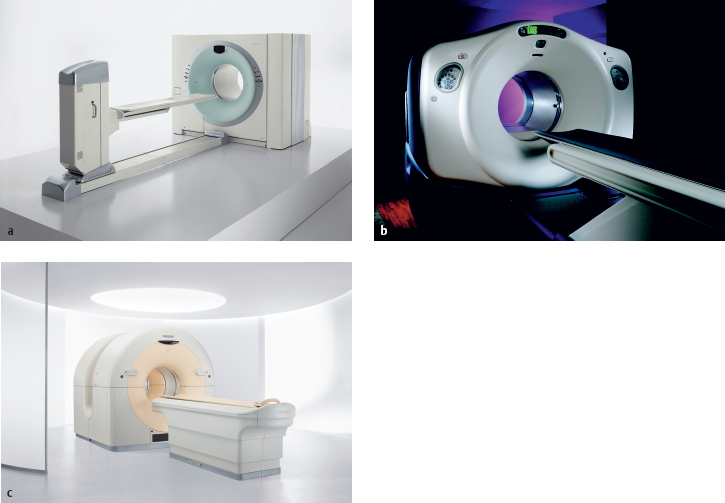
Fig. 1.8a–c Current high-performance PET-CT scanners (courtesy of the manufacturers).
a, b Hybrid design (Siemens Medical Solutions, General Electric Healthcare; see also Fig. 1.22).
c Open design (Philips Medical Systems) with variable separation of the PET and CT gantries to facilitate patient access.
The axial field of view (FOV) in this type of system is approximately 15cm, while the transaxial FOV is 60–70cm. Acquisitions are performed at discrete positions of the patient table as the table is advanced through the scanner in increments equal to the axial FOV. Data are acquired for 2–5minutes at each position.
The hybrid systems currently available for PET, which are based on the principle of conventional gamma cameras, are inferior to full-ring PET scanners. For equal acquisition times, the smaller spatial angle from which coincidences are detected and the limited count rates of these cameras result in fewer measurements per unit time and “poorer” images (Ak et al. 2001).
Performance Parameters
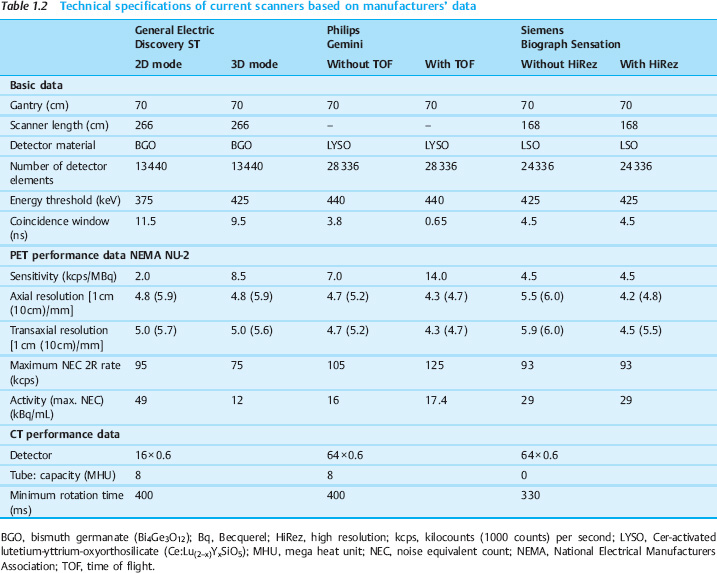
Besides giving a general description, it is customary to define the basic performance parameters of a PET system according to the NEMA protocol (National Electrical Manufacturers Association 2001). The most important of these parameters are explained here, and Table 1.2 compares them in scanners produced by different manufacturers:
- Spatial resolution: The spatial resolution of a PET system is limited because the positrons travel a certain distance from their emission site before they encounter an electron and are annihilated, and because the emission angle of the gamma quanta differs slightly from 180°. Also, because the individual detectors are of a finite size, the arrival site can only be determined to an accuracy of one-half the individual detector diameter. This detector-specific effect can be corrected to some extent by using a reconstruction process that enhances resolution (Tsui et al. 1988). A smaller number of measurements, or poorer count statistics, also has a negative impact on resolution.
- Sensitivity: The sensitivity of a system describes the number of events that are registered per unit activity. The higher this number, the better the image statistics. Once the optimum crystal material has been selected, sensitivity can be increased only by sacrificing resolution or increasing the number of scattered coincidences.
- Noise equivalent count rate: The NEC rate takes account not only of true coincidences but also of their relationship to noise from nontrue coincidences and statistical effects. This parameter depends both on scanner design and on individual patient geometry, and is determined using a reference phantom in system performance tests.
- Size of the patient aperture (gantry aperture): Unlike the above parameters, the gantry aperture is important for practical reasons. Examinations with the patient prone (e.g., for planning of radiotherapy) often require a fairly large patient aperture.
Combination of CT and PET
Combined PET-CT scanners are hybrid imaging systems based on a combination of two clinically proven modalities with a common software platform. Today PET scanners are no longer installed as stand-alone devices; they are always combined with CT. Fig. 1.8 shows several examples of commercially available PET-CT units.
Tunnel length. The tunnel length of a PET-CT scanner is approximately equal to the sum of the lengths of the two individual tunnels. The two modalities can be combined in a single gantry (Siemens, General Electric), or there may be separate PET and CT components that can function independently or can be linked together to form one system (Philips).
There is no problem with gamma rays entering the CT scanner, because the intensity of the gamma radiation is very low compared with the X-radiation.
Patient table. Patient table design is a challenge because the long tunnel requires a considerable length of unsupported table. Table deflection should be independent of the absolute table feed; otherwise there will be an imperfect “a priori match” between PET and CT over the full body length of the patient.
Attenuation correction. A significant remaining problem in all PET-CT systems is attenuation correction in thoracic imaging. Because the PET data are acquired over a period ofminutes, image smearing may occur due to respiratory and cardiac motion, whereas CT is largely free of motion artifacts. The CT attenuation values reconstructed for areas with high density gradients (lung/heart, lung/diaphragm) lead to a correspondingly high gradient in attenuation correction. Because of the limited resolution of PET (approx. 5–7mm) and the extent of respiratory excursions (up to 30mm), however, the actual attenuation changes in the PET data are considerably smaller (no gradient) in these same areas. As a result, the abrupt change of attenuation correction may lead to artifacts at contrasting interfaces such as the border of the lung. Image smearing can be reduced by respiratory gating of PET acquisitions (Nehmeh et al. 2002).
Radiation Safety
X-rays and gamma quanta are ionizing forms of radiation that produce various biological effects in tissues. The energy doses delivered to patients and staff in PET-CT are far below the 0.5Gy threshold dose for deterministic effects that cause the acute destruction of tissue. Hence, our observations on radiation effects will be strictly limited to stochastic effects such as carcinogenesis and genetic defects.
Radiation Safety for Patients
The stochastic radiation effects that occur in an organ are described by the effective dose and depend on:
- The energy deposited in the tissue due to interactions with ionizing radiation (energy dose)
- The type of radiation
- The sensitivity of individual tissue types
Radiation exposure in CT may occur to organs located directly in the path of the X-ray beam or may result from the scattering of radiation inside or outside the body.
The energy dose in CT depends on the current–time product (mAs), the kilovoltage (kV), and scanner-specific features. The dose is also indirectly affected by parameters such as slice thickness, object thickness, pitch factor, scan time, rotational speed, and FOV. These parameters make a certain minimum exposure inevitable due to the diagnostic imperative of obtaining high-quality images (Nagel 1999).
Dose index. The CT dose index (CTDI) is based on the dose actually measured within the X-ray beam of the scanner. It defines the relationship between the current–time product (mAs) and the energy dose (mGy). Usually the CTDI is measured once a year at the center and edge of the beam with a cylindrical CT phantom and entered in the scanner log for several kilovoltage values and slice thicknesses.
The proportion of the energy dose that arises from the radiopharmaceutical in use for the PET depends on the physical properties of the radioactive material and, especially, on its biokinetics, i.e., its distribution pattern and the time for which it is retained within the body. According to the MIRD (medical internal radiation dose) model (Siegel et al. 1999), the energy dose delivered to an organ is made up of the radiation exposure due to the accumulated activity within the organ itself (amount of activity, taking into account course over time) plus emissions from other organs, which again depend on the amount of accumulated activity and on how nearby these other organs are.
Converting energy dose to effective dose. To convert the energy dose (mGy) to the effective dose (mSv), the energy doses delivered to the organs in the radiation path are multiplied by tissue-weighting factors set down by regulatory bodies and added together.
Organ dose. Exact measurement of organ dose in CT and PET is a laborious procedure involving phantom measurements. For this reason, data on effective doses generally relate to standard patients under constant exposure conditions.
In imaging protocols with automatic exposure control (modulation of tube current according to patient anatomy), it must be remembered that different regions are scanned with a different current–time product, and so very different exposure conditions may obtain even within the same organ.
Effective dose. The effective dose is often compared for illustrative purposes with radiation exposure from natural sources. Natural exposure levels in Germany, for instance, range from approximately 1 to 6mSv at different locations and vary with lifestyle and dietary habits. The average natural exposure level is 2.1mSv (Bundesministerium für Umwelt, Naturschutz und Reaktorsicherheit [German Federal Ministry for Environment, Nature Conservation and Nuclear Safety] 2005, 2006).
Once a radiopharmaceutical agent has been injected, there are few ways to influence its distribution in the body. The patient’s exposure to radiation can be reduced to some extent by forced diuresis, for example, and copious fluid ingestion after the examination can further reduce exposure by accelerating the excretion of the radioactive substances.
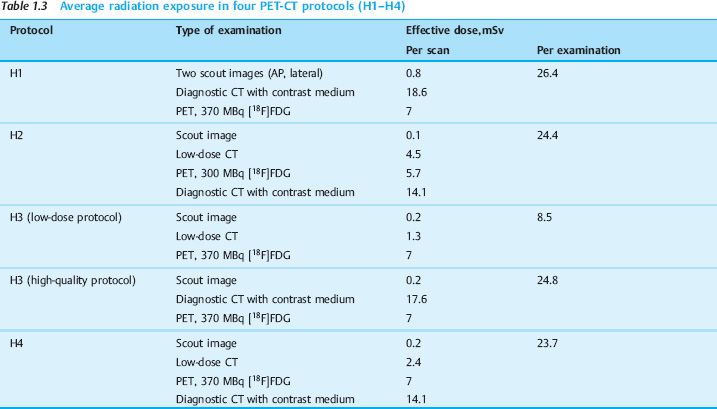
Typical radiation exposure. Table 1.3 lists typical imaging protocols for PET-CT examinations, which permit a reasonably accurate estimate of radiation exposure. Two basic imaging strategies are followed: the high-quality concept, which employs contrast-enhanced CT, and a low-dose concept in which noncontrast CT is used for automatic coregistration, anatomic correlation, and diagnostic interpretation.
The indicated radiation exposure levels are reference values; actual individual levels will vary: the administered doses, radiotracer biokinetics, and effective doses will differ from the values in Table 1.3 depending on the age and weight of the patient. Scanner models and equipment and imaging protocols will also affect radiation exposure in any given case.
Legal requirements. Before any patients undergoes PETCT, an individual risk-benefit analysis should be carried out. Duplicate examinations should be avoided. Each part of the PET-CT examination should be ordered by a physician certified for that particular modality.
In 2003, the German Federal Agency for Radiation Protection issued “diagnostic reference values” which established the technical parameters for PET-CT examinations (current settings, administered activities). These values are intended to ensure that the radiation exposure from the examination is no higher than absolutely necessary on the basis of current technology. The activity values stated for PET are also considered to be a lower limit, since the injection of insufficient activity may cause poor image quality, resulting in radiation exposure with no diagnostic benefit.
Radiation Safety for Personnel
The properties of both X-rays and gamma rays must be accounted for in the radiation protection of staff members involved in PET-CT examinations.
- X-rays: X-rays are emitted from the X-ray tube itself and from all scattering media within the FOV of the X-ray tube (detector, patient). X-rays are emitted only while the tube current is switched on.
- Gamma rays: All sites where radioactive materials are handled are also regarded as emission sites (dispensing area, patient waiting room after tracer injection, camera room). The radiopharmaceuticals release gamma radiation continuously, which decays at a variable rate according to the half-life of the radiotracer (usually 110minutes, 18F).
These boundary conditions form the basis for radiation safety measures in the practical operation of PET-CT systems, taking into account the penetrating power of the radiation: the half-value layer for lead shielding—the thickness of lead needed to reduce radiation intensity by one-half—is 0.1mm for X-rays (150kV, 2.5mm Al) and 4.5mm for gamma rays (511keV).
The shielding materials used for diagnostic X-ray films (including lead aprons) are of no practical value in PET imaging due to the penetrating power of gamma rays. This has given rise to a safety concept that includes structural radiation protection and puts special emphasis on organizational radiation protection (distance from radiation source and exposure time).
Two main types of staff contamination may occur during the use of radioactive materials: body contamination (radioactive materials adhering to the body surface) and the incorporation of radioactive materials into the body. The most effective way to avoid contamination is through the use of safe, clean working practices. Unsafe practices may result in contamination of the hand, leading to the ingestion of radioactive material. Consequently, staff are prohibited from eating or drinking within the PET-CT suite. Contamination and permeation (absorption of radioactive materials through the skin) can be prevented by wearing protective clothing (gown, protective gloves). The inadvertent transfer of radioactive materials is prevented by integrating the PET-CT control room, postinjection waiting room, radiopharmaceutical dispensing area, and preparation room into a controlled area.
References
Ak I, Blokland JA, Pauwels EK, Stokkel MP. The clinical value of 18FFDG detection with a dual-head coincidence camera: a review. Eur J Nucl Med 2001;28(6):763–778
Bailey DL. Quantitative procedures in 3D PET. In: Bendriem B, Townsend DW. The Theory and Practice of 3D PET. Dordrecht: Kluwer Academic Press; 1998
Beyer T, Townsend DW, Brun T, et al. A combined PET/CT scanner for clinical oncology. J Nucl Med 2000;41(8):1369–1379
Brix G, Lechel U, Glatting G, et al. Radiation exposure of patients undergoing whole-body dual-modality 18F-FDG PET/CT examinations. J Nucl Med 2005;46(4):608–613
Budinger TF, Gullberg GT, Huesman RH. Emission computed tomography. In: Herman GT (ed.). Image Reconstruction from Projections: Implementation and Application. Berlin: Springer; 1979:147–246
Bundesamt für Strahlenschutz. Bekanntmachung der diagnostischen Referenzwerte für radiologische und nuklearmedizinische Untersuchungen. Cologne: Bundesanzeiger; 2003
Bundesministerium für Umwelt, Naturschutz und Reaktorsicherheit. Umweltradioaktivität und Strahlenexposition (Jahresbericht 2004). Cologne: Bundesanzeiger; 2005
Bundesministerium für Umwelt. Naturschutz und Reaktorsicherheit. Unterrichtung durch die Bundesregierung. Umweltradioaktivität und Strahlenexposition im Jahr 2005. Drucksache 016/3084 2006. Cologne: Bundesanzeiger; 2006
Hudson HM, Larkin RS. Accelerated image reconstruction using ordered subsets of projection data. IEEE Trans Med Imaging 1994;13(4):601–609
Kalender WA. Computertomographie. Grundlagen, Gerätetechnologie, Bildqualität, Anwendungen. Erlangen, Munich: Publicis MCD; 2000
Lewellen TK. Time-of-flight PET. Semin Nucl Med 1998;28(3):268–275
Morneburg H (ed.) Bildgebende Systeme für die medizinische Diagnostik. Erlangen, Munich: Publicis MCD; 1995
Nagel HD, (ed.)d. Strahlenexposition in der Computertomographie. Frankfurt: ZVEI; 1999
National Electrical Manufacturers Association. NEMA Standards Publication NU 2–2001. Performance Measurements of Positron Emission Tomographs. Washington, DC: National Electrical Manufacturers Association; 2001
Nehmeh SA, Erdi YE, Ling CC, et al. Effect of respiratory gating on quantifying PET images of lung cancer. J Nucl Med 2002;43 (7):876–881
Pichler BJ, Bernecker F, Boning G, et al. A 4 x 8 APD array, consisting of two monolithic silicon wafers, coupled to a 32-channel LSO matrix for high-resolution PET. IEEE Trans Nucl Sci 2001;48:1391–1396
Pichler BJ, Judenhofer MS, Catana C, et al. Performance test of an LSO-APD detector in a 7-T MRI scanner for simultaneous PET/MRI. J Nucl Med 2006;47(4):639–647
Schulthess GK. Clinical Molecular Anatomic Imaging: PET/PET-CT and SPECT/CT. Philadelphia: Lippincott Williams & Wilkins; 2003
Shepp LA, Vardi Y. Maximum likelihood reconstruction for emission tomography. IEEE Trans Med Imaging 1982;1(2):113–122
Siegel JA, Thomas SR, Stubbs JB, et al. MIRD pamphlet no. 16: Techniques for quantitative radiopharmaceutical biodistribution data acquisition and analysis for use in human radiation dose estimates. J Nucl Med 1999;40(2):37S–61S
Surti S, Kuhn A, Werner ME, Perkins AE, Kolthammer J, Karp JS. Performance of Philips Gemini TF PET/CT scanner with special consideration for its time-of-flight imaging capabilities. J Nucl Med 2007;48(3):471–480
Tsui BMW, Hu HB, Gilland DR, Gullberg GT. Implementation of simultaneous attenuation and detector response correction in SPECT. IEEE Trans Nucl Sci 1988;35:778–783
Radiopharmaceuticals for PET
Kopka K.
Wagner S.
Modern radiopharmaceutical chemistry is an outgrowth of nuclear chemistry and classical radiochemistry. It is concerned with the development of methods for the production and quality control of radioactive products intended for use as radioactive agents (radiopharmaceuticals) in diagnostic and therapeutic procedures in nuclear medicine. Nuclear medicine examinations are noninvasive tests that measure the distribution of the radiopharmaceutical in the body using scintigraphic techniques such as planar scintigraphy, SPECT, and PET (Welch and Redvanly 2003; Ell and Gambhir 2004). The clinical applications of radiopharmaceutical chemistry have grown significantly during the past decade, owing in part to the development of new PET radiotracers and combined nuclear medicine and radiologic modalities such as PET-CT.
The production of radiopharmaceuticals must conform to all aspects of drug laws and radiation safety rules, especially those pertaining to drug transport, the peaceful use of nuclear energy and protection from its hazards, regulations on radiation protection, regulations on radioactive drugs and drugs treated with ionizing radiation, and drug manufacturing laws.
The basic principles of using radioactive isotopes in the human body were introduced by the Hungarian chemist Georg Karl von Hevesy (1885–1966), who developed the “radiotracer principle” (Hahn et al. 1937; Hevesy 1923, 1951). He was awarded the 1943 Nobel Prize for Chemistry for his work on the use of isotopes as tracers in studying chemical processes. Today we still use the term “radiotracers” for radioactive substances whose distribution in the body is determined by external measurement, although in modern pharmaceutical and legal parlance these agents are classified as radiopharmaceuticals.
Definition of Terms
Radiopharmaceuticals. Radiopharmaceuticals are the “meat” of modern nuclear medicine (Mather 2001). They are radioactive agents which spontaneously emit ionizing radiation that is utilized for diagnostic or therapeutic purposes.
PET radiopharmaceuticals. The radioactive agents in PET imaging are used purely for diagnostic purposes. Thus, an ideal radiopharmaceutical should behave like a tracer, i.e., it should label but not alter the in vivo biochemical processes of interest while allowing physiologic processes to be visualized.
Because the injected radiotracer dose is in the subphysiologic range (micrograms to picograms), PET tracers should not have pharmacodynamic activity. This satisfies the requirement for PET radiopharmaceuticals stated above.
Radiolabeling. A radiopharmaceutical consists of two main parts: a radioactive label and a tracer (carrier) molecule that delivers the radioactive label to the intended target (cell membrane, antigen, enzyme, receptor, transport system, RNA, etc.). Thus, in radiopharmaceutical chemistry as in pharmacology, biomechanisms are used as accumulation media to deliver the tracer molecule to the targeted tissue. Radiolabeling transforms the tracer molecule into a radiopharmaceutical. Depending on the type of radionuclide used (metal, halogen, physiologic element), the radiolabeling process often involves the insertion of chemical fragments (linkers, spacers) into the molecule and may require chemical modifications. In most cases the resulting precursor compounds can be directly radiolabeled to produce the desired radiopharmaceutical. The basic structure of a PET radiopharmaceutical is illustrated in Fig. 1.9.
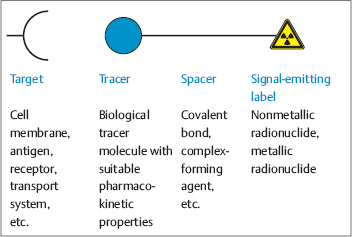
Fig. 1.9 Detection principle and structure of a PET radiopharmaceutical.
Positron (β+) emitters are used for the radiolabeling of PET tracers. Positron emitters are distinguished from their stable isotopes by the presence of a neutron deficit. By definition, an isotope has the same number of protons Z (atomic number) as a given element X but a different number of neutrons N and thus a different atomic mass A, although it is still the same chemical element (X). All isotopes of elements can be represented in nuclide notation as AZXN or AZX (since A–Z = N) or AX (since Z is defined by the chemical element X).
Authentic and analog labeling. When a stable chemistry as in pharmacology (e.g., biomolecule or pharmaceutical) is replaced by a positron-emitting isotope, its chemical structure remains the same as that of the precursor and it is called an authentically labeled PET radiotracer. Examples are [11C]methionine and [15O]water, in which the stable isotopes 12C or 13C and 16O have been respectively replaced by the positron emitters 11C and 15O.
In analog PET radiopharmaceuticals, on the other hand, the chemical structure is different from that of the precursor compound because radionuclides (foreign atoms such as 18F) or radionuclide-tagged residues (e.g., [18F]fluoroethyl) are introduced that were not present in the precursor. Despite the foreign label, however, it is still essential that the biological distribution (and pharmacokinetics) of the synthesized PET radiopharmaceutical is equal or at least similar to that of the precursor compound (or biological tracer). In extreme cases the structure–action relationship of the analog radiopharmaceutical product must be revalidated. The most familiar example of an analog PET radiopharmaceutical is 2-deoxy-2-[18F]fluoro-D-glucose ([18F]FDG). This molecule differs from the precursor compound (D-glucose) in that 18F has been substituted for an hydroxyl group (OH group).
Specific activity. Specific activity (AS) is an important quantity for characterizing a radiopharmaceutical. It is defined as the activity A of a radioactive substance divided by the amount of material n or the mass m of the material in which it is contained (AS = A/n or A/m). Specific activity describes how muchradioactivity is present in, say, 1 μmol of a radiopharmaceutical compound. It should be noted that the corresponding positron emitter is only theoretically incorporated into each radiopharmaceutical molecule. In practice, however, the radiopharmaceutical product always contains molecules that have the same chemical structure as the radioactive drug but carry a stable isotope in place of the positron emitter. As a result these molecules are not radioactive, and so they reduce the specific activity of the radiopharmaceutical.
If a radiolabeling reaction begins with the substance [11C]carbon dioxide, for example, it is inevitable that this compound will also contain traces of the stable isotope [12/13C]carbon dioxide. Ultimately this will yield a molecule that is chemically identical to the radiopharmaceutical but not radioactive, thus causing a decline in specific activity. The chemically identical but nonradioactive molecules in this produce are called carriers. To avoid therapeutic side effects, the radiopharmaceutical (in this case the PET receptor ligand) must have a high specific activity, particularly in studies of receptors. Producing a radio-pharmaceutical with a minimum of carrier is important to avoid saturating the receptors with nonradioactive molecules that would cause a low ratio of specific signal (target) to background signal. Radioligands of high specific activity are used to assess receptor concentrations in the target tissue (Bmax) and to determine the dissociation constant (Kd). These parameters are obtained with the Scatchard plot, in which the ratio of the concentration of bound and free radioligands is plotted against the concentration of bound radioligands (Scatchard 1949).
Radionuclide Production
The first step in producing a PET radiopharmaceutical is production of the PET radionuclide. The second step is a radiochemical synthesis in which a metabolically active compound is tagged with the radionuclide.
Radionuclides. The principal radionuclides for PET include the neutron-poor isotopes carbon-11 (11C), nitrogen-13 (13N), oxygen-15 (15O), and fluorine-18 (18F). In addition to the stable isotopes of carbon, nitrogen, and oxygen, which occur ubiquitously in vivo, the less common element fluorine is represented by an important PET nuclide. The radionuclides listed in Table 1.1 have physical half-lives ranging from 2.03 to 109.7minutes.
The short half-lives of these radionuclides greatly limit their availability. With the exception of 18F, which has the longest half-life of these PET nuclides and can even be delivered to departments that do not have in-house production, the other three PET nuclides have to be produced on site (i.e., in proximity to the PET-CT examination room). Gallium-68 (68Ga), which has a half-life of 1.13hours, is discussed elsewhere.
Cyclotron. Radionuclides are produced in special particle accelerators called cyclotrons (Fig. 1.10). The particles to be accelerated (e.g., hydride ions H− or deuterium ions D−) are produced by ionization of the corresponding gas (e.g., hydrogen H2 or deuterium D2) in the ion source of the cyclotron and are injected into the high-vacuum tank. On entering the tank, these anions are accelerated by pairs of electrodes (“dees”) connected to a high-frequency alternating voltage and by a magnetic field applied perpendicular to the electrodes.
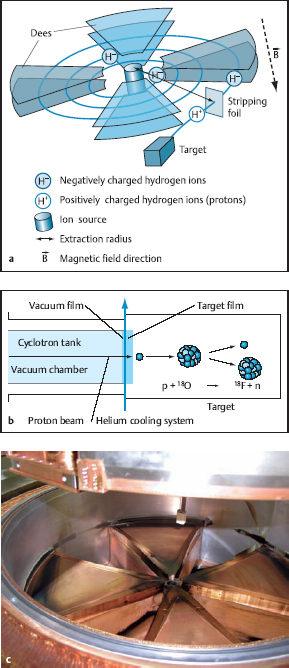
Fig. 1.10a–c Production of the radionuclide [18F]fluoride (courtesy of J. Eckardt).
a Principle of the cyclotron.
b Nuclear reaction in the target.
c Opened cyclotron tank.
This polarity reversal deflects the particles out of the accelerator, where they collide with the target system. The target chamber is filled with compounds of stable isotopes, which may be in a solid, liquid, or gaseous state. The accelerated particles undergo nuclear reactions with these compounds, which yield the desired PET nuclides. For example, the interaction of an accelerated proton p with oxygen-18 causes a nuclear reaction in which a neutron is emitted and the PET nuclide 18F is formed (Fig. 1.10). The compact notation for this nuclear reaction is 18O(p,n)18F. In practice, the target is filled with 18O-water, which gives rise to the nuclear reaction [18F]F-. Thus, the PET nuclide 18F is produced in the form of fluoride dissolved in 18O-water and is available in that form for producing the PET radiopharmaceutical. Table 1.1 lists other nuclear reactions for producing the most important PET radionuclides, their half-lives, the energy of the emitted positrons (β+), and the gamma ray energy arising from positron annihilation.
PET Radiopharmaceuticals
2-Deoxy-2-[18F]Fluoro-D-Glucose
Uptake mechanisms
Since it was first used in vivo (Gallagher et al. 1978), the metabolic radiotracer 2-deoxy-2-[18F]fluoro-D-glucose ([18F]FDG) has been the most widely used PET radiopharmaceutical. Today it is used chiefly for tumor imaging and especially to estimate glucose consumption in malignant lesions. Other applications are the assessment of myocardial viability and neurologic investigations. The intracellular accumulation of FDG initially mirrors the uptake of natural D-glucose. FDG enters the cells through active stereospecific transport by glucose transporter proteins and is then phosphorylated to 2-deoxy-2-fluoroglucose-6-phosphate (FDG-6-P) by the enzyme hexokinase.
Glucose transporters. There are various isoforms of glucose transporters (GLUT-1 to GLUT-7, GLUT-10 to GLUT-12) and four hexokinases, which show varying distributions in the body (Smith 2000). The GLUT-1 transporter and hexokinase II are the best-known subtypes with regard to glucose metabolism in tumor cells (Mamede et al. 2005). Glucose uptake in myocardial cells is controlled by the GLUT-4 transporter in addition to the dominant transporter GLUT-1 (Southworth et al. 2002). The GLUT-3 transporter also plays a role in brain tissue (Pauwels et al. 1998).
Metabolism of FDG. Unlike phosphorylated D-glucose, FDG-6-phosphate is not a substrate for glycolysis and so it is not catabolized in the same way as D-glucose. This is because the conversion to D-fructose-6-phosphate by the enzyme phosphoglucose isomerase requires an oxygen atom at the C-2 position. From the standpoint of PET, then, FDG-6-P is a terminal metabolite that accumulates within the cell (Brock et al. 1997). This mechanism of intracellular FDG accumulation (transport and phosphorylation) is also known as “metabolic trapping.”
At the same time, MR-spectroscopic studies with large (millimolar) amounts of nonradioactive 19F-FDG have shown that in some tissues such as brain and heart, FDG-6-P is metabolized to products that include 2-de-oxy-2-fluoro-D-mannose-6-phosphate (Brock et al. 1997). Also, glucose-6-phosphatase can dephosphorylate FDG-6-P, causing poor accumulation of FDG in the target tissue. Thus, FDG accumulation is high in tissues that have a low intracellular glucose-6-phosphatase concentration, such as brain and heart. Conversely, the higher concentration of glucose-6-phosphatase in liver and bowel leads to only a scanty accumulation of FDG (Pauwels et al. 1998).
FDG metabolism in tumor tissue. Dephosphorylation by glucose-6-phosphatase has a negligible effect on intracellular FDG accumulation in tumor tissue, where anaerobic glycolysis is predominant. Glucose transporter proteins (especially GLUT-1) are strongly expressed in tumors due to the increased glucose requirement of tumor cells (Chung et al. 2004). This has the effect of increasing FDG transport and hexokinase activity compared with normal tissue. The mechanism of the intracellular accumulation of [18F]FDG is illustrated in Fig. 1.11.
More than 80years ago, the Nobel laureate Otto Warburg described how increased glucose consumption in tumors can compensate for the inefficiency of anaerobic glycolysis (Warburg et al. 1924).
Production
Today the short-lived positron emitter 18F is used in the chemical form of [18F]fluoride for the production of [18F] FDG. In the pharmaceutical sense, this radioactive precursor compound is already a radiopharmaceutical because it is used for radiolabeling the pharmaceutical precursor compound 1,3,4,6-tetra-O-acetyl-2-O-trifluorome-thane-sulfonyl-β-D-mannopyranose (mannose triflate), which is the precursor of the pharmacologically active component. The radiosynthesis of [18F]FDG is shown in Fig. 1.12. After the labeling reaction, [18F]FDG is prepared in isotonic solution as an injectable radiopharmaceutical ready for clinical use. All the chemicals necessary for the production of [18F]FDG are commercially available in reagent kits (Fig. 1.13).
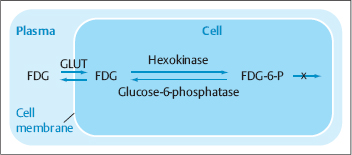
Fig. 1.11 Mechanism of intracellular uptake of [18F]FDG (“metabolic trapping”).
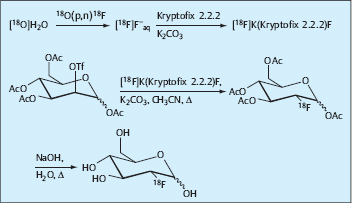
Fig. 1.12 Radiosynthesis of 2-deoxy-2-[18F]fluoro-D-glucose ([18F]FDG).
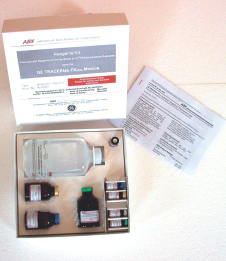
Fig. 1.13 Reagent kit for the synthesis of [18F]FDG (courtesy of ABX Advanced Biochemical Compounds GmbH).
The radionuclide 18F decays by positron emission. Due to the energy-rich gamma quanta (Eγ=511keV) that arise from positron annihilation, radiation safety rules require that special precautions be taken to minimize staff exposure. For this reason, [18F]FDG is produced by a fully automated process in shielded lead cells, usually under clean-room conditions (Fig. 1.14). Automation of the production process, including automated dispensing of the product into vials, is an important safety stratagem that also contributes to quality assurance. Since [18F]FDG has a physical half-life of 109.7minutes, the automated processes in its radiosynthesis are made fast, efficient, and reproducible.
Besides following radiation safety rules, the production of a radiopharmaceutical product should also conform to Good Manufacturing Practice (GMP) guidelines, which must be modified as needed when applied to radiopharmaceutical chemistry.
As an aid to understanding the methodology of radiopharmaceutical production in practice, the steps involved in the synthesis of [18F]FDG are described below in greater detail.
Radionuclide production. [18F]fluoride is produced in the cyclotron in the no-carrier-added (nca) state. The nca [18F]fluoride is dissolved in 18O-water (>97.5% enrichment of 18O) after its production. At this stage it has a theoretical specific activity of 6.33×10¹⁹ Bq/mol and is used as a radiopharmaceutical precursor for the radiosynthesis of [18F]FDG.
With an accelerated proton energy of 11MeV, an irradiation time of less than 60minutes, a target volume of 1mL, and a target current of 35μA, the activity produced is equal to 37GBq (=1Ci).
Radiosynthesis. Radiolabeling of the pharmaceutical precursor compound is conducted automatically in a synthesis unit under software control (Figs. 1.14 and 1.15). The synthesis units are closed systems in which the lead cells are shielded on all sides (lead shielding 75mm thick). The [18F]fluoride is separated from the irradiated 18O-water with an anion exchange resin and is vacuumdried. The nucleophilia of the [18F]fluoride is increased with large cations (e.g., tetrabutylammonium cation [Bu4N+] or potassium-aminopolyether [K+-Kryptofix 2.2.2], and it is reacted with the pharmaceutical precursor compound 1,3,4,6-tetra-O-acetyl-2-O-trifluorome-thane-sulfonyl-β-D-mannopyranose (mannose triflate). This is a nucleophilic substitution reaction of the SN2 type (Hamacher et al. 1986). After the nucleophilic fluorination reaction, in which the triflate group is replaced by 18F, the acetyl protection groups of the intermediate product are removed by hydrolysis (Fig. 1.12). The reaction solution, which now contains the actual radiophar-maceutical, is purified by passing it through a cartridge system that contains anion and cation exchange resins, aluminum oxide, and reverse-phase resins. Next the purified solution is prepared in the form of a physiologic injection solution. Generally the labeling yield of [18F]FDG is 50% of the initial radioactivity.
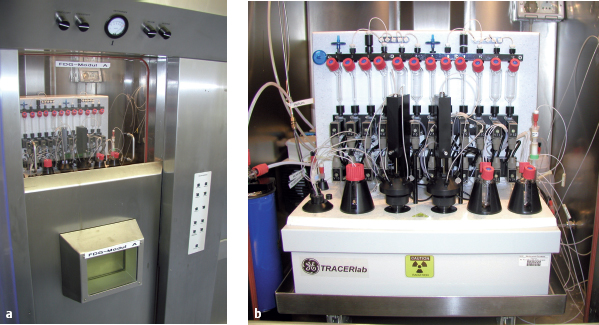
Fig. 1.14a, b Remote-controlled [18F]FDG synthesis unit (PET Center, Münster).
a Shielded lead cell for radiation safety.
b [18F]FDG synthesis unit, with a capacity for twice-daily production runs.
Dispensing the radiopharmaceutical. Finally the injection solution containing the [18F]FDG is automatically or semi-automatically dispensed into sterile glass vials through a rubber septum (Fig. 1.16). This should be done in accordance with the “Supplementary Guideline for the Production of Radiopharmaceuticals and Sterile Products” from the GMP guidelines.
Quality control according to the European Pharmacopoeia. The product batch is released for clinical use as described in the guidelines of the European Pharmacopoeia monograph on [18F]fluorodeoxyglucose injection solutions (5th edition, 2005, 5.0/1325). Rapid quality tests include determining the pH and osmolality of the injection solution, testing for chemical and radiochemical impurities, and testing for radionuclide purity. Sterility testing takes 1–2weeks, so it is done only after the injection solution has been administered and its activity has decayed. Similar considerations apply to testing for pyrogenic constituents. Subsequently the batch is released for use, even before all quality aspects have been fully tested (parametric release).
Selected PET Radiopharmaceuticals
While [18F]FDG is widely used for cardiologic, oncologic, and neurologic indications, it has high sensitivity but low specificity in differentiating between benign and malignant lesions, for example. The need for more discriminating clinical applications prompted the development of new, more specific PET radiotracers. Some important representatives of this group are described below (Meyer et al. 1995; Table 1.4).
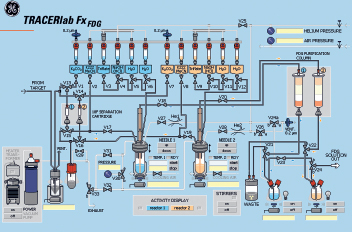
Fig. 1.15 Circuit diagram of an automated [18F]FDG synthesizer (courtesy of GE Healthcare).
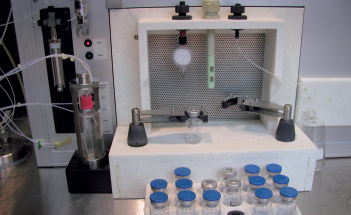
Fig. 1.16 Aseptic transfer of [18F]FDG to sterile glass vials through a rubber septum.
| Radionuclide | Radiopharmaceutical | Clinical applications |
| 18F | [18F]FDG (2-deoxy-2-[18F]fluoro-D-glucose) 18F -FDOPA (6-[18F]fluoro-L-DOPA) [18F]Sodium fluoride |
|
| 11C | L-[S-methyl-11C]-methionine Sodium-[1–11C]acetate ([11C]acetate) [methyl–11C]trimethyl-2- hydroxyethylammonium ([11C]choline) S-[O-methyl-11C]-3,5-dichloro-N-[(1-ethyl-2-pyrrolidinyl)]- methyl-2-hydroxy-6-methoxybenzamide [O-methyl–11C]-raclopride |
|
| 13N | [13N]ammonia ([13N]NH3) |
|
| 15O | [15O]water ([15O]H2O) |
|
6-[18F]fluoro-L-DOPA
Presynaptic neurons in the striatum. 6-[18F]Fluoro-L-DOPA is a radiolabeled analog of L-DOPA that is used to investigate the central dopaminergic functions of presynaptic neurons in the corpus striatum (Heiss and Hilker 2004). PET imaging with 6-[18F]fluoro-L-DOPA visualizes natural L-DOPA transport into the neurons, the decarboxylation of L-DOPA, and also dopamine storage capacity. 6-[18F] Fluoro-L-DOPA is converted by the enzyme L-DOPA decarboxylase into 6-[18F]fluorodopamine, which is retained in the striatum. Primary metabolic byproducts of 6-[18F]flu-oro-L-DOPA are 6-[18F]fluoro-3-O-methyl-L-DOPA (by reaction with catechol-O-methyltransferase [COMT]) and 3,4-dihydroxyl-6-[18F]fluorophenylacetic acid (by reaction with monoaminoxidase [MAO]).
Endocrine gastrointestinal tumors. 6-[18F]fluoro-L-DOPA has also been used in oncology for the detection of endocrine gastrointestinal tumors (Hoegerle et al. 2001).
Synthesis. 6-[18F]fluoro-L-DOPA can be radiosynthesized by either electrophilic or nucleophilic aromatic substitution. The regioselective electrophilic fluorodemetalation of a trimethylstannyl precursor—such as 4,5-di-[(1,1-di-methylethoxycarbonyl)oxy]-N-formyl-2-trimethylstannyl-L-phenylalanine—is among the most familiar processes in which [18F]F2 is used (de Vries et al. 1999; Fig. 1.17). The radiochemical precursor [18F]acetylhypofluorite can also be used for electrophilic fluorination (Adam et al. 1986). Another option is a multistep synthesis that begins with the nucleophilic replacement of an aromatic trimethylammonium group by [18F]fluoride (Lemaire et al. 1994; Zhang et al. 2002). The no-carrier-added nucleophilic reaction with [18F]fluoride has a radiochemical yield of 23% (Lemaire et al. 1994), and the product compound has a higher specific activity than the carrier-added electrophilic variant.

Fig. 1.17 Radiosynthesis of 6-[18F]-fluoro-L-DOPA with electrophilic aromatic substitution.
[18F]Sodium Fluoride
Applications. [18F]sodium fluoride dissociates in blood into sodium cations (Na+) and [18F]fluoride anions (18F−). [18F]fluoride was first described as a potential bone tracer over four decades ago (Blau et al. 1962). The bone uptake of [18F]fluoride is based on its ion exchange with hydroxide ions (OH−) in the bone mineral hydroxyapatite (Ca5(PO4)3OH). This reaction yields [18F]fluoroapatite ([18F] Ca5(PO4)3F), leading to the incorporation of [18F]fluoride into the bone. Increased [18F]fluoride uptake reflects an increase in regional blood flow and bone turnover like that seen in association with malignant bone lesions and osteoblastic activity. Thus, [18F]sodium fluoride PET-CT is a highly sensitive and specific imaging study for the detection of skeletal metastases in patients with prostate cancer (Even-Sapir et al. 2006).
Synthesis. [18F]Fluoride is produced directly in the cyclotron target by the irradiation of 18O-water. It is then separated from the 18O-water by adsorption on anion exchange resins. The desorption of [18F]fluoride from the resin with isotonic NaCl solution yields [18F]sodium fluoride in physiologic solution.
[11C]Methionine
Applications. [11C]Methionine (L-[S-methyl–11C]-methionine) is one of the most widely used radiolabeled amino acids for PET imaging. It is used for imaging tumors of the brain, head, neck, lungs, and breast (Schober et al. 1985; Kubota et al. 1996) and in the diagnosis of parathyroid adenomas (Beggs and Hain 2005). One disadvantage is a high tracer uptake in the liver, pancreas, and bowel, which may be a problem in intra-abdominal imaging. Another drawback is that renal excretion can hamper the visualization of bladder and prostate tumors. The rapid tracer uptake in tumor tissue reflects the active transport of the amino acid into tumor cells more than it reflects the protein synthesis rate of these cells (Schober et al. 1987; Ishiwata et al.1993).
Synthesis. [11C]Methionine is produced from the synthon [11C]iodomethane, which arises from the [11C]carbon dioxide available in the cyclotron gas target, and from NaOH (soda lye) and L-homocysteine thiolactone or L-homocysteine (Comar et al. 1976). A newer, “milder” method uses potassium fluoride on aluminum oxide (Al2O3/KF) instead of NaOH for the activation of L-homocysteine (Schmitz et al. 1995). Fig. 1.18 shows the options for synthesizing [11C]methionine with a time-corrected radiochemical yield of 50%–90% and a specific activity of 2–40 GBq/μmol.
Sodium-[1-11C]Acetate
Metabolism. Acetate undergoes a rapid intracellular uptake and enzymatic conversion to cytosol and also to acetyl coenzyme A (acetyl-CoA) in the mitochondria. Acetyl-CoA is a building block in the synthesis of cholesterol and fatty acid, lipophilic biomolecules that can be incorporated into cell membranes (Howard and Howard 1975). Additionally, acetyl-CoA is metabolized in the citric acid cycle to water and CO2 in the mitochondria. This is the main pathway by which acetate is broken down in the myocardium, whereas tumor cells mainly use acetate for fatty acid synthesis catalyzed by fatty acid synthetase, which is overexpressed in tumor cells (Swinnen et al. 2000).
Application. [11C]Acetate is used in PET as a surrogate parameter for studying oxidative metabolism and regional blood flow in the myocardium (Visser 2001). It is also a potential tracer for the visualization of tumors in the kidney, pancreas, and prostate (Schöder and Larson 2004).
Synthesis. [11C]Acetate is usually synthesized by the conversion of [11C]carbon dioxide with methyl magnesium bromide to diethylether or tetrahydrofuran. The injectable solution is produced by hydrolysis and purification of the raw product and formulation with saline solution (Pike et al. 1982; Ph. Eur. 5; Fig. 1.19).
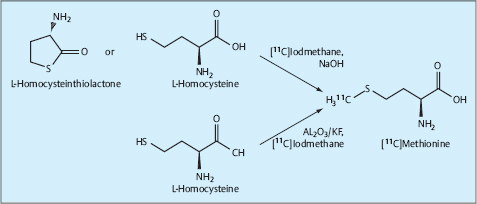
Fig. 1.18 Radiosynthesis of 11C methionine.

Fig. 1.19 Radiosynthesis of sodium-[1–11C]acetate.
[11C]Choline
Metabolism. Choline is an important constituent of cell membrane phospholipids. Malignant tumors are characterized by an increased proliferation rate and increased metabolism of cell membrane components, which is associated with an increase in choline accumulation. Choline is phosphorylated in tumors by the enzyme choline kinase into phosphorylcholine and is finally incorporated into phospholipids (e.g., phosphatidylcholine) (Podo 1999). Metabolic byproducts include betaine, which is formed by oxidation with choline and betaine aldehyde dehydrogenase, and acetylcholine, which is formed by acetylation with choline acetyltransferase (Roivainen et al. 2000).
Applications. [11C]Choline ([methyl–11C]-trimethyl-2-hydroxyethyl ammonium) is used as a PET radiotracer for the detection and differential diagnosis of brain tumors as well as prostate, lung, and esophageal cancer (Hara 2002, Tian et al. 2004). It is also used in treatment planning for prostate cancer (Weckesser et al. 2004). 18F-labeled choline derivatives are also available for these investigations (Schöder and Larson 2004).
Synthesis. 2-Dimethylaminoethanol is used as a precursor in the synthesis of [11C]choline by reacting it with [11C] iodomethane or [11C]methyl triflate. The time-corrected radiochemical yield is 60%–85% (Zheng et al. 1004) with a specific activity of 11.1GBq/μmol (Rosen et al. 1985). Because it is an ammonium cation, [11C]choline can be collected in aqueous solution following evaporation of the reactants and separated with cation exchange resins (Hara et al. 1997).
[11C]Raclopride
Applications. [11C]Raclopride is a dopamine-D2
Stay updated, free articles. Join our Telegram channel

Full access? Get Clinical Tree


 Both CT and PET use electromagnetic radiation to produce an image.
 All the attenuation values measured along one scan line are called a projection. By parallel, line-by-line back-projection, a strip image is produced.
 A whole spectrum of images with different contrasts can be reconstructed from a single raw dataset.
 In spiral CT scanning, the table is advanced continuously during data acquisition.
 The smaller the table feed, the more accurate the approximation.
 In multislice scanners, the slice thickness for image reconstruction can be manipulated after the data acquisition.
 The maximum table feed during one complete detector rotation is equal to two slice thicknesses.
 The ratio of table speed to slice thickness is called the “pitch.”
 Detail resolution, acquisition time, and imaging volume are in competition with each other.
 Random and scattered coincidences and tissue-dependent attenuation adversely a fect the quality of PET images.
 PET systems with modified gamma cameras do not match the image quality of full-ring scanners.
 Modern PET systems are generally combined with a CT scanner.
 The energy doses from PET/CT are far below the threshold dose for deterministic radiation effects.
 Safety standards for PET/CT have been officially established in the form of “diagnostic reference values.”
 Lead aprons and other shielding materials used in conventional radiography are not effective in PET-CT.
 The production of radiopharmaceuticals must comply with pharmaceutical laws and radiation protection standards.
 PET radiopharmaceuticals should label physiologic processes without altering them.
 PET tracers are administered in doses (namely trace amounts) that are too small to be pharmacologically active.
 In the radiolabeling of drugs, a distinction is made between authentically labeled and analogously labeled radiopharmaceuticals.
 Positron emitters are produced in a cyclotron and used for the no-carrier-added radiosynthesis of PET radiotracers.
 A high specific activity is particularly important in receptor studies.
 The intracellular accumulation of [18F]FDG is also termed “metabolic trapping.”
 [18F]FDG is synthesized by nucleophilic substitution (SN2 type) from [18F] fluoride and mannose triflate.
 6-[18F]Fluoro-L-DOPA is used to investigate the dopaminergic functions of presynaptic neurons in the striatum.
 [18F]Fluoride is used in the detection of skeletal metastases.
 [11C]Methionine is used to image tumors of the brain, head, neck, lungs, and breast as well as parathyroid adenomas.
 [11C]Acetate is used mainly to study oxidative metabolism and regional blood flow in the myocardium.
 [11C]Choline is used in the diagnosis of brain tumors, and of prostate, lung, and esophageal cancer.
 [11C]Raclopride is a dopamine D2-receptor antagonist.