![]() To recognize abnormal patterns in spectral Doppler waveforms associated with various disease states.
To recognize abnormal patterns in spectral Doppler waveforms associated with various disease states.
![]() To learn potential techniques for the elimination of aliasing.
To learn potential techniques for the elimination of aliasing.
KEY TERMS
Flow disturbance
Laminar flow
Point of maximum stenosis
Reynolds’ number
Spectral broadening
Turbulence
ARTERIAL FLOW PATTERNS
Blood flow through normal conduit arteries is laminar in nature, meaning that it flows in layers. As discussed in earlier chapters, laminar flow occurs because this arrangement is the most energy-efficient way for blood to move through a vessel. In laminar flow, the layers with the slowest velocities are present near the vessel walls and the fastest velocities reside in the center of the vessel lumen. As atherosclerotic disease progresses, plaque buildup restricts the vessel lumen. Plaque buildup forms a mechanical obstruction within the artery and alters blood flow patterns within the vessel. Initially, the developing plaque creates areas of eddying (helical flow) and pooling of blood, causing mild flow disturbance. Flow disturbance, or disturbed flow, is generally accepted to mean a shift away from purely laminar flow, but without the energy losses associated with turbulence. Disturbed flow usually reverts readily back to purely laminar flow after the area causing the disturbance is passed. As long as overall laminar flow is maintained, there is minimal energy loss and pressure is maintained throughout the vessel as well as downstream (Figure 8-1).
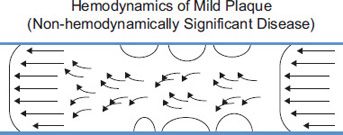
FIGURE 8-1. Blood flow through an artery with mild atherosclerotic disease shows the presence of eddy currents and a greater range of velocities, all associated with mild flow disturbance.
MILD FLOW DISTURBANCE
Both spectral Doppler and color flow imaging depict mild flow disturbance as an increased range of velocities present within the sampled volume. In spectral Doppler, this is manifested by a “filling in” of the spectral window, often described as spectral broadening (Figure 8-2). However, the peak velocities throughout the vessel remain within the normal range because plaque buildup is not sufficient to create a significant reduction of flow volume through the conduit vessel.
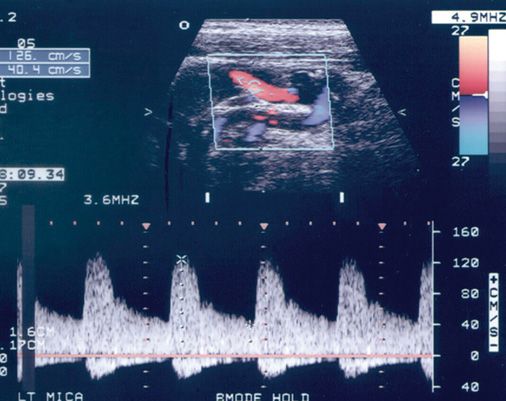
FIGURE 8-2. Filling in of the spectral window, often described as spectral broadening is demonstrated in this internal carotid artery with non-hemodynamically significant atherosclerotic disease. Note the small amount of reverse flow seen below the baseline.
The measured velocities associated with a “normal velocity range” depend upon the artery. Several well-accepted tables exist for the grading of stenosis of the internal carotid artery, for example, which can be used to compare peak systolic and end-diastolic velocities obtained by spectral Doppler. Elsewhere in the body, upstream and downstream velocities are compared with the velocity in the area being interrogated to determine whether the velocity is normal or abnormal.
Disease with no elevated velocity flow is usually categorized as “mild” or “non-hemodynamically significant.” Color flow imaging depicts non-hemodynamically significant disease with inverted color along the vessel walls and sometimes in the center of the vessel, depending on the locations of plaque formation (Figure 8-3). Inverted color depicts small areas of retrograde flow from eddy currents.
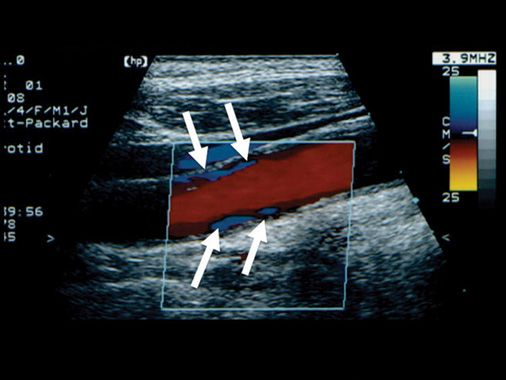
FIGURE 8-3. Color flow imaging depicts flow disturbance in non-hemodynamically significant disease as areas of inverted color (blue) along the vessel walls, and sometimes in the center of the vessel, depending on the locations of plaque formation (arrows).
Flow disturbance and the resultant spectral broadening are frequently present in normal arteries in certain circumstances, such as within a curved vessel, at or near a bifurcation, and where the arterial diameter changes (e.g., carotid bulb). Therefore, spectral broadening is nonspecific for the identification of disease or the estimation of its severity (Figure 8-4).
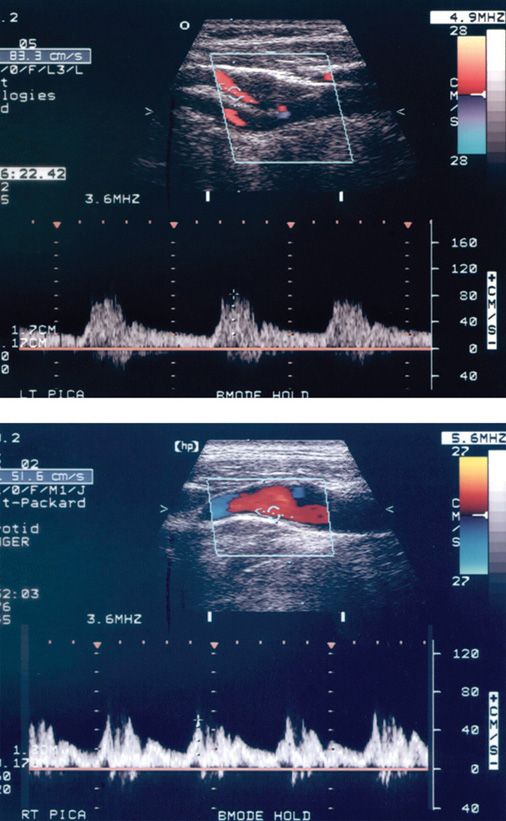
FIGURE 8-4. Two examples of flow disturbance within the normal carotid bulb. The eddy currents are indicated by areas of blue in the color flow image. Spectral broadening is present in each case. Note that the samples are taken off-center in the vessel in order to capture the highest velocity. In practice, the sample is moved back and forth across the vessel lumen until the highest forward velocity is identified.
FLOW-LIMITING ARTERIAL STENOSIS
As the plaque enlarges, the remaining luminal area decreases. To compensate for the smaller effective lumen diameter, blood velocity must increase through the narrowed region in order to maintain the same flow volume through the vessel. Blood velocities become greater as the obstruction becomes more severe. Normal arterial velocities are typically in the range of 30–125 cm/s. In severe stenosis, velocities may exceed 500 cm/s. As high-velocity flow exits, the stenotic region, turbulence, occurs. Turbulence is characterized by the complete loss of laminar flow and movement of blood cells which is often at right angles or even 180 degrees to the axis of the vessel. Turbulent flow is sometimes described as chaotic flow.
The elimination of ordered laminar flow results in higher energy losses from friction, causing decreased pressure downstream from the point of stenosis. The initiation of turbulence in response to increasing velocity varies from patient to patient and from lesion to lesion. Factors that contribute to turbulence formation include viscosity of the blood, vessel diameter, velocity and direction of the stenotic jet, length of the stenotic region, and roughness of the surface of the plaque. These factors are combined in a dimensionless metric called Reynolds’ number, which predicts the onset of turbulence in arterial stenosis. A Reynolds’ number of around 2000 is generally considered necessary to cause turbulence; however, this is not universally true. Under certain conditions, turbulence may occur at Reynolds’ numbers less than 2000 and conversely, laminar flow can be maintained at higher values.
Doppler interrogation of the diseased artery can yield several different characteristic waveforms, depending on the spatial relationship between the sampled location and the stenotic region. If the point of maximum stenosis can be identified and sampled, abnormally high velocities are apparent (Figure 8-5). Immediately distal or downstream from the stenosis, turbulent flow is punctuated by the presence of a high-velocity jet extending some distance downstream from the stenosis (Figure 8-6). The high-velocity jet may extend along an axis parallel to the vessels walls, but is often generated along a completely different direction. Color flow imaging may help delineate the true spatial composition of the high-velocity jet.
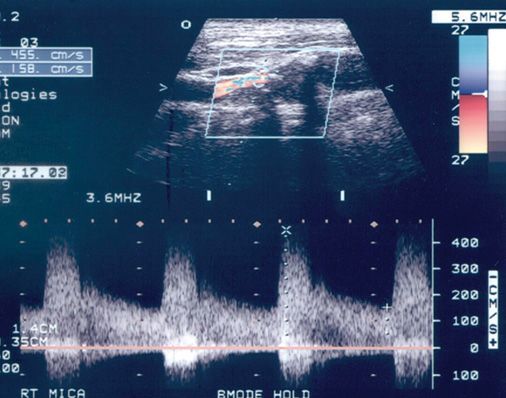
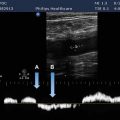
FIGURE 8-5. Doppler sample at the point of maximum stenosis showing peak systolic velocity of over 400 cm/s.
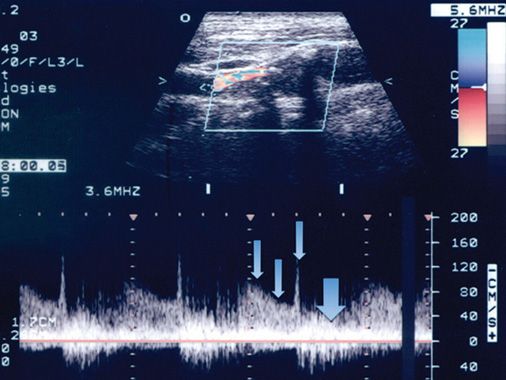
FIGURE 8-6. Doppler sample obtained immediately distal, or downstream from the stenosis, demonstrating an area of turbulent flow (large arrow) and a portion of the high-velocity jet (small arrows) extending from the stenosis for some distance downstream within the vessel.
The turbulent flow may extend for a considerable distance downstream. For example, stenosis of the renal artery at its origin may result in turbulence which extends the entire length of the renal artery. When the stenosis becomes severely flow-limiting, resistance to flow is increased at the point of obstruction. This becomes apparent in the form of decreased diastolic flow in Doppler samples acquired proximally or upstream from the stenosis (Figure 8-7).
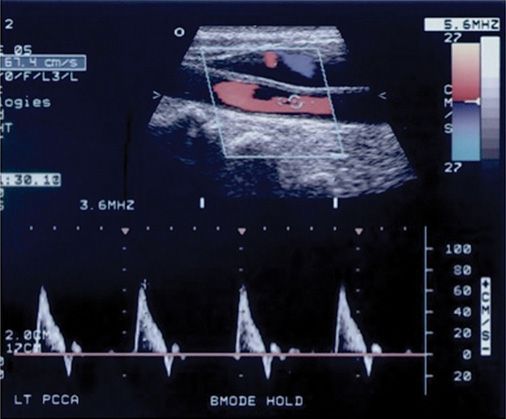
FIGURE 8-7. Decreased diastolic flow in this common carotid artery is seen proximal to (upstream from) the point of maximal stenosis. This is a result of increased resistance in the vessel caused by the downstream stenosis present in the internal carotid artery.
Doppler samples taken further downstream from the turbulent region, if obtainable, show a return to laminar flow, but with delayed systolic upstroke and delayed systolic deceleration phase (Figure 8-8). This type of flow pattern is sometimes referred to a tardus parvus waveform, which, loosely translated, means “slow to rise, slow to fall.”
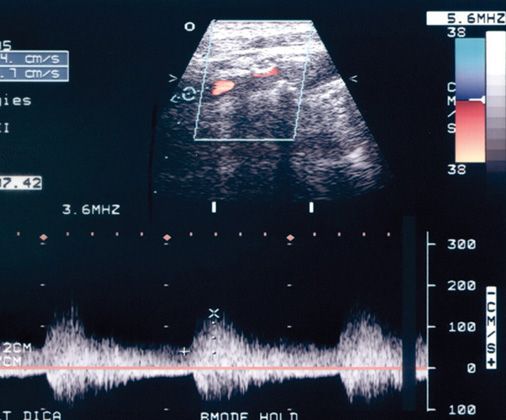
FIGURE 8-8. Doppler sample taken further downstream from the stenosis shows a delayed systolic upstroke and a delayed systolic deceleration phase. Turbulence is still evident in the Doppler spectral waveform far downstream from the stenosis.
Figure 8-9 is a diagrammatic representation of the progression of Doppler waveforms in association with severe arterial stenosis.
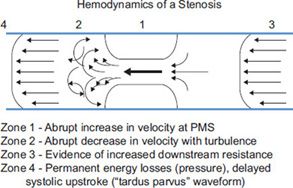
FIGURE 8-9. Diagrammatic representation of hemodynamically significant stenosis. Zone 1 is the point of maximal stenosis; Zone 2 represents post-stenotic turbulence at the exit of the stenosis with possible inclusion of a portion of the stenotic jet; Zone 3 represents an increase in resistance seen proximal to the stenosis; Zone 4 represents downstream return to laminar flow with tardus parvus waveform and continued evidence of flow disturbance.
ALIASING
Related posts:


Stay updated, free articles. Join our Telegram channel

Full access? Get Clinical Tree


