(1)
Electron Microscopy Facility, Biophore, University of Lausanne, Lausanne, Switzerland
(2)
Electron Microscopy ETH Zurich (EMEZ), ETH Zürich, Zürich, Switzerland
Abstract
Three-dimensional information is much easier to understand than a set of two-dimensional images. Therefore a layman is thrilled by the pseudo-3D image taken in a scanning electron microscope (SEM) while, when seeing a transmission electron micrograph, his imagination is challenged. First approaches to gain insight in the third dimension were to make serial microtome sections of a region of interest (ROI) and then building a model of the object. Serial microtome sectioning is a tedious and skill-demanding work and therefore seldom done. In the last two decades with the increase of computer power, sophisticated display options, and the development of new instruments, an SEM with a built-in microtome as well as a focused ion beam scanning electron microscope (FIB-SEM), serial sectioning, and 3D analysis has become far easier and faster.
Due to the relief like topology of the microtome trimmed block face of resin-embedded tissue, the ROI can be searched in the secondary electron mode, and at the selected spot, the ROI is prepared with the ion beam for 3D analysis. For FIB-SEM tomography, a thin slice is removed with the ion beam and the newly exposed face is imaged with the electron beam, usually by recording the backscattered electrons. The process, also called “slice and view,” is repeated until the desired volume is imaged.
As FIB-SEM allows 3D imaging of biological fine structure at high resolution of only small volumes, it is crucial to perform slice and view at carefully selected spots. Finding the region of interest is therefore a prerequisite for meaningful imaging. Thin layer plastification of biofilms offers direct access to the original sample surface and allows the selection of an ROI for site-specific FIB-SEM tomography just by its pronounced topographic features.
Key words
Focused ion beam scanning electron microscope (FIB-SEM)TomographyResin embeddingTargeted preparationBiofilmCell-substrate interface1 Introduction
Focused ion beam (FIB) technology was first described in 1974 by Seliger and Fleming [1], who could focus an ion beam to a few micrometers. Later they demonstrated a scanning ion system with gallium ions that could be focused to 100 nm (review in ref. 2). After these initial approaches, the group of Dr. Ishitani at Hitachi [2, 3] refined the instruments and used them for sample preparation for transmission electron microscopy (TEM). The focused ion beam system was predominantly used in defect analysis in the semiconductor industry. At the spot of the defect material, an electron transparent lamella was prepared with the ion beam system to be analyzed at high resolution in the TEM [3–5]. Already in his review in 1996, Ishitani mentioned the possible use of the focused ion technology in biology [3].
The first instrument was a single-beam, ion beam microscope and later it was combined with an electron column. The ion beam is placed at an angle of 38° or 36° to the vertical electron beam and coincides at a working distance of about 4 mm. These instruments are called focused ion beam scanning electron microscopes, FIB-SEM (see Note 1).
Since the FIB-SEM technology entered the realm of biological applications about 10 years ago, it gained its merits in preparing TEM samples [6] from material that is difficult to cut, either by the hardness or large differences in hardness [5, 7] or incompatibility with diamond knives, e.g., titan implants in bone [8]. More recently, FIB-SEM was used to prepare thick cryo-sections for cry-TEM tomography [9–13].
Further, the ion beam can be used to cross-section cells or organisms prepared for scanning electron microscopy to access internal microstructures [2, 14–17] or to study cell-substrate interactions [18].
The most promising technology at the moment, however, is the FIB-SEM tomography [19–27]: From a sample embedded in resin, a cutting plane from the surface of the resin block is opened at a preselected region of interest. A thin section, as thin as 3 nm, is milled off in the ion beam and then with the electron beam, the freshly generated plane is imaged. By repeating this process, a 3D data set of the object under investigation is generated. Volumes usually in the range of 20–40 μm in all three dimensions can be imaged with a voxel resolution down to 3 nm. Up to now, FIB-SEM tomography resides between TEM tomography, with a volume of 2–5 μm in X, Y and 500 nm in Z, at around 1 nm resolution and 3View (Gatan, Inc.) tomography, using a microtome built in an SEM [28–31] with much larger volumes at 10–5 nm pixel resolution and about 30–50 nm Z slice resolution.
In this chapter we will concentrate on FIB-SEM tomography and the corresponding preparation methodology.
Biological samples require an extensive preparation protocol to stabilize the sample for electron microscopy and preserve the delicate ultrastructure. Further care has to be taken that the sample is well contrasted as no on-section staining can be applied.
In most cases this involves the final embedding into a block of resin, which is trimmed later in a way that the structures of interest become located close to the surface of the block. Often there are only a few ROI and they need to be identified within the large resin block. Sometimes the ROI can be located by secondary electron imaging directly from the relief of the block surface [23, 24] or with high acceleration voltages from heavy metal stained structures beneath the resin surface. For a precise location of specific cellular events, using coverslips with a reference grid [32] or placing landmarks [33] and correlative imaging is needed.
Here we like to introduce an alternative method, the thin layer plastification (TLP) technique, that allows for easy localization of features in cell monolayers or biofilms [34]. It follows the same preparation steps as block embedding, but instead of placing the sample in an embedding mould and burry it completely in resin, the bulk of the resin is removed before polymerization, which leaves just a thin resin layer surrounding the sample. This results in a surface showing some topography. The topographic information allows the selection of regions of interest in the FIB-SEM—even without previous correlation of multimodal images.
Biofilms on hard substrates like glass, e.g., a coverslip, require the removal of the support after conventional block embedding for being accessible by FIB-SEM. Thin layer plastification, on the contrary, allows the biofilms to stay on their substrate. They can be accessed directly from their apical side; thus, the cell-to-substrate interface remains intact and it can be visualized in situ. Thin layer plastification is, therefore, an ideal method for biological interface studies (see Fig. 1).
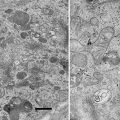
Fig. 1
The principle of thin layer plastification (right side) in comparison with resin block embedding (left side). Thin layer plastification allows the substrate to remain in the sample. No further trimming is necessary. The interface between the biofilm and the substrate stays intact. The cells can be accessed directly via their apical side. They get imaged right-side-up. The topography facilitates the selection of areas of interest. On the contrary after block embedding, the substrate must be removed in order to access the cells
2 Materials
1.
Glutardialdhyde (Electron Microscopy Sciences, Fort Washington, PA; EMS).
2.
HEPES, 4-(2-hydroxyethyl)-1-piperazineethanesulfonic acid (Sigma-Aldrich, Buchs, Switzerland).
3.
Osmium tetroxide (OsO4).
4.
Potassium hexacyanoferrate (II) trihydrate, potassium ferrocyanate, yellow prussiate (K4Fe(CN)6 × 3H2O) (Fluka, Buchs, Switzerland).
5.
Uranyl acetate (Merck, Darmstadt, Germany).
6.
Ethanol, acetone.
7.
Epoxy resin.
(a)
Epon 812 substitute (Fluka).
Solution A.
5 ml epoxy embedding medium.
8 ml DDSA, 2-dodecenylsuccinic anhydride.
Solution B.
8 ml epoxy embedding medium.
7 ml NMA, methylnadic anhydride.
Final solution.
13 ml solution A.
15 ml solution B.
1.5–2 % (16 drops) DMP-30, 2,4,6-tris (dimethylaminomehtyl)phenol.
(b)
EMbed 812 kit (EMS).
7.25 g of EMbed 812.
5.25 g of NMA.
2.5 g DDSA.
0.27 g DMP-30.
Any other epoxy formulation and also methacrylates can be used for embedding.
8.
Conductive carbon cement, Leit-C (Plano GmbH), or Graphite conductive
adhesive 154 (EMS).
9.
Conductive epoxy resin: Epo-Tek H2OS (EMS).
10.
Sputter coater MED 010 (Balzers Union).
11.
45° pin stub holder (EMS) or 45° SEM aluminum mount in conjunction with flat pin stub holder (EMS).
12.
Wacom Cintiq 24HD graphic tablet (ARP Suisse SA, Rotkreuz, Switzerland).
3 Methods
3.1 Standard Chemical Fixation and Embedding
The biological specimen is chemically fixed as close to living conditions as possible by adjusting the pH, osmolarity, and temperature to those of the living conditions (see Chaptes 25 of this volume). To fix tissue of mammals, a perfusion fixation is first choice. For cells or small organisms growing in medium, the addition of an equal volume of double strength fixative is recommended.
For chemical fixation we incubate the cells or small blocks of tissue, about 1 mm3 in size, in 2.5 % glutardialdehyde in 200 mM HEPES buffer, pH 7.4 for 2 h. Then the sample is post-fixed with 2 % osmium tetroxide in water for 1 h or, to improve (electron) contrast, with a mixture of 2 % osmium tetroxide and 1.5 % potassium hexacyanoferrate (II) [35] for 1 h, followed by a block staining with 2 % aqueous uranyl acetate.
Dehydration is done in either graded series of ethanol or acetone (30, 50, 70, and 100 %). If dehydration takes place in ethanol, an intermediate step with acetone before embedding in epoxy resin is preferred to the water-insoluble and hazardous propylene oxide or no intermedium is used at all.
The samples are embedded in epoxy resin through steps of 30 and 70 % resin in solvent and then several times in 100 % resin. It seems that neurobiologists traditionally use Durcupan [36], plant scientists prefer Spurr’s low viscosity resin [37], whereas most others choose Epon [38, 39]. The resin is polymerized at 60 °C for at least 2 days.
3.2 Thin Layer Plastification
For the method described here, it is irrelevant in which way the initial sample preparation steps are performed—only the step just before the polymerization is crucial. Of course the sample needs to be fixed and heavy metal stained and dehydrated before resin penetration. Various recipes will work, e.g., the one described above.
It is not an embedding technique as no bed or mould is needed. The difference is depicted in Fig. 1. Draining off the excess of resin leaves the samples just coated by a thin layer of the viscous resin before polymerization. The draining might be performed by gravity, centrifugation, or careful blotting. The polymerized sample shows some surface topography—just enough for orientation and identification of ROIs (see Fig. 2). The substrate stays within the sample and leaves the biofilm-substrate interface intact (see Figs. 1 and 2 and also Note 2).
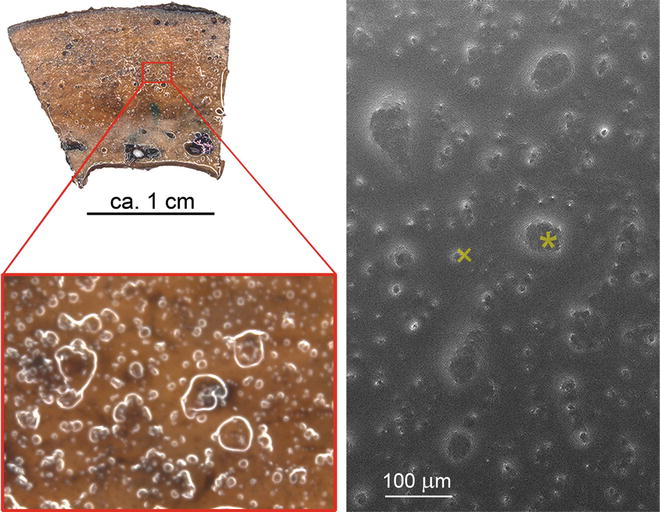
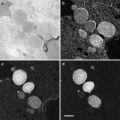
Fig. 2
Plastified bone chip with mixed osteoclast culture. The cell population consist of mature syncytial osteoclasts (asterisk) as well as precursor cells (plus). Thin layer plastification results in a topographic sample surface. The sample topography is visible in the SEM (right side) by SE imaging as well as under the stereo microscope (left side)
Though cryo-fixation and freeze-substitution [40, 41] are the methods of choice for biological sample preparation, some samples are not suitable for cryo-preparation, i.e., the substrates are too bulky or scaffolds are too extended or fragile for transferring them into the high-pressure freezing platelets [42].
For studying the degradation effect of osteoclasts on bone, osteoclast cells are cultivated on purified bone chips (ca. 1 cm × 2 cm × 1.5 mm) for several days. The culture is quite heterogeneous: besides mature osteoclasts there are numerous immature precursor cells. Only the mature syncytial cells show bone degrading activities and need therefore to be targeted for cell-substrate interaction studies. After thin layer plastification, the mature osteoclasts can easily be selected from the mixed population by topographic features such as shapes and sizes (see Figs. 2 and 3).
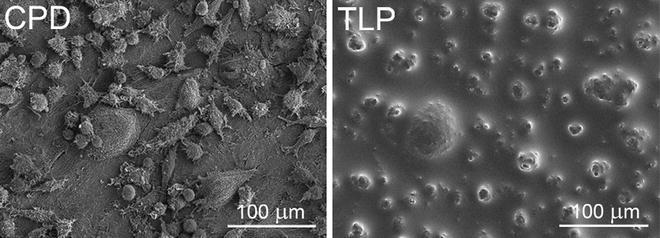
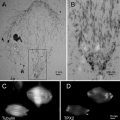
Fig. 3
Sample topography after standard SEM-preparation and after thin layer plastification. Comparable situations of osteoclast cultures on bone chips are depicted. Samples have been chemically fixed, dehydrated in a graded series of ethanol, and finally dried over the critical point of CO2 (CPD, left side)—or were plastified as described (TLP, right side). Both samples have been mounted and sputter coated. While the critical-point-dried cells show fine topographic detail, delicate structure details are obscured by the thin resin coat after plastification. Nonetheless there are enough topographic features left to discriminate mature osteoclasts and precursor cells
The osteoclasts on bone chips were prepared by conventional EM preparation procedures, i.e., fixation in 2.5 % glutardialdehyde for 1 h, followed by post-fixation in 2 % osmium tetroxide for 1 h and block staining with 2 % uranyl acetate for 1 h with washing steps in between. Dehydration was performed in a graded series of 30, 50, 70, 90, and 100 % ethanol, followed by twice water-free 100 % ethanol, 30 min each. The sample is impregnated first with 33 % resin (EMbed 812) and then with 66 % resin in water-free ethanol for 1.5 h each. After that it is submerged in 100 % resin twice for 2 h each.
All impregnation steps are performed at room temperature in small plastic dishes filled with the resin mix. The sample is completely submerged in the resin and then taken out of the resin bath. Excesses of resin along the borders or on the back are removed gently and the sample is allowed to drain for another 1.5 h at room temperature. Different setups are possible: the sample might stand upright (see Note 2) on a filter paper leaning against the side wall of a plastic dish or it might hang in the opening of an Eppendorf tube—it even might be centrifuged for a few seconds in a small Eppendorf centrifuge to speed up the removal of excess viscous resin.
The sample is then transferred to the oven to be heated up slowly to 60 °C—this makes the resin less viscous and might even promote drainage. Polymerization is allowed to take place for 1 up to 3 days at 60 °C. The polymerized samples are cooled to room temperature and directly mounted right-side-up onto SEM stubs with Leit-C. After hardening of the Leit-C, the specimens are sputter coated with 6 nm platinum.
3.3 Microtomy
While thin layer plastified samples need no further trimming or microtomy, tissue and cells block embedded in resin first need to be made accessible for FIB tomography. For this, the resin blocks are trimmed in an ultramicrotome and the surface is smoothened by cutting a few sections with a diamond knife. The sections can already be investigated in a transmission electron microscope to check the quality of the preparation and to narrow down the ROI. For standard configuration (see Fig. 4) the top part of the sample is glued sidewise on an empty resin block and is then mounted on an SEM stub with conductive epoxy resin and finally sputter coated with a thin, ca. 10 nm thick, layer of platinum.
Fig. 4
Milling strategies with a fixed stage. (a) The traditional geometry for FIB milling and electron imaging are depicted. In the cases of the trenches are too small or the milling is too deep, the electrons can be hindered to reach the detector. (b) Using a flat geometry, i.e., the resin block is not tilted perpendicular to the ion beam, thus the electrons can easier escape
The coated sample is transferred to the FIB-SEM. Using the SE imaging mode, the region of interest can be located for the FIB tomography. Usually this region is at the edge of the resin block [22]. SE imaging can also be used to take an overview image of the embedded structure and then to decide which region should be analyzed [24].
Related posts:
 Microwave-Assisted Processing and Embedding for Transmission Electron Microscopy
 Electron Microscopy of Microtubule Cytoskeleton Assembly In Vitro
 Biological Applications of Energy-Filtered TEM
 Freeze Fracture and Freeze Etching
 Elemental and Isotopic Imaging of Biological Samples Using NanoSIMS
Stay updated, free articles. Join our Telegram channel

Full access? Get Clinical Tree


