Obstetric and Gynecologic Imaging
Edward A. Lyons
E. A. Lyons: Department of Radiology, University of Manitoba, Health Sciences Centre, Winnipeg, Manitoba R3A 1R9, Canada.
Obstetric and gynecologic imaging has undergone marked changes in the past 15 years, primarily because of the influence of new imaging modalities. The single modality that has most significantly changed the diagnostic approach to obstetric and gynecologic problems is diagnostic ultrasonography. The remarkable ability of this technique to display the anatomy of the gravid and nongravid female pelvis without the use of ionizing radiation motivated the development of techniques and instrumentation that have almost totally replaced many x-ray—based examinations. The use of diagnostic ultrasonography for the evaluation of obstetric and gynecologic problems is the dominant theme of this chapter. Of all the other imaging modalities, magnetic resonance imaging (MRI) has found some favor in gynecologic and obstetric diagnosis. The high cost of MRI and the widespread availability of ultrasound have further limited the use of MRI in this area.
It is beyond the scope of this chapter to discuss the physical principles of ultrasound,219, x-ray,102 and MRI165 examinations. Both ultrasonography and MRI are nonionizing imaging techniques that offer a lower potential risk to the developing fetus. The relative newness of MRI has not permitted a thorough investigation of its potential biologic effects on the developing fetus. Ultrasonography has been used to image the developing fetus for three decades, and no harmful effects in humans have been identified, despite extensive investigation of the potential biologic hazards of ultrasonography. The American Institute of Ultrasound in Medicine (AIUM) has developed guidelines for the use of ultrasound in obstetrics which have been adopted in modified forms by most related organizations.91 The current thrust has been in conjunction with equipment manufacturers to include indicators of ultrasound power output clearly visible and recorded on all images. The thermal index (TI) and mechanical index (MI) are relative indicators of the production of potentially harmful heat or ultrasonic cavitation. In addition, the AIUM is promoting the ALARA principle which encourages ultrasound practitioners to use ultrasound energy at a level that is As Low As Reasonably Achievable and yet still capable of providing diagnostic information.
The last 10 years have seen a major improvement in equipment design and therefore in image quality. After all, most imaging equipment is simply a computer that can use ultrasound, x-rays, radioisotopes, or strong magnetic fields to generate an image. As the development of computers has skyrocketed, so has the development of imaging equipment. The units are now smaller, less expensive, and much more versatile. Virtually all ultrasound scanners manufactured today include color Doppler capabilities. This allows one to view the anatomy as a gray-scale image, with blood flow in vessels depicted as a color-coded overlay. The ability to combine anatomic and physiologic information has greatly improved the diagnostic potential of ultrasound. Manufacturers have also produced ultrasound transducers using arrays of crystals with very high frequencies (up to 12 MHz) that can provide much higher resolution than was previously possible. For example a 10-MHz transducer has the capability to resolve structures less than 0.5 mm apart. Additionally, the last 10 years has seen the introduction and widespread use of the endovaginal transducer. A probe that is 2 cm in diameter and 20 cm in length was developed to be placed into the vagina and allow significantly improved resolution of the uterus and adnexa. The transducer can be used almost as an examining finger to identify areas of tenderness within the pelvis. This information, along with the images and the history, allows for a much more complete examination and more accurate diagnosis.
Newer scanners incorporate three-dimensional capabilities that have the potential to provide even more diagnostic information. To view the uterine cavity or an embryo in planes not now achievable should allow for better imaging and diagnosis. Finally, one must remember that ultrasound, more than any other imaging modality, is highly operator dependent, which means that if the individual performing the
study fails to identify the abnormality, it is lost and cannot be “retrieved” through a subsequent review of the images obtained. The vast majority of examinations are recorded as a series of static, hard copy images that are representative of the anatomy examined. The abnormality will be recorded only if it is recognized for what it is and captured on film.
study fails to identify the abnormality, it is lost and cannot be “retrieved” through a subsequent review of the images obtained. The vast majority of examinations are recorded as a series of static, hard copy images that are representative of the anatomy examined. The abnormality will be recorded only if it is recognized for what it is and captured on film.
OBSTETRIC IMAGING
The First Trimester
The first trimester of pregnancy begins with fertilization and implantation and extends through the 12th menstrual week. It is the embryonic stage of pregnancy in which the fertilized ovum develops into an embryo with major organogenesis occurring. When one discusses the various stages of development, a specific number of weeks of gestation usually serves as a reference. Embryology texts usually identify weeks of gestation from the time of fertilization, which in a normal 28-day menstrual cycle usually occurs on day 14, or at 2 menstrual weeks. In the sonographic literature, gestational age is equated with menstrual age. For example, if a patient is found to have an intrauterine pregnancy of a gestational age of 10 weeks, it means that 10 weeks have passed since the first day of the patient’s last normal menstrual period; presuming she had a 28-day menstrual cycle, it is 8 weeks since fertilization. Therefore, the dates referred to in this chapter as gestational age are in fact menstrual age.
The introduction of endovaginal transducers has permitted earlier and more precise visualization of intrauterine pregnancies. The earliest sonographic finding of an intrauterine pregnancy is the identification of an echogenic mass in a subendometrial location at 3.5 to 4 weeks’ menstrual age. This is called the “intradecidual sign.” The identification of the gestational sac (Fig. 21-1) is a more common early sonographic finding. The sac can be identified at 4.5 menstrual weeks by endovaginal ultrasonography and in the fifth menstrual week by transabdominal scanning.100 A normal gestational sac has a well-defined, thick, echogenic rim, which is called the trophoblast. It is actually composed of the inner cytotrophoblastic and outer syncytiotrophoblastic tissue. The sac is surrounded by the thick, echogenic endometrium. Implantation usually occurs in the fundus but has been reported in other intrauterine and extrauterine locations. The sac usually measures approximately 1 cm at 5.5 weeks’ gestation and gradually enlarges with increasing gestational age. The sac size is very useful as an estimate of gestational age.125 The sac is measured as the mean sac diameter (MSD) which is the sum of three orthogonal dimensions of the fluid-sac wall interface divided by three. A rapid formula that can be applied to estimate gestational age in days from MSD is simply to add 30 to the diameter. Therefore a 5-mm MSD will be seen in a 5-week gestation. The normal sac grows at a rate of 1 mm per day.
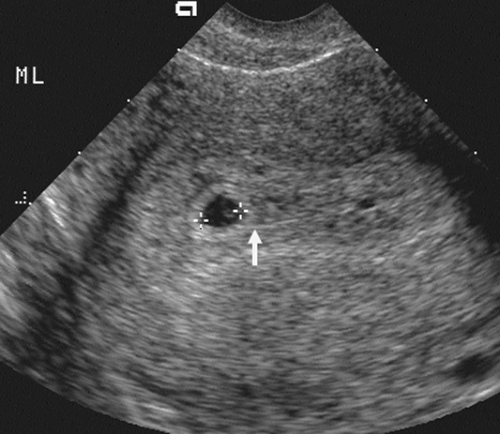 FIG. 21-1. Pregnancy of 4.5 weeks. Sagittal endovaginal scan view of the uterus shows a small gestational sac (calipers) lying just adjacent to the endometrial canal (arrow). |
With modern equipment and the endovaginal approach, the small yolk sac is the next landmark to be visible within the gestational or chorionic sac (Fig. 21-2). The yolk sac is actually the secondary yolk sac; it usually is seen at about 42 days or 6 menstrual weeks. It is a well-defined echogenic ring. If the yolk sac is not visible by the time the MSD exceeds 8 mm, then one must be concerned about a failed early pregnancy and repeat the examination in 1 week’s time.135 The embryo is seen shortly after the appearance of the yolk sac, at about 45 menstrual days or 6.5 weeks. It lies adjacent to the yolk sac (Fig. 21-3). With most modern transvaginal ultrasound equipment, fetal cardiac activity is
seen in the sixth menstrual week and should be documented in all studies thereafter.136 At 8 menstrual weeks, a thickened area in the decidua denotes the early formation of the placenta. It is easily visible by 9 menstrual weeks (Fig. 21-4). By 12 menstrual weeks (Fig. 21-5), the fetal calvarium should be well formed and easily identified. At 7 to 8 weeks, gross movement of the fetal pole is also easy to identify. As the extremities develop, the activity of the fetal extremity can be seen in the later stages of the first trimester. In addition to evaluation of the gestational sac and embryo, all ultrasound examinations in the first trimester should comment on the uterus and adnexal structures. Any uterine or adnexal mass should be recorded.
seen in the sixth menstrual week and should be documented in all studies thereafter.136 At 8 menstrual weeks, a thickened area in the decidua denotes the early formation of the placenta. It is easily visible by 9 menstrual weeks (Fig. 21-4). By 12 menstrual weeks (Fig. 21-5), the fetal calvarium should be well formed and easily identified. At 7 to 8 weeks, gross movement of the fetal pole is also easy to identify. As the extremities develop, the activity of the fetal extremity can be seen in the later stages of the first trimester. In addition to evaluation of the gestational sac and embryo, all ultrasound examinations in the first trimester should comment on the uterus and adnexal structures. Any uterine or adnexal mass should be recorded.
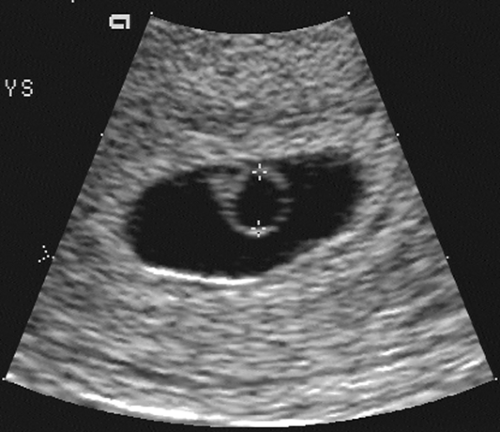 FIG. 21-2. Pregnancy of 6 weeks. A magnified endovaginal view of the gestational sac and a 4-mm secondary yolk sac (calipers). |
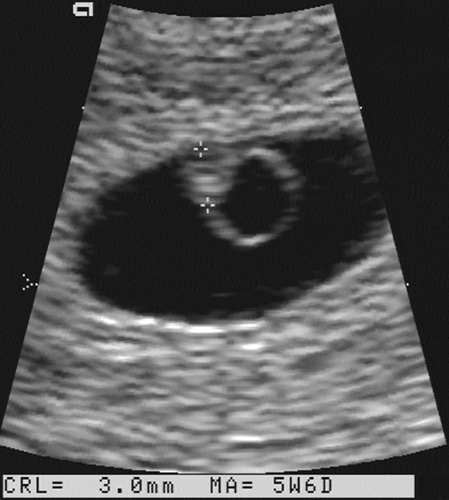 FIG. 21-3. Pregnancy of 6 weeks. An embryo (calipers) with a crown-rump length of 3.0 mm can be seen developing adjacent to the yolk sac. |
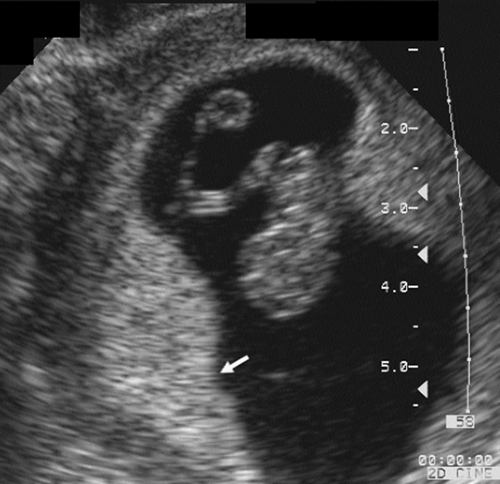 FIG. 21-4. Pregnancy of 9 weeks. The embryo and yolk sac are seen in the middle of the gestational sac. On the left (arrow) is a thick echogenic area of early placental formation. |
 FIG. 21-5. Pregnancy of 12 weeks with the fetal head lying to the left, face up. |
Complications of Early Pregnancy
One of the most common indications for ultrasound examination in the first trimester is vaginal bleeding. Ultrasonography is the most useful diagnostic test in making a differential diagnosis—usually normal intrauterine pregnancy, abnormal or failed intrauterine pregnancy, ectopic pregnancy, or gestational trophoblastic disease. Bleeding in the first 20 weeks is referred to clinically as a threatened abortion. This may be associated with mild cramping, but on examination the cervical os is closed. This is a common complication, occurring in 25% of clinically apparent pregnancies.36 About 50% of these subsequently abort, with the rest continuing to delivery.
Early pregnancy failure or blighted ovum may be diagnosed sonographically by several findings. A reliable sign is an embryo with a crown-rump length (CRL) of more than 5 mm and no cardiac activity. A gestational sac with an MSD of more than 16 mm and no apparent embryo or an MSD of more than 8 mm and no apparent yolk sac are ominous
findings159 (Fig. 21-6). The pregnancy should be rescanned in 1 week to see whether the yolk sac or embryo has appeared. Late gestational sac signs include an irregular gestational sac, a sac lying low in the uterine cavity, or a sac with an irregular or thin trophoblast. A sign that has generated some controversy but in our hands has been reliable is a yolk sac of greater than 6 mm internal diameter in a pregnancy of less than 10 weeks’ menstrual age137 (Fig. 21-7). Finally, a subchorionic hemorrhage, especially if it surrounds more than two thirds of the sac, is an ominous finding28,87 (Fig. 21-8). If any of these signs are present, one must have a high degree of suspicion that the pregnancy will not continue to term. This information must be correlated with the clinical information and any available laboratory data, especially the level of the beta subunit of human chorionic gonadotropin (β-hCG).
findings159 (Fig. 21-6). The pregnancy should be rescanned in 1 week to see whether the yolk sac or embryo has appeared. Late gestational sac signs include an irregular gestational sac, a sac lying low in the uterine cavity, or a sac with an irregular or thin trophoblast. A sign that has generated some controversy but in our hands has been reliable is a yolk sac of greater than 6 mm internal diameter in a pregnancy of less than 10 weeks’ menstrual age137 (Fig. 21-7). Finally, a subchorionic hemorrhage, especially if it surrounds more than two thirds of the sac, is an ominous finding28,87 (Fig. 21-8). If any of these signs are present, one must have a high degree of suspicion that the pregnancy will not continue to term. This information must be correlated with the clinical information and any available laboratory data, especially the level of the beta subunit of human chorionic gonadotropin (β-hCG).
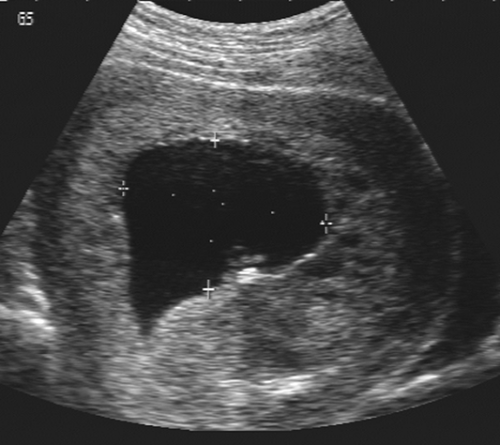 FIG. 21-6. Early pregnancy failure. An endovaginal scan of a large empty gestational sac with a mean sac diameter of 35 mm. The sac is irregular, with a thin peripheral trophoblast and no yolk sac or embryo. |
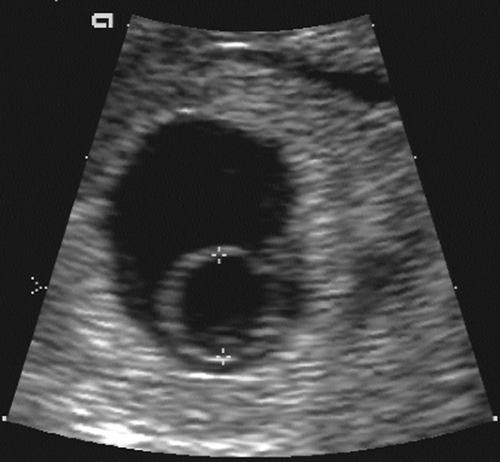 FIG. 21-7. Large yolk sac at 7 weeks’ menstrual age. The inner diameter of the yolk sac is 7.3 mm, which is abnormally large, especially for this stage of gestation. The pregnancy went on to abort in 2 weeks. |
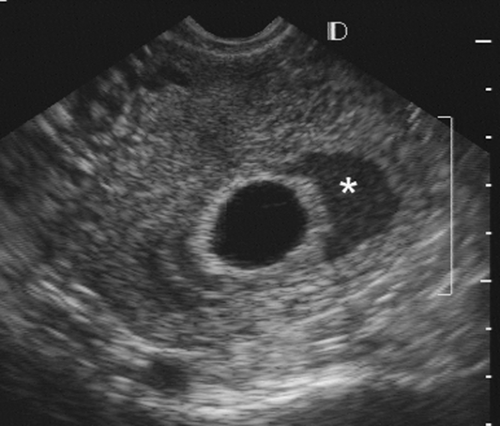 FIG. 21-8. An endovaginal scan of a 7-week gestational sac with a large subchorionic collection of blood (asterisk) surrounding a good part of it. The pregnancy aborted 3 weeks later. |
Clinically, a pregnancy may be at risk if the patient presents with certain ominous signs. These include bleeding, particularly brownish spotting; a uterine size that is small for dates according to the last menstrual period; and even a change in the symptoms of early pregnancy, such as breasts being less tender or experiencing less morning sickness. If the clinical picture and the sonographic findings are in complete agreement for an early pregnancy failure, then the patient should undergo termination with a therapeutic dilatation and curettage (D&C). If there is any doubt whatsoever, then it is essential to give the fetus the benefit of the doubt and repeat the scan in 1 week’s time. If there is still uncertainty, a second repeat is prudent. One must avoid aborting a potentially normal pregnancy based on excessive reliance on the sonographic findings in the absence of correlation with the clinical picture.
Ectopic Pregnancy
An ectopic pregnancy is a potentially life-threatening complication of early pregnancy that, unlike the previously mentioned clinical entities, almost always causes varying degrees of abdominal pain in addition to vaginal bleeding. Transvaginal scanning is superior to transabdominal scanning
for evaluation of ectopic pregnancy,203 although both examinations are necessary for complete evaluation. The transabdominal scan can even be performed without the usual bladder filling, in that one is looking for a large mass or large amounts of free fluid in the peritoneal cavity, which would be out of the field of view of the endovaginal probe. Large uterine fibroids, ovarian cysts, and blood clots can all be missed if the transabdominal study is omitted. The pathognomonic sonographic finding of ectopic pregnancy is an extrauterine gestational sac that contains a live embryo. This finding is seen in approximately 30% of cases with transvaginal scans and 10% with transabdominal scans.54,170 The exception to this rule is the heterotopic gestation, where there is an intrauterine and extrauterine pregnancy. Although the incidence of this is relatively low, about 1 in 6,000 pregnancies, in patients having in vitro fertilization the incidence can be as high as 1.5 in 100 pregnancies.144 Additional sonographic findings include an empty uterus, a decidual cyst, an adnexal mass, particulate fluid in the posterior cul-de-sac, and the presence of a pseudogestational sac in the endometrial cavity128 (Fig. 21-9).
for evaluation of ectopic pregnancy,203 although both examinations are necessary for complete evaluation. The transabdominal scan can even be performed without the usual bladder filling, in that one is looking for a large mass or large amounts of free fluid in the peritoneal cavity, which would be out of the field of view of the endovaginal probe. Large uterine fibroids, ovarian cysts, and blood clots can all be missed if the transabdominal study is omitted. The pathognomonic sonographic finding of ectopic pregnancy is an extrauterine gestational sac that contains a live embryo. This finding is seen in approximately 30% of cases with transvaginal scans and 10% with transabdominal scans.54,170 The exception to this rule is the heterotopic gestation, where there is an intrauterine and extrauterine pregnancy. Although the incidence of this is relatively low, about 1 in 6,000 pregnancies, in patients having in vitro fertilization the incidence can be as high as 1.5 in 100 pregnancies.144 Additional sonographic findings include an empty uterus, a decidual cyst, an adnexal mass, particulate fluid in the posterior cul-de-sac, and the presence of a pseudogestational sac in the endometrial cavity128 (Fig. 21-9).
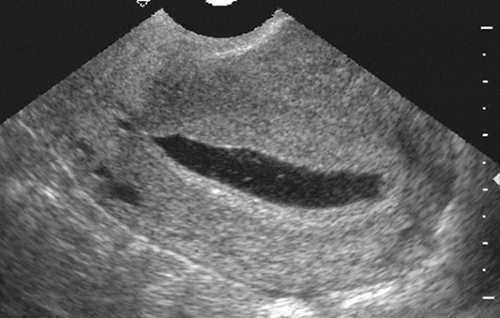 FIG. 21-9. Ectopic pregnancy. This is a sagittal endovaginal scan of a uterus which has a large, flat, sac-like structure that is the decidual cast or pseudogestational sac. |
It may be difficult to distinguish between a normal early intrauterine pregnancy, as identified by the presence of a gestational sac, and a pseudogestational sac, which forms from the sloughed decidual cast in association with an ectopic pregnancy.154 In a normal intrauterine gestation, there is the appearance of a double gestational sac created by the echogenic maternal tissue or decidua and the echogenic fetal tissue or trophoblast. There is usually a thin hypoechoic zone between the two, giving a double ring or double decidual sac appearance26 (Fig. 21-10). With the pseudogestational sac of an ectopic pregnancy, only a single layer of decidual reaction lines the entire endometrial cavity. The presence of a normal intrauterine gestational sac with a viable fetal pole essentially excludes the possibility of ectopic pregnancy.17
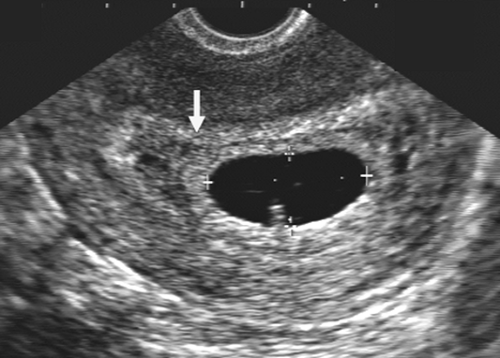 FIG. 21-10. Normal intrauterine gestation at 6 weeks’ menstrual age. The inner echogenic ring, with calipers, is the trophoblastic layer of the gestational sac. The outer echogenic ring (arrow) is the maternal decidua. |
A decidual cyst is a small 2- to 5-mm cyst that lies near the endomyometrial junction (Fig. 21-11). It does not have an echogenic border as is seen in a gestational sac. In 14% of patients with proven ectopic pregnancy, decidual cyst was an early sign.3 It can also be seen in association with, or before the appearance of, a normal intrauterine gestation.
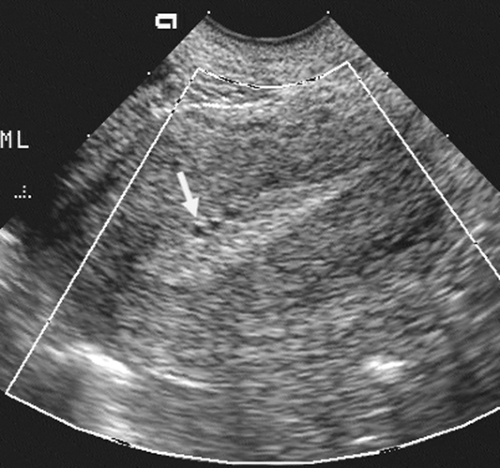 FIG. 21-11. A sagittal scan of an empty uterus in a woman 7 weeks pregnant. There are three small cysts in the endometrium (arrow). These are decidual cysts, and this patient has a gestational sac in the fallopian tube. |
Adnexal masses in association with ectopic pregnancy have a variety of appearances and may not individually add much to the ability to make a specific pathologic diagnosis. An echogenic tubal ring of an early gestational sac is a helpful finding in the appropriate clinical setting of a positive pregnancy test and an empty uterus (Fig. 21-12). The presence of a yolk sac or embryo within the sac makes the diagnosis
a certainty. A tubal ring is seen in about 50% of ectopic pregnancies and can be a very helpful sign.78 Adnexal hematomas secondary to bleeding from an ectopic pregnancy are usually sonographically complex or solid in appearance. Hemorrhagic corpus luteum cysts can be seen with both ectopic and intrauterine pregnancies and can mimic the ectopic gestation. In some patients pre-existing masses, especially those caused by previous pelvic inflammatory disease that predisposes patients to ectopic pregnancy, may simulate the ectopic gestation as well. Bleeding from an ectopic pregnancy may be identified sonographically as echogenic fluid in the posterior cul-de-sac (Fig. 21-13). Clotted blood can have substantial internal echoes and appear solid on the ultrasound images. A scan though the right upper quadrant is a routine in our laboratory. Echogenic fluid in the hepatorenal space means a large volume of free intraperitoneal blood. Echogenic free fluid does not always mean a ruptured ectopic pregnancy, and a ruptured ectopic gestation does not always have free fluid.83 Although these additional findings taken individually are not specific, the presence of an enlarged uterus without a gestational sac, an adnexal mass, and fluid in the cul-de-sac in a patient with a positive pregnancy test is highly suggestive of ectopic pregnancy.
a certainty. A tubal ring is seen in about 50% of ectopic pregnancies and can be a very helpful sign.78 Adnexal hematomas secondary to bleeding from an ectopic pregnancy are usually sonographically complex or solid in appearance. Hemorrhagic corpus luteum cysts can be seen with both ectopic and intrauterine pregnancies and can mimic the ectopic gestation. In some patients pre-existing masses, especially those caused by previous pelvic inflammatory disease that predisposes patients to ectopic pregnancy, may simulate the ectopic gestation as well. Bleeding from an ectopic pregnancy may be identified sonographically as echogenic fluid in the posterior cul-de-sac (Fig. 21-13). Clotted blood can have substantial internal echoes and appear solid on the ultrasound images. A scan though the right upper quadrant is a routine in our laboratory. Echogenic fluid in the hepatorenal space means a large volume of free intraperitoneal blood. Echogenic free fluid does not always mean a ruptured ectopic pregnancy, and a ruptured ectopic gestation does not always have free fluid.83 Although these additional findings taken individually are not specific, the presence of an enlarged uterus without a gestational sac, an adnexal mass, and fluid in the cul-de-sac in a patient with a positive pregnancy test is highly suggestive of ectopic pregnancy.
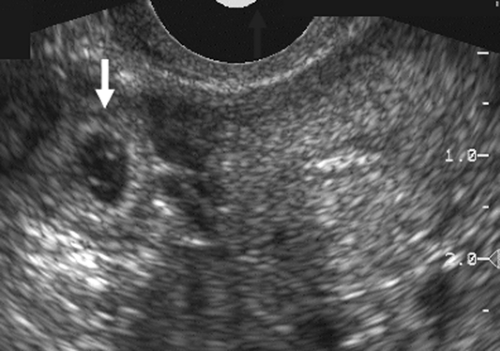 FIG. 21-12. A transverse endovaginal scan of the empty uterus and a 6-week ectopic gestational sac (arrow) in the right adnexa. |
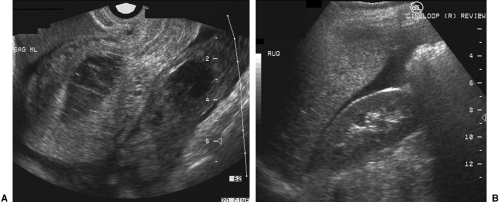 FIG. 21-13. A: A midsagittal endovaginal scan of an enlarged uterus with fluid in the endometrial canal. This patient had just undergone unsuccessful suction therapeutic dilatation and curettage for an intrauterine pregnancy. In the posterior cul-de-sac there is echogenic blood and clots. B: A sagittal scan through the right upper quadrant showing free fluid, presumably blood, in the hepatorenal space. This would indicate a large volume of hemoperitoneum in this patient with a ruptured ectopic pregnancy. |
An extremely helpful albeit not always available adjunct to the diagnosis of ectopic pregnancy is the quantitative serum β-hCG determination.184 This test, when performed as a radioimmunoassay, becomes positive approximately 10 days after conception. In normal intrauterine pregnancies, the β-hCG level doubles every 2 days in the mid-first trimester. In ectopic pregnancy, the β-hCG level is lower than in a normal intrauterine pregnancy, and it plateaus or does not rise with time. By the time the β-hCG reaches 1,000 mIU/L (Second International Standard) in a normal pregnancy, a gestational sac should be visible in the uterus by transvaginal scanning.161 If no intrauterine gestational sac is identified and the β-hCG level is below the discriminating zone, there still may be an ectopic pregnancy; however, it could also be an early intrauterine pregnancy before the sonographic identification of a gestational sac. In this situation, serial quantitative β-hCG levels and follow-up sonograms are advised.
Estimating Gestational Age
Gestational age is determined by monitoring menstrual age-that is, the number of weeks since the first day of the last normal menstrual period. This convention is useful because there is significant variability in the time of ovulation, and it is frequently difficult to ascertain exactly when fertilization occurred. From a practical standpoint, the patient often can recall the first day of the last normal menstrual period. However, as many as 30% to 40% of women cannot document a specific date.64
Several sonographic and radiologic parameters can be used to determine gestational age. In general, the earlier in pregnancy that an attempt is made to establish gestational age, the more accurate is its determination. This is because of increasing normal variability in the size of the fetus as pregnancy advances.
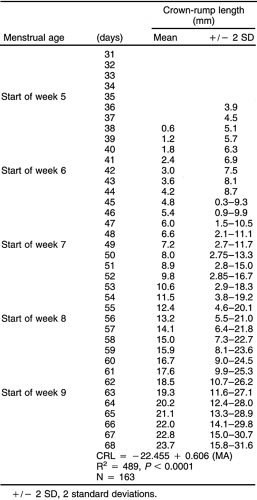
In the first trimester, the size of the gestational sac can be used to estimate gestational age.181 A much more accurate method is to measure the greatest length of the fetal pole and determine the CRL (Fig. 21-14). This measurement is accurate in establishing the gestational age to ±5 days, or about ±8% for two standard deviations101,182,189 (Table 21-1). This measurement is useful between 5 and 12 weeks of gestation.
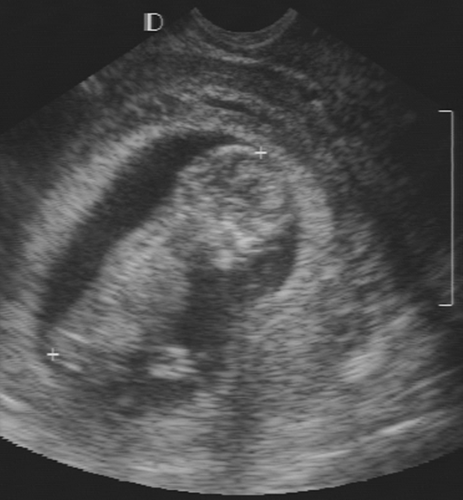 FIG. 21-14. Crown-rump length measurement of 55 mm in a 12-week pregnancy. |
 |
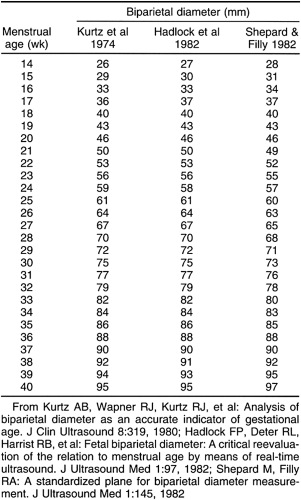
After the 12th menstrual week, several other fetal physical parameters can be measured to estimate gestational age. The most common practice is to assess the fetal biparietal diameter (BPD), head circumference (HC), abdominal circumference (AC), and femur length (FL) and then to calculate the mean menstrual age from all four values. This gives an accuracy of ±3 to 4 weeks from 26 weeks to term.15 The fetal BPD is the measurement that has undergone the most extensive study. This measurement is made on an image that displays a transaxial section through the fetal calvarium at the level of the thalamus and cavum septi pellucidi (Fig. 21-15). The measurement is made from the outer table of the calvarium closest to the transducer to the inner table of the far side of the calvarium. Extreme care must be taken to obtain the appropriate image and to ensure that the midline echoes are equidistant between the inner tables of the skull. When gestational age based on the BPD is reported, a mean gestational
age should be stated (Table 21-2), along with the range of normal based on two standard deviations from normal or a 95% confidence interval. The range of normal variation increases with gestational age.59 From 13 to 19 weeks, the range is ±1 week; from 20 to 26 weeks, it is ±10 days; from 26 to 30 weeks, it is ±2 to 2.5 weeks; and after 30 weeks, it is ±3 to 4 weeks.24
age should be stated (Table 21-2), along with the range of normal based on two standard deviations from normal or a 95% confidence interval. The range of normal variation increases with gestational age.59 From 13 to 19 weeks, the range is ±1 week; from 20 to 26 weeks, it is ±10 days; from 26 to 30 weeks, it is ±2 to 2.5 weeks; and after 30 weeks, it is ±3 to 4 weeks.24
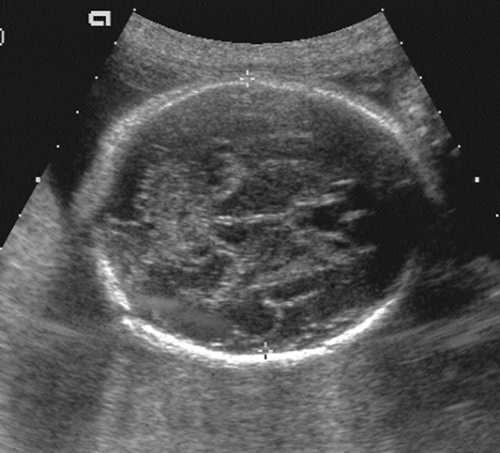 FIG. 21-15. Biparietal diameter (BPD) measurement of 6.9 cm. Transaxial scan at the level of the thalami. BPD is measured from the outer table anteriorly to the inner table posteriorly (cursors). |
 |
Other fetal cranial measurements can be used as adjuncts to BPD in estimating gestational age. Most often used is the HC (Fig. 21-16), which is measured on the same image as that used for the BPD.99 Inner and outer orbital diameters can be roughly correlated with gestational age145 as well as transcerebellar diameter.148
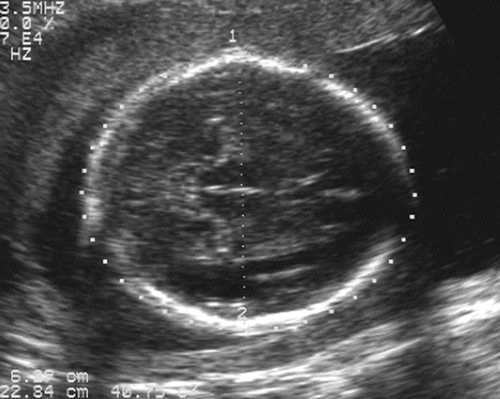 FIG. 21-16. Head circumference measurement of 22 cm in a 25-week gestation. The measurement is made around the outer periphery of the head at the same level at which the biparietal diameter is obtained (calipers). |
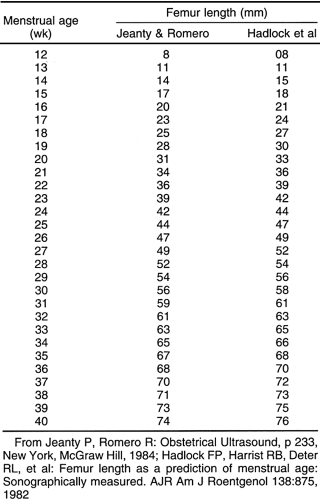
Transcerebullar diameter can also be correlated with gestational age (Table 21-3). This measurement is useful in the second and third trimesters, with a 95% confidence limit of ±1 week between 14 and 22 weeks.164 This measurement is most easily obtained with the use of a real-time scanner (Fig. 21-17). The iliac bone is the easiest to find. After this bone is found, the transducer should be rotated anteriorly until the long bright echo is identified. This allows measurement of the full length of the ossified diaphysis of the femur. Multiple images for measurements should be obtained until a confident estimate of the greatest femur length is achieved. With high-resolution real-time scanners, the distal femoral and proximal tibial epiphyses can be identified later in pregnancy.42 The distal femoral epiphysis and the proximal tibial epiphysis are the most widely used radiographic standards for estimation of gestational age. The distal femoral epiphysis is usually visible by the 36th to 37th weeks and the
proximal tibial epiphysis by the 38th week. However, there is wide normal variation, ranging from 32 to 38 weeks for the distal femoral epiphysis and 33 to 41 weeks for proximal tibial epiphysis.188 Charts that correlate the sonographic lengths of the humerus, ulna, and tibia with gestational age112 are useful when it is difficult to obtain an accurate femur length. They are also helpful in the evaluation of fetal skeletal dysplasias.
proximal tibial epiphysis by the 38th week. However, there is wide normal variation, ranging from 32 to 38 weeks for the distal femoral epiphysis and 33 to 41 weeks for proximal tibial epiphysis.188 Charts that correlate the sonographic lengths of the humerus, ulna, and tibia with gestational age112 are useful when it is difficult to obtain an accurate femur length. They are also helpful in the evaluation of fetal skeletal dysplasias.
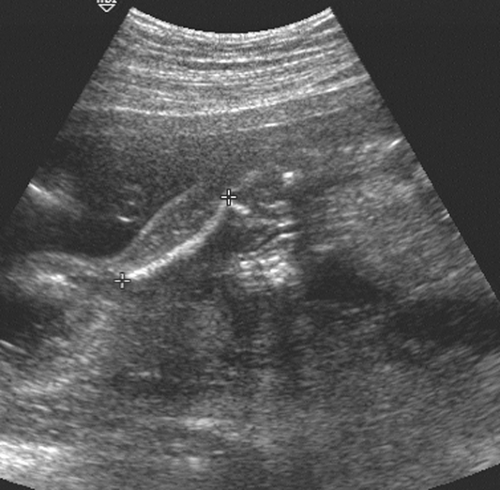 FIG. 21-17. Femur length of 2.9 cm measured in a 19-week fetus. The calipers show the correct measurement. |
 |
The fetal AC measurement is obtained at the level of the stomach and the intrahepatic portion of the umbilical vein (Fig. 21-18). It may be calculated either as the length of the outer perimeter of the abdomen (usually done automatically in most scanners with an ellipse) or by the formula using two orthogonal diameters:
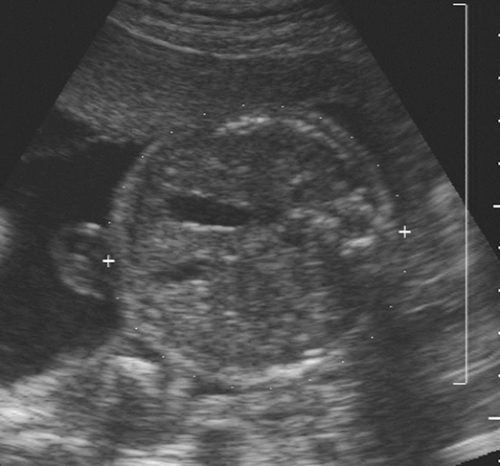 FIG. 21-18. Abdominal circumference is measured at the level of the intrahepatic portion of the portal vein. This measurement of 35 cm in a 25-week fetus was obtained with the use of the electronic ellipse available on this scanner. |
AC = 1.57 × (anteroposterior diameter + transverse diameter)
Assignment of a gestational age is not always straightforward. The radiologist must be technically competent in obtaining the appropriate image and in making the appropriate measurement. Sometimes the fetal position compromises the ability to obtain the optimum image, and this must be considered when the value of a single parameter must be judged. The following guidelines should be used: (1) the normal variation of any biologic parameter that is measured generally increases with gestational age; (2) the CRL in the first trimester provides the most accurate estimation of gestational age; and (3) the mean menstrual age calculated from BPD, HC, AC, or FL measurements are accurate to ±1
week from 16 to 26 weeks and to ±2 to 3 weeks from 26 weeks to term. However, the practitioner must feel comfortably certain that the measurements used to estimate gestational age were obtained on the appropriately oriented images and that the measurements were accurately determined. Measurements of different physical parameters that correspond to within 1 to 2 weeks, depending on the gestational age, increase the level of confidence.
week from 16 to 26 weeks and to ±2 to 3 weeks from 26 weeks to term. However, the practitioner must feel comfortably certain that the measurements used to estimate gestational age were obtained on the appropriately oriented images and that the measurements were accurately determined. Measurements of different physical parameters that correspond to within 1 to 2 weeks, depending on the gestational age, increase the level of confidence.
Assessment of the Fetus
The technical improvements and proliferation of ultrasound equipment in the past decade have greatly enhanced the assessment of fetal development and have allowed the identification of many fetal morphologic abnormalities. Ultrasonography can provide detailed analysis of fetal anatomy beginning early in pregnancy, and with real-time ultrasonography fetal activities such as breathing, swallowing, coarse and fine motor movements, and cardiac activity can be monitored closely.
Consider the following aspects of normal fetal development. As previously mentioned, with transvaginal ultrasonography the earliest time that a fetal pole can be identified is at about 5 menstrual weeks. The flickering motion of fetal cardiac activity should be seen on real-time transvaginal ultrasound examination in all embryos with a CRL of 5 mm or more.115 Between 5 and 10 weeks, a small cystic structure can be identified in the chorionic fluid separate from the fetal pole (Fig. 21-19). This is the yolk sac, the site of early blood formation, and it contributes to the development of the gastrointestinal tract. This is a normal structure and should not be mistaken for an anomaly.
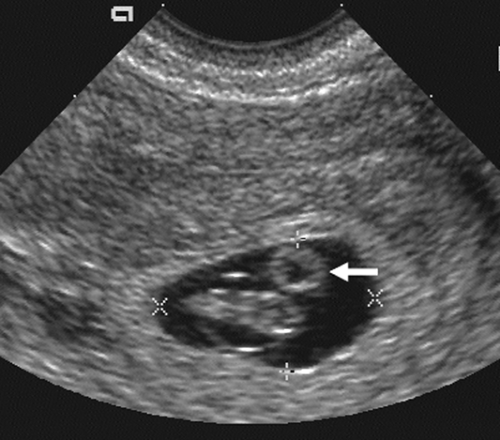 FIG. 21-19. Magnified view of a 7-week gestational sac with an embryo of 9-mm crown-rump length surrounded by a thin membrane from the developing amnion. Anterior to the embryo is a small yolk sac (arrow). |
By the late first trimester, most intracranial anatomy is visible, particularly with the transvaginal study. Most of the calvarium is filled with large, fluid-filled ventricles surrounded by a small amount of smooth primitive brain. As the brain develops throughout pregnancy, there is a progressive increase in the volume of brain tissue and a relative decrease in the size of the ventricles. The echogenic choroid plexi are prominent structures early in fetal brain development and gradually decrease in relative size with increasing gestational age. The best measure of the size of the ventricles is the transverse diameter of the ventricular atrium, which should measure 10 mm or less throughout pregnancy73 (Fig. 21-20). The atrium is the area at the base of the occipital horn where it meets the temporal horn and body of the ventricle. With this measurement 93% of neural tube defects can be recognized, because ventriculomegaly is an important feature and almost always present. To detect an additional 4% of neural tube defects, the posterior fossa, cerebellum, and cisterna magna must be imaged (Fig. 21-21). If the cisterna is between 2 and 11 mm, it is considered within normal limits. The Chiari II malformation associated with spina bifida shows a narrowed cisterna (less than 2 mm) and a flattened or banana-shaped cerebellum.
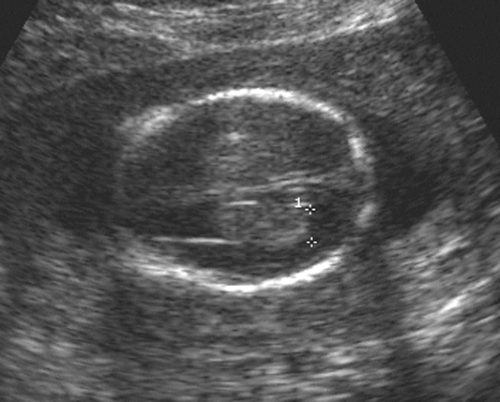 FIG. 21-20. Transaxial scan of the fetal head at the level of the atrium of the lateral ventricle. The echogenic choroid plexus is seen between the calipers that measure 6 mm. |
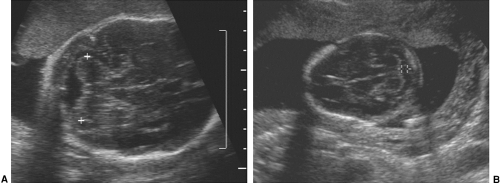 FIG. 21-21. A: Transverse scan of the posterior fossa and cerebellum of a 30-week fetus. The two cerebellar hemispheres are measured as the transcerebellar diameter of 32 mm. Between the hemispheres is the normal, slightly more echogenic, cerebellar vermis. B: This transaxial scan of a 12-week fetal head shows a 5-mm measurement of the normal cisterna magna. |
The fetal face is important to observe during the complete fetal evaluation at 18 to 20 weeks. A coronal view of the nose and mouth is essential in ruling out a unilateral or bilateral facial cleft lip. It is an easy view to obtain and of great diagnostic value. A midsagittal view of the face, mouth, and chin helps to exclude anomalies such as micrognathia or macroglossia (Fig. 21-22).
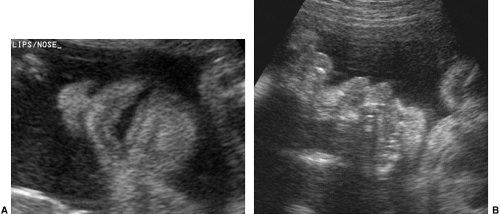 FIG. 21-22. A: A coronal scan of the face of a 28-week fetus showing the nose and lips with the mouth open. This view excludes a possible cleft lip. B: A midsagittal scan of the same fetus showing a mouth that is open but with the tongue sticking out. As a transient event it is a sign of disrespect, but when prolonged it may indicate macroglossia associated with chromosomal abnormalities. |
By the early second trimester, the fetal heart is recognizable as a distinct, contracting, fluid-filled structure. By the mid-second trimester, the cardiac chambers (Fig. 21-23) and valves can be identified and studied with two-dimensional
and M-mode fetal echocardiography. Fetal lungs appear as solid structures in the thorax with an echogenicity greater than that of the liver or spleen until late in pregnancy.
and M-mode fetal echocardiography. Fetal lungs appear as solid structures in the thorax with an echogenicity greater than that of the liver or spleen until late in pregnancy.
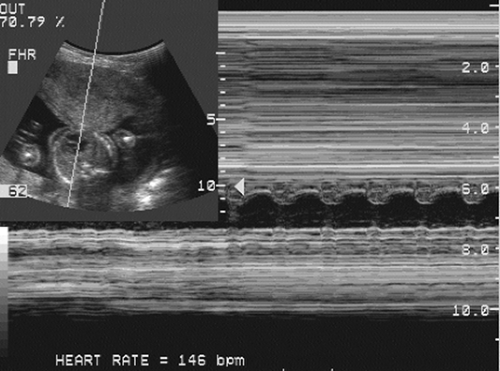 FIG. 21-23. Transverse scan through the heart of a 20-week fetus. The cursor line passes through the heart, and an M-mode tracing plots the fetal heart rate of 146 beats per minute. |
As the fetus begins to swallow amniotic fluid, the fetal stomach becomes visible as a cystic structure in the left upper quadrant (Fig. 21-24). It can be seen as early as 14 weeks and should be seen consistently after 16 to 18 weeks. The remainder of the fetal bowel is relatively echogenic and looks solid. Near term, the meconium-filled colon becomes more sonolucent, containing fine, low-level internal echoes. An important landmark to identify in the fetal abdomen is the course of the umbilical vein where it enters the portal sinus (Fig. 21-25). The transverse image of the fetal abdomen is important in the assessment of fetal somatic growth, which is discussed later. The umbilical vein should not be mistaken for the fetal gallbladder, which can be seen later in the second trimester.
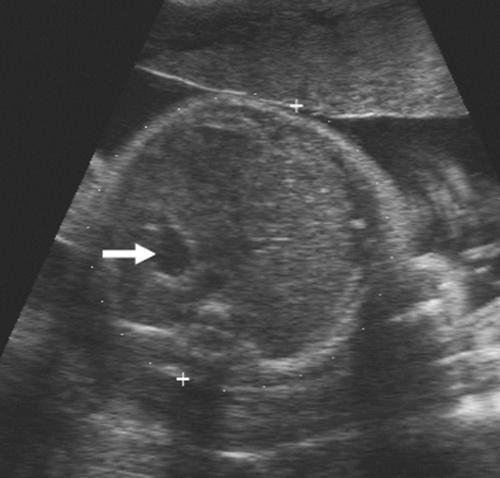 FIG. 21-24. Transverse scan through the upper abdomen of a 32-week fetus. The echogenic liver is seen filling the right side of the abdomen, and the fluid-filled stomach (arrow) is on the left. |
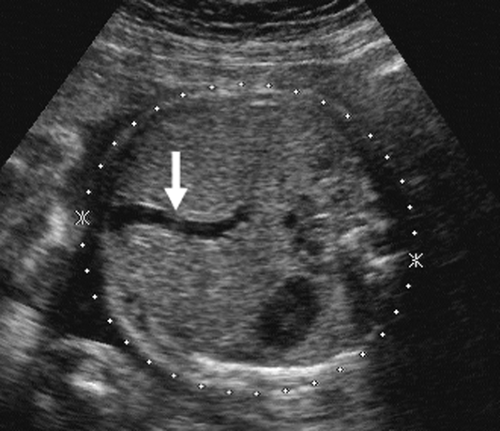 FIG. 21-25. Transverse scan through the upper abdomen and liver showing the umbilical vein (arrow) becoming part of the portal vein. |
The fetal kidneys can be identified at as early as 15 weeks’
gestation.132 It is more important to document renal function by identifying the fluid-filled fetal urinary bladder in the pelvis. The bladder can be seen at as early as 14 weeks’ gestation and should always be identified after 18 weeks’ gestation (Fig. 21-26). The fetal bladder may empty over a 30-minute to 2-hour period; if it is not visualized on the initial examination, the fetus should be re-scanned every 30 to 45 minutes until the bladder is identified.
gestation.132 It is more important to document renal function by identifying the fluid-filled fetal urinary bladder in the pelvis. The bladder can be seen at as early as 14 weeks’ gestation and should always be identified after 18 weeks’ gestation (Fig. 21-26). The fetal bladder may empty over a 30-minute to 2-hour period; if it is not visualized on the initial examination, the fetus should be re-scanned every 30 to 45 minutes until the bladder is identified.
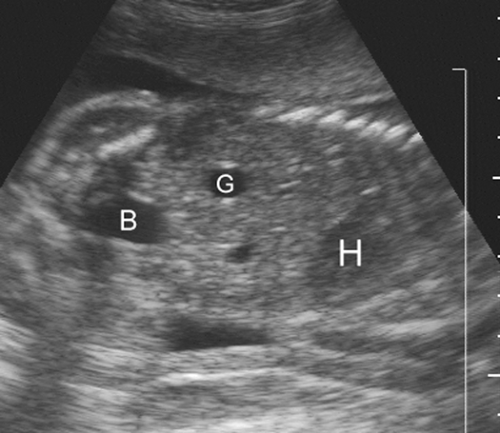 FIG. 21-26. Coronal scan of the 22-week fetal trunk demonstrating the heart (H), gall bladder (G), and urinary bladder (B). |
The fetal spine usually is visualized in the coronal plane to assess the widths between the pedicles throughout the length of the spine (Fig. 21-27). Aside from the normal flaring in the cervical region, no localized widening should occur; if widening is present, a spina bifida must be ruled out. The spine is also assessed from the posterior aspect of the fetus in a sagittal view looking for masses such as meningomyelocele or absence of the spinous processes. Finally, each segment should be scanned in the transverse plane to assess that the posterior elements are pointing toward one another, divergence being a sign of spina bifida.
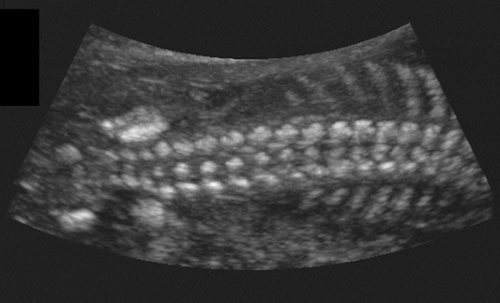 FIG. 21-27. This is a coronal scan of the spine of a 20-week fetus. To the left is the sacral spine, with the echogenic sacrum seen on either side. The pedicles and vertebral bodies are all seen together because this is a special thick slice giving a three-dimensional appearance. Normally only the pedicles or the vertebral bodies would be seen in one plane. To the right is the thoracic spine and lower six ribs. |
The fetal hands and feet are essential to visualize during a routine scan at 18 to 20 weeks’ menstrual age. They can
be seen earlier, but by this time they are easily observed and should be counted to ensure the correct number of limbs and digits. The hand that opens is normal, while the hand that remains clenched may indicate a chromosomal abnormality. One can also look for extra digits or ones that are overlapping or fused. A full fetal survey with adequate examination of all limbs requires skill, patience, and quality equipment (Fig. 21-28).
be seen earlier, but by this time they are easily observed and should be counted to ensure the correct number of limbs and digits. The hand that opens is normal, while the hand that remains clenched may indicate a chromosomal abnormality. One can also look for extra digits or ones that are overlapping or fused. A full fetal survey with adequate examination of all limbs requires skill, patience, and quality equipment (Fig. 21-28).
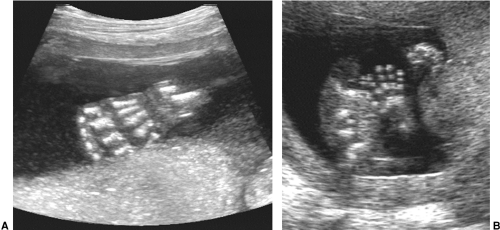 FIG. 21-28. A: Foot of a 21-week fetus taken with the thick-slice technique to show all of the metatarsals and phalanges. B: A conventional scan of the hand of a 16-week fetus. The echogenic bones of the fingers and thumb are seen to be flared out. This is a normal appearance. |
The fetal aorta usually can be seen from about 16 weeks onward. With high-resolution scanners the major branches, including the iliac, brachiocephalic, and carotid arteries, can be seen (Fig. 21-29).
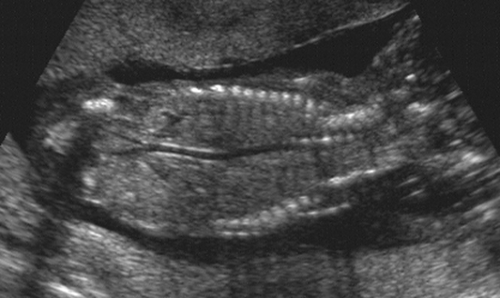 FIG. 21-29. Coronal scan of the trunk of a 16-week fetus demonstrating the thoracic and abdominal portions of the aorta and the common iliac arteries. |
The discussion of the ultrasound diagnosis of fetal anomalies is beyond the scope of this chapter. Table 21-4 lists some anomalies that have been diagnosed and provides references to papers describing them. Amniotic fluid volume is an important indicator of the presence of a possible fetal anomaly. Open neural tube abnormalities, obstructive gastrointestinal tract defects proximal to the distal small bowel, some fetal skeletal dysplasias, and some cardiac defects are fetal abnormalities associated with polyhydramnios (increased amounts of amniotic fluid). Obstructive genitourinary anomalies and agenesis of the kidneys are associated with oligohydramnios (markedly reduced amniotic fluid). The presence of polyhydramnios or oligohydramnios is not a definite indication of a fetal anomaly, because polyhydramnios can be idiopathic or associated with maternal diabetes,
Rh incompatibility, or multiple gestations.2 Oligohydramnios of varying degrees can result from premature rupture of the membranes or can be associated with a growth-retarded fetus that is structurally intact.
Rh incompatibility, or multiple gestations.2 Oligohydramnios of varying degrees can result from premature rupture of the membranes or can be associated with a growth-retarded fetus that is structurally intact.
 |
Ultrasound examination is extremely useful in assessing fetal growth.108 Growth-retarded fetuses exhibit a much higher neonatal morbidity and mortality. Intrauterine growth retardation (IUGR) may result from maternal causes, such as severe diabetes, renal disease, hypertension, or drug abuse, or from primary fetal abnormalities, such as congenital
anomalies, chromosomal abnormalities, or congenital infection. Primary placental abnormalities can result in IUGR as well. Generally, maternal causes and primary placental abnormalities result in placental insufficiency, leading to asymmetrical IUGR. Primary fetal abnormalities usually result in symmetrical IUGR. Symmetrical IUGR can be distinguished from asymmetrical IUGR by the HC-AC ratio. The HC measurement is obtained on the same image used for the BPD. AC is measured on a transverse image of the upper abdomen through the liver at the level of the umbilical vein. This ratio is normally greater than 1 until approximately 34 to 36 weeks, when the abdominal circumference becomes larger than the head circumference because of the deposition of increased amounts of subcutaneous fat. In asymmetrical IUGR, the most common form, there is preservation of central nervous system growth (HC) at the expense of somatic growth (AC). In symmetrical IUGR, there is proportional growth reduction of both the fetal head and body. Normal ranges for the HC-AC ratio have been compiled for various stages of gestation.33
anomalies, chromosomal abnormalities, or congenital infection. Primary placental abnormalities can result in IUGR as well. Generally, maternal causes and primary placental abnormalities result in placental insufficiency, leading to asymmetrical IUGR. Primary fetal abnormalities usually result in symmetrical IUGR. Symmetrical IUGR can be distinguished from asymmetrical IUGR by the HC-AC ratio. The HC measurement is obtained on the same image used for the BPD. AC is measured on a transverse image of the upper abdomen through the liver at the level of the umbilical vein. This ratio is normally greater than 1 until approximately 34 to 36 weeks, when the abdominal circumference becomes larger than the head circumference because of the deposition of increased amounts of subcutaneous fat. In asymmetrical IUGR, the most common form, there is preservation of central nervous system growth (HC) at the expense of somatic growth (AC). In symmetrical IUGR, there is proportional growth reduction of both the fetal head and body. Normal ranges for the HC-AC ratio have been compiled for various stages of gestation.33
In addition to HC-AC ratio, fetal weight can be estimated. A variety of complicated formulas have been devised using BPD, FL, AC, and other factors. A useful chart compiled by Hadlock and colleagues97 estimates fetal weight with an accuracy of ±15% to 18% from the BPD, AC, and FL. A table of weights is used to estimate the 10th, 50th, and 90th percentiles.67 The previously described measurements of physical parameters to estimate gestational age can also be used to quantify fetal growth rate. Serial examinations at 2- to 3-week intervals permit the plotting of a growth curve for an individual fetus when necessary. MRI may be useful in identifying IUGR. Growth-retarded fetuses have markedly reduced body fat, which can be identified on MRI studies.131
Real-time ultrasonography enables assessment of fetal well-being through documentation of fetal activity. This sonographic biophysical profile includes assessment of variations in the fetal heart rate as well as fetal breathing activities, coarse and fine motor activity, fetal tone, and amniotic fluid volume.142,210 Several scoring schemes provide useful information to the obstetrician, who must decide whether the intrauterine environment of the fetus has become hostile rather than protective.
Doppler ultrasonography is the technique whereby blood flow within vessels is displayed as a color image that is superimposed on the high-resolution gray-scale anatomic image. The Doppler signal can be generated by the multicrystal transducers and is displayable in real time, simultaneously with the gray-scale image. These signals can be displayed as color Doppler images, which show velocity and direction; power Doppler images, which shows very low velocity but no direction; and spectral Doppler images, which show the velocity wave pattern. Doppler ultrasonography is being used increasingly to aid in the assessment of fetal well-being by noninvasive evaluation of fetoplacental and uteroplacental blood flow.50 Whereas direct velocity measurements can be made from fetal vessels such as the carotid arteries and aorta, analysis of the Doppler waveform is the most commonly used technique. A variety of indices can be used to quantify the Doppler waveform, including the resistive index, the pulsatility index (PI), and the systolic-to-diastolic (S-D) ratio.35 Currently, the measurements most commonly obtained are the ratio of the velocity at peak systole to the velocity at end diastole (S-D ratio) and the PI in the midportion of the umbilical artery. Ranges of normal for various stages of pregnancy have been developed, but the S-D ratio and PI usually decline with gestational age.4 Abnormally elevated umbilical artery S-D ratios have been associated with IUGR, pre-eclampsia, Rh incompatibility, placental abruption, and severe maternal illness.35 Absent or reversed blood flow in diastole is associated with an increased risk of fetal morbidity and mortality.
Fetal Death
Radiographic signs have been described in association with intrauterine fetal death. Overlapping of the bones of the skull (Spalding’s sign), marked curvature of the fetal spine, and gas in the fetal circulatory system are the most easily recognized signs. Ultrasound examination has replaced radiographic examinations for suspected fetal death.171 The documentation of absent fetal cardiac activity and absent extremity motion is now the most sensitive way of detecting fetal death. One must be confident of a technically satisfactory examination with the ability to view the fetal thorax in an unobstructed fashion. Current real-time ultrasound equipment has a frame rate that is adequate to see fetal cardiac activity if present. Cardiac motion can be recorded with the use of M-mode, which displays the moving heart over a period of seconds, or color Doppler to detect motion or blood flow (see Fig. 21-23). Fetuses have periods of relative inactivity in which there is no motion of the extremities or the trunk. However, repeated examination over 15 to 60 minutes without documented fetal extremity motion or fetal cardiac activity is indicative, if not diagnostic, of fetal death. It is helpful to try fetal stimulation with manual ballottement of the anterior abdominal wall, which sends a “shock wave” through the amniotic fluid and may help to stimulate a fetus, particularly a very small one. Within days of the death of a fetus, the fetal skin becomes edematous and alterations in the fetal anatomy become obvious (Fig. 21-30). Gross fetal edema may also be seen in live, albeit at risk, hydropic fetuses. Flattening and overlapping of the fetal skull bones with dissolution of the intracranial anatomy is seen. The internal anatomy of the trunk is difficult to define. After a few weeks, the fetal anatomy is markedly distorted and the fetus may appear as an ill-defined echogenic structure with no easily identifiable anatomy except for a deformed fetal skull.
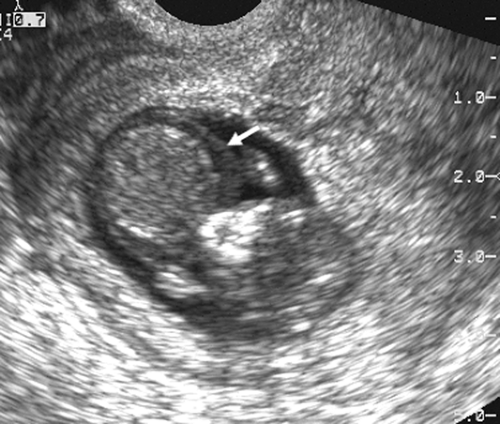 FIG. 21-30. This coronal scan of a dead 10-week fetus shows marked edema (arrow) of the skin around the head and neck. |
The Placenta
Related posts:
Stay updated, free articles. Join our Telegram channel

Full access? Get Clinical Tree


