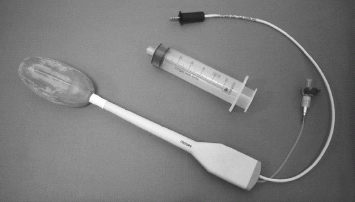
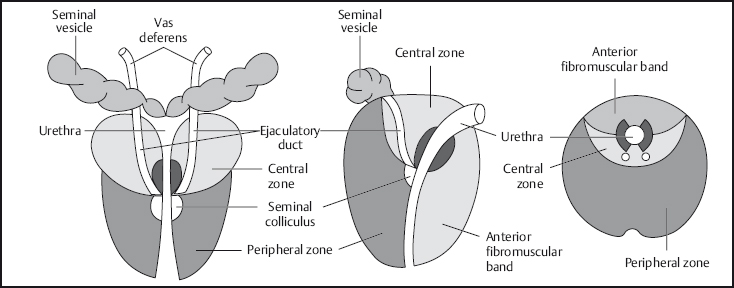
11 The Prostate and Seminal Vesicles In recent years MRI of the pelvic organs has gained increasing importance. Technical refinements and the advent of magnetic resonance spectroscopy (MRS) have markedly improved the sensitivity and specificity of MRI in imaging the prostate. But only through the combination of an endorectal coil with a body or torso phased-array coil has it become possible to obtain detailed images of the zonal anatomy of the prostate, which are the basis for evaluating pathology. The indications for prostate MRI derive directly from the findings of the basic clinical examinations, digital rectal examination (DRE), and transrectal ultrasound (TRUS). In the setting of prostate cancer, MRI is used for the staging of known cancer or as a problem-solving tool, for example in patients with elevated prostate-specific antigen (PSA) but inconclusive palpation findings or normal TRUS, or in patients with increasing PSA levels and repeated negative biopsies. In addition, MRI is used to detect recurrent cancer after radical prostatectomy and to determine the extent of prostate sarcoma. The sensitivity of prostate MRI can be improved by additional MR spectroscopy and a dynamic contrast-enhanced study, especially in terms of differentiating malignancies from inflammatory conditions, fibrosis, and prostatic intraepithelial neoplasia (PIN). It is also expected that MRI can help lower the false-negative rate of prostate biopsy by enabling better biopsy guidance on the basis of the combined findings of T2w sequences, dynamic contrast-enhanced imaging, and MR spectroscopy. When MRI was first introduced, only the whole-body resonator was available for imaging of the prostate. The resulting images provided good overviews of the pelvic organs, lymphatic drainage, and bony structures; however, the signal-to-noise ratio (SNR) was inadequate for high-resolution prostate imaging. Only thanks to the introduction of endorectal coils (Fig. 11.1), which are now state of the art in prostate imaging, used in combination with a body or torso phased-array coil, has it become possible to obtain detailed images of the prostate and surrounding structures1,2. Fig. 11.1 Endorectal coil. The patient is examined in the supine position. After a DRE, the endorectal coil is inserted and kept in place at the level of the prostate by inflating the surrounding balloon with a total volume of 60–100 mL until the patient reports mild pressure. To secure the coil firmly in place, it may be additionally fixed to the thigh. Next, the body phased-array coil is placed. Making the patient comfortable, e. g., with the knees supported, can help reduce motion artifacts. Respiratory artifacts are minimized by using an abdominal belt, which is fitted above the symphysis pubis with slight pressure. Artifacts caused by bowel movement are minimized by intravascular/intramuscular injection of butylscopolamine or glucagon (after excluding contraindictions). Accurate slice prescription for axial imaging, e. g., parallel to the acetabular roof, is important for symmetrical visualization of the peripheral zone and facilitates image interpretation. Coronal images should be acquired parallel to the longitudinal axis of the seminal vesicles, which ensures optimal evaluation of the base of the seminal vesicles, the vasa deferentia, and seminal vesicle involvement in patients with peripheral zone cancer. Only slight angulation is required in most cases because the rectum is expanded by the coil. If the axial and coronal images are inconclusive (e.g., bladder neck), additional sagittal images may be acquired to supplement the examination. T2w TSE images in at least two planes are acquired to evaluate prostate zonal anatomy and localize pathologic processes (Table 11.1). Slices covering the prostate should not be > 3 mm thick. GRE sequences are inferior for delineation of prostate cancer and its zonal localization. Additional T1w images, acquired with fat suppression in selected cases, are needed to differentiate fatty tissue, demonstrate postbiopsy changes, and evaluate locoregional lymph nodes. The following sequence protocol is recommended for MRI of the prostate: No contrast medium is needed for a standard MRI examination of the prostate; however, a contrast-enhanced scan may occasionally provide useful information on inflammatory conditions and malignant tumors (prostate cancer with suspected rectal or bladder involvement, sarcoma). Contrast-enhanced MRI of the prostate is performed using a nonspecific extracellular Gd-based contrast medium at a dose of 0.1 mmol Gd per kg body weight. A dynamic MRI study consists of a series of T1w images of the prostate acquired at short intervals after contrast administration. Quantitative analysis of the enhancement slope and peak enhancement may improve the differentiation of normal and abnormal tissue in individual cases. Dynamic prostate MRI can be performed with an inversion recovery TurboFLASH sequence (TR/TE, 1300 ms/4.2 ms; TI, 654 ms; flip angle, 13°; field of view [FOV], 360 mm; 128 × 128 matrix). Acquisition of 10 4-mm slices results in a scan time of 13 s for each phase.2–5 The normal adult prostate is roughly the size and shape of a chestnut and weighs ca. 15–20 g. The prostate gland surrounds the urethra between the neck of the urinary bladder and the urogenital diaphragm. In shape it is like an inverted pyramid with its base directed upward and the apex pointing down. Laterally, the prostate b orders on the middle portions of the levator ani muscles. Each of the paired seminal vesicles is approximately 5–6 cm long and 1 cm wide and extends from the top of the prostate in a superolateral direction lateral to the vasa deferentia. The prostate is surrounded by the visceral leaf of the abdominal fascias. It is separated from the rectum by the Denonvilliers fascia, which consists of a layer that is contiguous with the external longitudinal rectal muscles and a thicker fibroelastic membrane that covers the entire posterior surface of the prostate and extends upward to above the seminal vesicles and the rectovesical pouch, the lowermost extension of the peritoneal cavity. Fig. 11.2 Coronal, sagittal, and axial diagrams of prostate anatomy. Anterolaterally, there is an extensive venous complex. At the prostate b ase, the neurovascular pathways divide into an upper bundle (the neurovascular bundle), whose nerve fibers penetrate the prostate capsule on the posterolateral aspect, and a lower bundle, which courses to the apex and the corpora cavernosa through the Denonvilliers fascia. The widely accepted zonal subdivision of the glandular parts of the prostate goes back to the detailed anatomic and histologic studies presented by McNeal et al. in 1972.6 The anatomic landmark is the urethra, dividing the prostate into an anterior fibromuscular part and a posterolateral glandular part. The prostatic urethra turns 35° at its midpoint in the gland (the urethral angle). The ejaculatory ducts run parallel to the urethra and open into it in the area of the seminal colliculus. The glandular portion of the prostate is subdivided into three zones: On T1w images, the normal prostate is of homogeneous intermediate signal intensity, slightly higher than that of muscle. The zonal anatomy is best appreciated on T2w images. The peripheral zone is seen as a sickle-shaped area of homogeneous high signal intensity on axial images. The central gland comprising the central and transitional zones contains areas of high and low signal intensity. The transitional zone cannot be reliably differentiated, for two reasons: on the one hand, it constitutes only a small portion of the entire prostate (5–10 %) and, on the other hand, it is identical to the peripheral zone in composition because both zones have the same embryonic origin. The signal difference between the peripheral zone and the central glandular tissue is due to their different histologic makeup. While the stromal tissue of the central zone contains acini surrounded by long, densely packed smooth muscle fibers, the acini in the peripheral zone are small and thin-walled and surrounded by only a few muscle fibers. The low signal intensity of the central zone is thus attributable to the high content of smooth muscle.7 At the same time, differences in histologic composition suggest functional differences in secretion or fluid content. The anterior fibromuscular band is isointense to muscle on T2w images. When an endorectal coil is used, the prostate capsule is seen as a line of low signal intensity around the high-signal-intensity peripheral zone in the lower and mid portions of the prostate. On T2w TSE images, the capsule is also delineated from the high-signal-intensity fat. The neurovascular bundle is seen as a triangle, in which the nerves and vessels may be discernible as punctiform structures (Fig. 11.3).
V. Nicolas, D. Beyersdorff, U.G. Mueller-Lisse, W. Pennekamp, and C.M. Heyer
Introduction
Indications
Imaging Technique
Imaging Planes
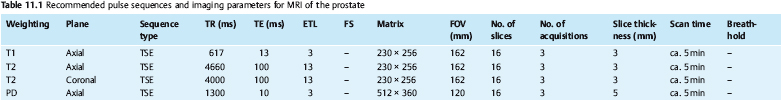
Pulse Sequences
Contrast Media
MRI Appearance of Normal Anatomy
| T2w | T1w | |
| Peripheral zone | ++ | 0 |
| Central gland | +/- | 0 |
| Prostate capsule | – | Not seen |
| Seminal vesicles | ++ | 0 |
| Fatty tissue | + | ++ |
| Muscle | – | 0 |
| Benign prostatic hyperplasia | +/- | 0 |
| Tumor | – | Not seen |
| Postbiopsy hemorrhage | + | ++ |
The seminal vesicles have the same signal intensity as the prostate on T1w images. Their lobulated glandular structure is only seen on T2w images. Intraluminal signal intensity is higher than that of muscle in adult men and decreases slightly with age. The borders of the tubules and the capsule have low signal intensity.
Table 11.2 summarizes the signal intensities of the prostate and adjacent tissues on T2w and T1w images.
(1H) MR Spectroscopy
Three-dimensional MR spectroscopy (3D MRS), also known as chemical shift imaging (CSI) and MR spectroscopic imaging (MRSI), is predominantly performed using spin echo sequences (SE; PRESS—point-resolved spectroscopy)8,9 or STEAM sequences (stimulated echo acquisition mode)10 for excitation and readout as well as spatial encoding. In general, STEAM sequences are used when TEs < 30 ms are desired, while PRESS and SE sequences are preferred for examinations with longer TEs.11 In 3D MRS, the number of adjacent voxels in the different spatial dimensions is determined by the number of phase-encoding steps in each direction (Fig. 11.4). The SNR improves with each phase-encoding step, but the duration of the examination also increases in direct proportion to the number of steps.
In MR spectroscopy, the received signal is decomposed into its frequencies and displayed in the form of a frequency spectrum (Fig. 11.5). The resonance frequency of characteristic hydrogen bonds of a metabolic product is given using the chemical shift of trimethylsilyl propionate (TSP) as reference at a given field strength and is expressed in parts per million (ppm). Using the ppm scale, it is easier to identify a metabolite because it is independent of magnetic flow density and resonance frequencies are always at the same site in each 1H-MR spectrum. In this way it is possible to identify a biochemical substance in vivo if its magnetic resonance frequency is known from in-vitro studies. If the strong signals of water and fat are suppressed by applying frequency-selective saturation pulses, one can obtain frequency spectra that represent the peaks of metabolic products of which only small concentrations are present. There are three main metabolites that are of interest in the prostate:
- citrate, which is an intermediate of the Krebs cycle and is accumulated in the prostate and secreted into the glandular ducts
- choline, which arises in association with the composition/decomposition of cell membranes
- creatine, a component of high-energy phosphates.12–18
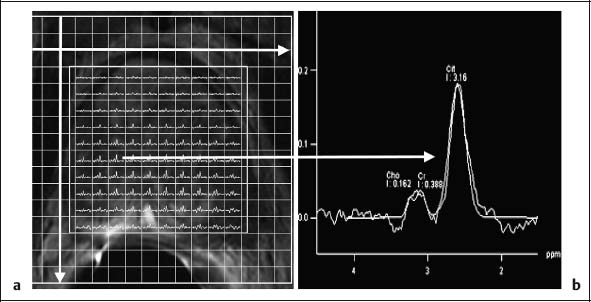
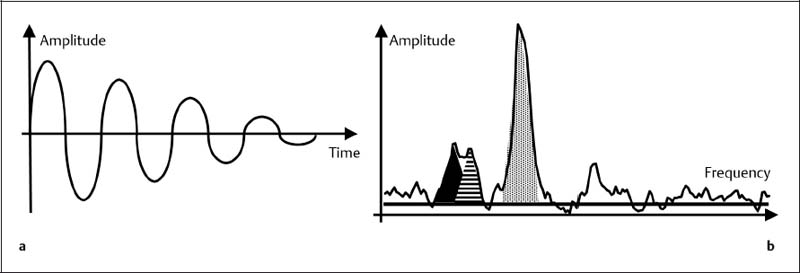
Fig. 11.5a, b The MR signal (a) serves to generate the frequency spectrum (b) of MR spectroscopy by means of Fourier transform. In-vivo MR spectroscopy of the prostate does not allow direct quantification. The ratio of the area integrals of choline (black) plus creatine (hatched) to citrate (dotted) differentiates normal tissue from prostate cancer in the peripheral zone.
In-vivo detection of these metabolic products requires not only suppression of fat and water signals but also shimming by additional small magnetic fields to eliminate inhomogeneities of the specimen or patient. The SNR is improved by multiple acquisitions or phase-encoding steps. Saturation bands placed around the target volume will reduce signal contamination from outside the volume.8,19–21 The signal acquired in MRS in the form of FID (free induction decay) needs to be postprocessed, typically in several steps: zero filling to improve digital frequency resolution, apodization to enhance the spectral signal versus electrostatic noise by means of Gauss or Lorentz filtering, Fourier transform into a frequency spectrum, and correction of the b aseline and phase of the frequency spectrum.11
MR Spectroscopy of the Prostate: Biochemical Basis
Normal epithelial cells of the human prostate accumulate citrate from the Krebs cycle. The citrate is stored in the epithelial cells and glandular ducts in the presence of zinc ions.13,22,23 For this reason the citrate concentration is very high in the peripheral zone and very low in the central zone. In the transitional zone, which is the site of benign prostatic hyperplasia (BPH), the citrate concentration is the same as in the peripheral zone if the glandular component of BPH is large but markedly lower if there is a large stromal component. With decreasing cellular differentiation, prostate cancer loses the enzymes that are necessary for storing and secreting citrate. The higher the cell turnover of cancer, the more citrate is introduced into energy metabolism.13,22 Moreover, prostate cancer compresses or infiltrates the glandular ducts, thereby reducing the space where citrate can be found. The higher cellular turnover of tumor tissue increases the concentration of free, choline-rich molecules in the cytosol and interstitial space,24 which are important components of cell membranes. 1H MR spectroscopy of the prostate differentiates normal prostate tissue with high citrate peaks and low choline peaks from cancer tissue with low citrate peaks and elevated choline.12–14,18,25
MRI Appearance of Pathologic Entities
Anomalies
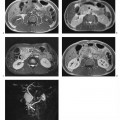
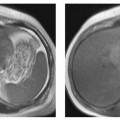
Congenital prostate anomalies such as agenesis and hypoplasia are frequently associated with other anomalies of the urogenital tract. There may be complete absence of the prostate or the proportion of glandular tissue is reduced. Congenital prostate cysts are the result of anomalous development of remnants of the m$uUllerian or wolf-fian ducts. The most common cysts are retention cysts that develop in the prostatic acini. Other causes are prostatitis and trauma.26 MRI permits accurate determination of the site and size of prostatic cysts.27 Müllerian duct cysts, which are attached to the verumontanum by a connective tissue stalk, and utricle cysts, which may communicate with the urethra, are midline lesions. The signal intensity of the cyst fluid can vary, for example, when there is superinfection or intralesional hemorrhage. Uncomplicated cysts containing serous fluid are of the same signal intensity as urine on T1w and T2w images (Fig. 11.6).
In agenesis of the seminal vesicles, one or both seminal vesicles may be absent. The condition is typically associated with renal agenesis, absence of the vas deferens, or a congenital vasoureteral communication. Less common are ectopic seminal vesicles and ectopic openings of the ureters and seminal vesicle ducts.
Inflammatory Conditions
Bacterial prostatitis (typically caused by E. coli, gonococci, staphylococci, or streptococci) is most commonly due to an ascending infection through the urethra or a descending infection via the urinary bladder or the vas deferens, or occurs after prior surgery. Hematogenous spread is less common. A prostatic abscess usually develops as a complication of acute prostatitis.
The diagnosis is established clinically and sonographically. MRI does not provide any clinically relevant diagnostic information, and the changes seen on MRI are nonspecific without knowledge of the patient’s clinical signs and symptoms. Use of an endorectal coil is contraindicated in acute prostatitis because placement may lead to dissemination of pathogens in the bloodstream.
Acute prostatitis is seen as diffuse enlargement of the prostate on T1w images. On T2w images, inflamed tissue has high signal intensity and may be difficult to distinguish from the high-signal-intensity peripheral zone. Prostatic abscess is depicted as a focal lesion of low signal intensity on T1w images and high signal intensity on T2w images.28 Chronic prostatitis leads to connective tissue proliferation with scar formation in the prostate, seen as low-signal-intensity areas on T2w images. Such scars cannot be differentiated from cancer on the basis of their imaging appearance and signal intensity when they are located in the peripheral zone.
Inflammation of the seminal vesicles typically occurs secondary to prostatitis. The MR appearance is variable. In the acute stage, there is enlargement of the seminal vesicle with normal T1 signal intensity. Hemospermia leads to an increase in signal intensity. T2 signal intensity is increased in acute inflammation, while chronic seminal vesicle inflammation results in a loss of signal intensity on both T1w and T2w images.
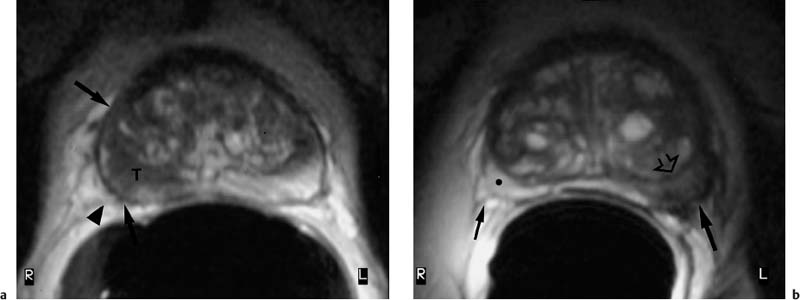
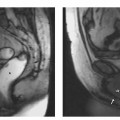
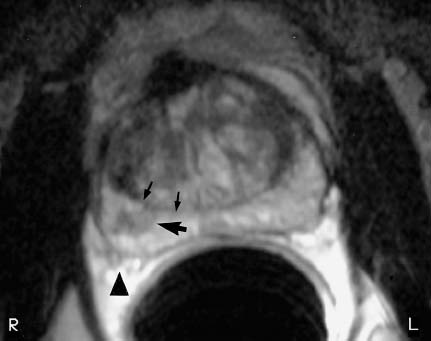
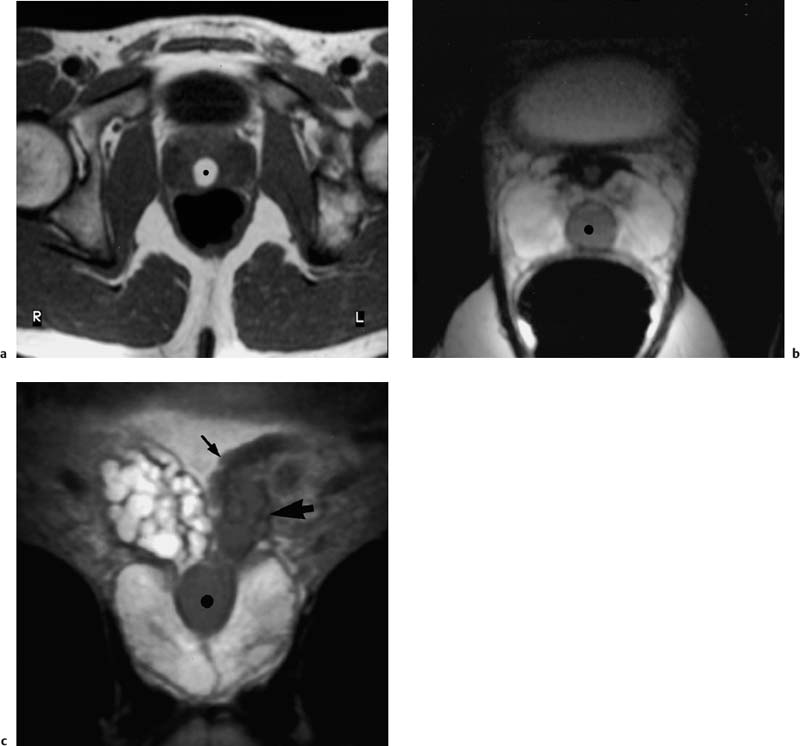
Fig. 11.7a, b Two cases of stage T3a prostate cancer with BPH. Axial T2w TSE images. a Large prostate carcinoma in the posterior aspect of the right peripheral zone (T) with extracapsular extension (lower arrow) along the neurovascular bundle (arrowhead). Mixed BPH. Upper arrow indicates the prostate capsule. b Image from second patient shows localized carcinoma in the posterior aspect of the left peripheral zone (arrow) with extracapsular extension along the neurovascular bundle. Compression of the right peripheral zone (•) by extensive, predominantly cystic, BPH, which is separated from the peripheral zone by a pseudocapsule (open arrow).
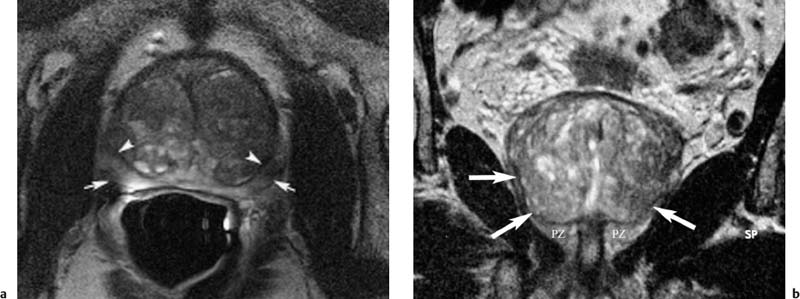
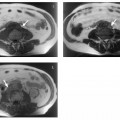
Fig. 11.8a, b BPH. Axial (a) and coronal (b) T2w TSE images. There is diffuse enlargement of the prostate with cystic components, resulting in heterogeneous appearance of the central gland. BPH is separated from the compressed peripheral zone (PZ in b) by a pseudocapsule (arrowheads in a, arrows in b). Arrows in a indicate the outer capsule of the prostate.
Benign Prostatic Hyperplasia
BPH begins as a localized proliferation in the periurethral glands and the transitional zone. As the condition progresses, there will be compression of adjacent normal glandular tissue and the urethra with subsequent urinary obstruction.
BPH has a characteristic MR appearance, but definitive tissue characterization is not possible. The signal intensity varies considerably, depending on the ratio of glandular to stromal tissue. T2w images show multiple high-signal-intensity nodules, representing hyperplastic glands with retained secretions. The nodules are surrounded by a low-signal-intensity pseudocapsule (Figs. 11.7 and 11.8). More areas of low signal intensity are depicted in BPH with a larger fibrous and muscular component. In extensive BPH, there may be marked compression of the peripheral zone, leaving only a thin band of high signal intensity on MRI. The MRI signal intensity and appearance alone do not always allow reliable differentiation of BPH from a malignant process.
Malignant Tumors
Prostate Cancer
Prostate cancer is the most common malignant tumor in men and the second most common cause of cancer death. The increasing incidence observed in recent years is mainly attributable to the introduction of the PSA test in the mid-1980s and the wider acceptance of clinical screening. It is estimated that up to 50 % of men have prostate cancer at age 50 and ca. 90 % at age 80. The cumulative risk of being diagnosed with prostate cancer is 24 % until age 85. The survival rate of prostate cancer patients has improved from 67 % to 93 % over the past 20 years: 72 % of all patients survive for over 10 years, 53 % for over 15 years.29 Various factors have contributed to this development including earlier detection of prostate cancer, better radiotherapeutic approaches, improved surgical techniques, and antiandrogen treatment.
Knowledge of the site and local extent of prostate cancer as well as presence of lymphadenopathy and/or distant metastases is crucial to devising the most suitable therapeutic strategy. The basic urologic examinations comprise DRE, TRUS, and PSA determination. If cancer is suspected, a systematic biopsy will be performed.30 Depending on patient age and concomitant diseases, radical prostatectomy is the first-line treatment for local cancer confined within the prostate, while more advanced cancer is treated by radiotherapy, possibly in combination with androgen blockade. The role of imaging is to define local tumor extent and rule out secondary tumor foci.
The vast majority of malignant prostate tumors are adenocarcinomas, accounting for up to 97 % of cases. The prognosis depends on the tumor volume,31 the TNM stage, the Gleason score,32 and the PSA level.33 A general criterion of a malignant process is neovascularization, which is seen when there is transition from hyperplasia to neo-plasia.21,34
| T1 | Clinically inapparent tumor not palpable or visible by imaging |