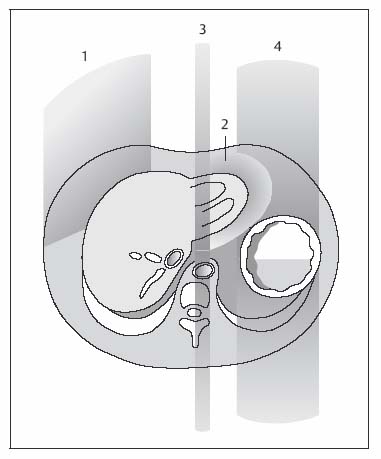
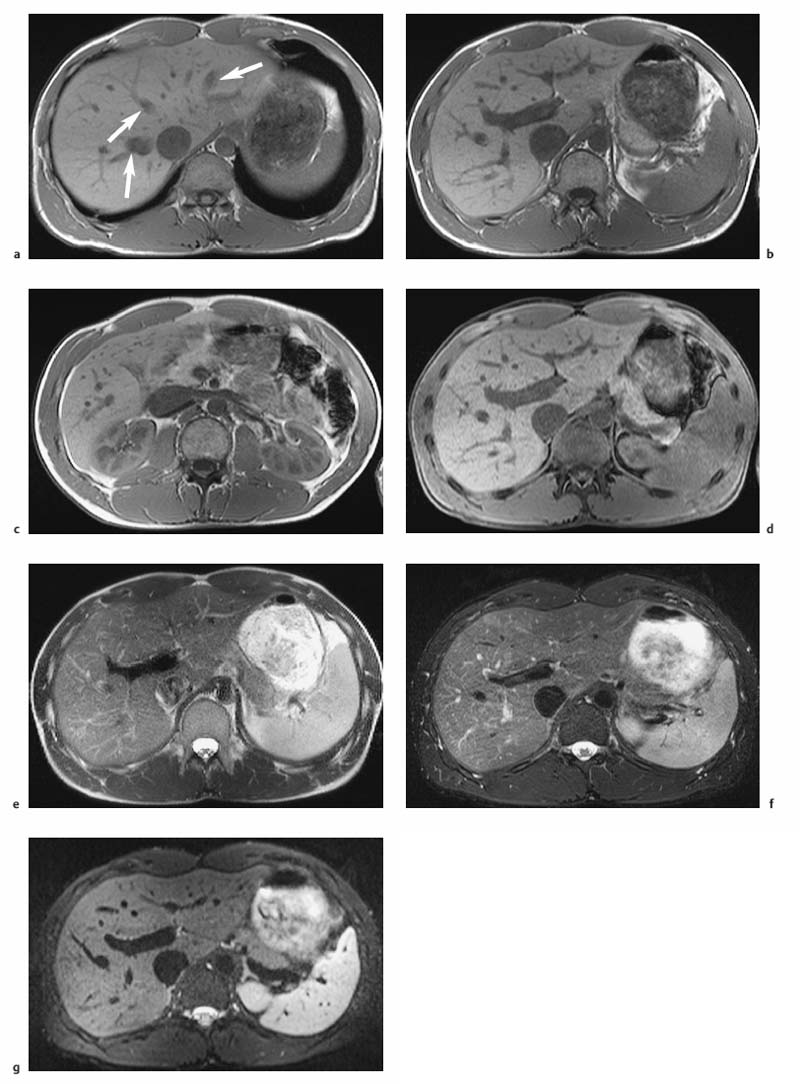
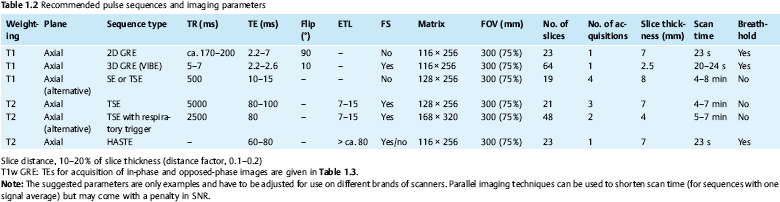
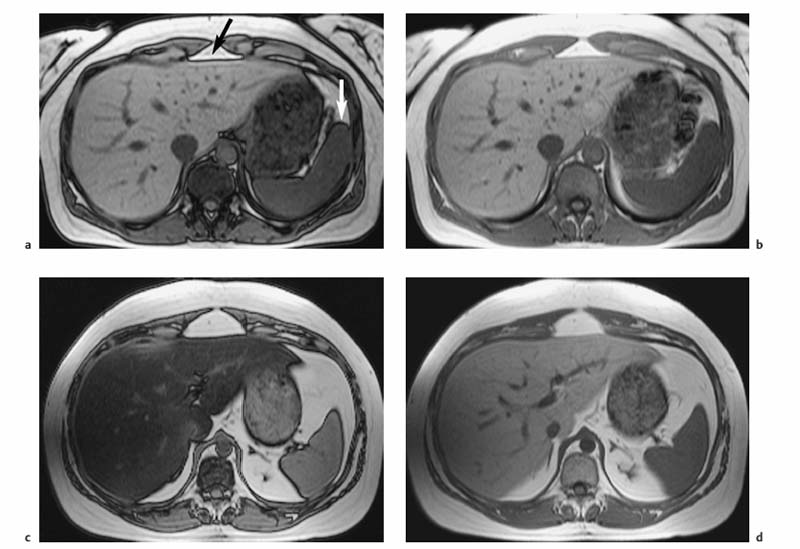
1 The Liver Continuous developments and numerous improvements over the last 15–20 years have made MRI a robust modality for imaging of the liver. The improvements pertain to technical advances and the advent of new intravenous contrast media. High-performance gradient systems and body or torso phased-array coils enable the use of fast imaging techniques with good image quality and ideally allow breath-hold imaging of the entire liver with both T1- and T2-weighted sequences. In terms of contrast-enhanced MRI, the liver is unique because it is the only organ for which several recently developed tissue-specific contrast media are available besides conventional, nonspecific Gd-based agents. Thanks to these advances, MRI has evolved into a powerful imaging tool for the detection and characterization of focal liver lesions. In this chapter we first outline the major technical aspects of liver MRI and give a brief overview of contrast media for liver imaging, then describe the MRI appearance of the most important benign and malignant focal liver lesions. We conclude by discussing the role of MRI in the detection and characterization of focal liver lesions and comparing its performance with that of CT, its fiercest competitor. The liver is the most common site of metastatic disease from a variety of primary tumors and is therefore examined in virtually all patients undergoing tumor staging. Patients with liver metastases, especially from colorectal cancer, benefit from improved surgical approaches. Resection of single or multiple liver metastases has been shown to significantly improve the 5-year survival rate if all hepatic metastases are removed and enough normal liver tissue is left (usually > 30 %) and patients have no additional extrahepaticmetastases.1,2 On the other hand, up to 20 % of the general population have noncystic benign liver tumors,3 which must be differentiated from malignant lesions. MRI is highly accurate in detecting and characterizing focal liver lesions and can therefore meet this challenge. The major indications for MRI of the liver are (Table 1.1): Patient Preparation, Positioning, and Imaging Planes Liver MRI is performed with the patient in a comfortable supine position. Most patients find it helpful if their knees are elevated with a small foam pad. Unless a body phased-array coil is used, an abdominal belt should be employed to reduce respiratory artifacts by limiting respiratory excursions if the examination is performed at high magnetic field strength. In addition, patients in whom free-breathing sequences will be acquired should be carefully instructed to breathe shallowly and regularly to minimize respiratory motion of the abdominal wall (Fig. 1.1). Careful breathing instructions are also important if respiratory-triggered sequences are planned. Finally, in patients undergoing breath-hold imaging, the breathing commands that will be given during the examination need to be explained beforehand. If intravenous contrast administration is planned, a flexible indwelling cannula is inserted, preferably into an antecubital vein, before the patient is positioned in the magnet. The cannula is connected via an extension tube to a saline-filled syringe or, if available, an MR-compatible injection pump. The axial plane is the bedrock of liver MRI. Axial images enable good evaluation and delineation of both normal anatomic structures and hepatic abnormalities in most cases, and can be directly compared with CT scans. Additional coronal or sagittal images can be obtained, for example, to better assess the relationship of a mass to hepatic vessels or to differentiate an intrahepatic from a subphrenic lesion. With the fast pulse sequences available today, several slices can be obtained during one breath-hold, and only little extra time is needed to acquire images in a further plane. Coronal images provide a good topographic overview and are also helpful when explaining findings to clinical colleagues. Coils Nearly all manufacturers of MR imagers offer body or torso phased-array coils for abdominal applications. These coils provide a better signal-to-noise ratio (SNR) than the integrated whole-body resonator. The higher signal yield is especially beneficial in conjunction with fast sequences. A relative disadvantage of these coils is the very high signal intensity of subcutaneous fat, which may accentuate motion artifacts when images are acquired with the patient breathing freely. Phased-array coils should therefore only be employed for breath-hold imaging or, if free-breathing sequences are acquired, in combination with a fat suppression technique (see below). A phased-array body coil not only improves SNR but is also necessary to perform parallel imaging (usually 4–8 elements; e.g., SENSE, sensitivity encoding). The gain in speed achieved with parallel imaging can be used either to shorten the acquisition time of a given T1w or T2w sequence or to improve resolution without a penalty in scan time.4–6 However, SNR is reduced in both cases.7 Pulse Sequences The standard liver protocol consists of unenhanced T1w and T2w pulse sequences. Imaging techniques and parameters are different for intermediate field strengths around 0.5 T, which are rarely used today, and high field strengths in the range of 1.0–1.5 T. High soft-tissue contrast is crucial for the reliable identification and characterization of liver lesions. However, contrast must always be weighed against good image quality, which results mainly from the absence of motion artifacts and high SNR. Good image quality is often equated with good visualization of anatomic detail or spatial resolution (Fig. 1.2). T1-Weighted Imaging T1w MR images of the liver are predominantly acquired using breath-hold multislice GRE sequences (e. g., FLASH, FFE), especially when imaging is performed at high magnetic field strength (Table 1.2). Breath-hold GRE sequences eliminate respiratory artifacts, and the extremely short echo times provide excellent T1 contrast. When a high-performance gradient system is available, up to ca. 25 slices can be acquired during a breath-hold of 15–25 s. The entire liver can thus be imaged with high contrast and good image quality in 1–3 breath-holds, depending on slice thickness and number of slices. Such multislice GRE sequences are also available for lower field strengths but will generate images with poorer SNR. Instead of a multi-slice GRE sequence with a TR of ca. 150 ms and a TE of ca. 5 ms, one can acquire a series of single-slice sequences with very short TRs and TEs (10–20 ms and 2–7 ms, respectively). The low intrinsic contrast resulting from such short TRs and TEs is improved by applying an inversion pulse at the beginning of each sequence (e. g., TurboFLASH or TFE). These 2D GRE sequences can be replaced with a fat-suppressed 3D GRE sequence (e.g., VIBE, volume-interpolated breath-hold examination).8 A 3D GRE sequence has the advantage of enabling acquisition of thinner slices. It is possible, for example, to reconstruct 64 2.5-mm slices by interpolation from a set of 32 slices acquired with 5.0-mm slice thickness. However, unenhanced 3D GRE sequences have a lower signal yield, resulting in poorer contrast compared with their 2D counterparts. The 3D GRE technique is therefore most suitable for dynamic contrast-enhanced studies with intravenous injection of Gd-based contrast medium or delayed imaging after intravenous injection of a hepatobiliary contrast medium (see below). If the available equipment does not allow fast imaging with adequate image quality and good contrast, the liver can be imaged in 4–8 min at intermediate field strength using conventional T1w SE/TSE or GRE sequences and multiple signal averaging. Multiple averages reduce motion artifacts by increasing SNR and improve contrast and image quality with good anatomic resolution.9,10 Due to the short T1 relaxation times at intermediate field strengths, both TSE and GRE sequences are acquired with a short TR of 250–350 ms to achieve high T1 contrast. TE should be as short as possible (10–15 ms for SE and TSE, 5–10 ms for GRE). At higher field strength, SE or TSE sequences are acquired with longer TRs (400–500 ms) because T1 relaxation times are longer. The number of signal averages should not exceed four, corresponding to a scan time of ca. 8 min. Again, TE should be as short as possible (10–15 ms). GRE sequences are not suitable for conventional free-breathing imaging with multiple signal averaging at high field strength because artifacts are accentuated. If non-breath-hold pulse sequences are acquired with a body phased-array coil, use of a fat suppression technique is recommended because the very bright subcutaneous fat near the coil would otherwise cause excessive motion artifacts. In-Phase and Opposed-Phase Imaging The GRE technique can be used to acquire images with in-phase (IP) and opposed-phase (OP) echo times to obtain supplementary information for tissue characterization. IP and OP TEs depend on the field strength (Table 1.3). The different effects result from the addition or subtraction of the signal contributions from water and fat (in general: lipids) within a volume element (Fig. 1.3). Fig. 1.1 Diagrammatic axial view of the upper abdomen showing motion artifacts due to respiration (1), cardiac pulsation (2), vessel pulsation (3), and bowel peristalsis (4) (according to Stark and coworkers10). The interface between tissues with different water or fat content typically appears dark on OP images (Fig. 1.4a, b). OP images enable sensitive detection of fatty infiltration and some lipid-containing tumors.11 Compared with IP images, fatty liver parenchyma has low signal intensity on OP images (Fig. 1.4c, d). Note that if images are acquired with a T1w GRE sequence, focal lesions in a fatty liver may be missed on OP images, and IP images are needed for reliable detection (Fig. 1.5). T2-Weighted Imaging T2w imaging techniques are largely the same at intermediate and high field strengths. The liver is nearly exclusively imaged with turbo or fast SE (TSE or FSE) pulse sequences, either for classic TSE imaging with the patient breathing freely or single-shot imaging during breath-holding (single-shot TSE, e. g., HASTE). The whole liver can be imaged in 2–4 min with the breathing technique or during a single breath-hold in ca. 23 s using the single-shot technique (Table 1.2). Note, however, that lesions with only slightly longer T2 relaxation times than the liver may be more difficult to detect on TSE images compared with standard T2w SE images, especially when they are small.12 Imaging is typically performed with TEs in the range of ca. 60–110 ms; longer TEs improve the differentiation of solid liver tumors from hemangiomas and cysts.13 Conventional TSE sequences can be performed as multiecho sequences with readout of several echoes, including very late echoes. Conventional TSE images can be acquired with a TR of 1600–2000 ms at low field strength, while a TR of at least 2500 ms is required at high field strength because of the longer T1 relaxation time. The fastest technique, echo-planar imaging (EPI), is demanding on hardware and software, but most MR systems in use today have echo-planar capability. EPI is basically a T2w technique and enables imaging of the liver in less than 5 s. Another fast sequence for T2w imaging is based on the steady-state principle during free precession (e. g., TrueFISP). This technique is employed for MRI of the heart and other rapidly moving organs but appears to be inferior to other fast techniques (e. g., HASTE) for T2w imaging of the liver.14 Because they improve liver–tumor contrast and overall image quality of T2w images, fat suppression techniques are more important for T2w imaging than T1w imaging. Different techniques of fat suppression are presented below. Fig. 1.2a–g MRI anatomy of the liver and comparison of different pulse sequences (1.5 T). a–c Images acquired with 2D T1w GRE sequence during breath-holding illustrate good visualization of anatomic detail and high T1 contrast (FLASH 199/4.1;90°; 23 slices in 21 s). Images through the liver at three different levels (from top to bottom) show the right, middle, and left hepatic veins (a, arrows), the right main portal branch (b), and the lower part of the right hepatic lobe (c) (see Fig. 1.7). d Fat-suppressed 3D T1w image (VIBE 4.9/2.4;10°; 32 acquired slices, interpolated to 64 slices; scan time, 22 s. e–g T2w images acquired with single-shot TSE sequence (HASTE ∞/80; 23 slices in 21 s), respiratory-triggered, fat-suppressed TSE sequence (TSE 5900/77; ETL, 21; 31 slices in ca. 5 min), and echo-planar sequence (EPI ∞/59; 31 slices in 5 s). Fig. 1.3 Diagram of opposed-phase (OP) and in-phase (IP) imaging. Because water and fat protons have slightly different precession frequencies, the amplitude of the echo in a GRE sequence is modulated (“beats”) in an environment consisting of a finely dispersed mixture of water and fat (as in hepatic steatosis). Under OP conditions, the signal contributions of water and fat are subtracted in a volume element, resulting in low SI (left). Under IP conditions, the signal contributions are added together, resulting in high SI (right). See Fig. 1.4. Motion Artifacts and Artifact Reduction Motion artifacts are a particular nuisance in liver imaging and must be effectively eliminated or at least reduced to obtain diagnostic images with good anatomic detail. In this section we therefore briefly outline the typical sources of motion artifacts that may degrade abdominal MR images and discuss the most important strategies currently available to control them. Artifacts in the upper abdomen can be caused by breathing (the liver moves up and down ca. 3–5 cm with respiration), blood flow and vessel pulsation, cardiac pulsation transmitted below the diaphragm, and gastrointestinal peristalsis (Fig. 1.1). Movement of anatomic structures during the image acquisition process causes blurring or ghosting in the phase-encoding direction regardless of the direction of motion. Ghosts—e. g., a faint duplicate image of the high-signal-intensity abdominal wall that may obscure structures of interest—are due to phase misregistration resulting from respiratory motion during spatial encoding by the magnetic field gradients. Pulsation artifacts—the repeated depiction of the cross-section of large vessels in the phase-encoding direction—result from blood flow in the imaging volume (Fig. 1.1). Fig. 1.4a–d OP and IP imaging with a T1 w GRE sequence at 1.5 T (TR, 199 ms; flip, 90°) in two patients without focal liver lesions, one with fatty liver (c, d) and one without (a, b). a, c OP images acquired with a TE of 2.4 ms. b, d IP images acquired with a TE of 4.8 ms. In the patient without fatty liver, only the OP image shows the characteristic dark lines, which occur at organ-fat and muscle-fat interfaces (a, arrows). In the patient with pronounced fatty liver, the liver parenchyma is homogeneous and very hypointense (dark) on the OP image (c). Both livers are of normal high SI on IP images (b, d).
M. Taupitz, P. Asbach, A.E. Mahfouz, and B. Hamm
Focal Liver Lesions
Introduction
Indications
Imaging Technique
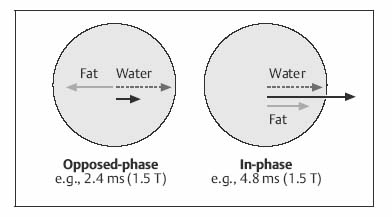
| IP | OP | |
| 0.5 T | Multiple of 14 | 7 (plus multiple of 14) |
| 1.0 T | Multiple of 6.6 | 3.3 (plus multiple of 6.6) |
| 1.5 T | Multiple of 4.4 | 2.2 (plus multiple of 4.4) |
A variety of hardware and software solutions exist for reducing motion artifacts in liver imaging. General and specific measures can be distinguished. Software-based solutions are now available ready for use on standard clinical MR scanners, but the radiologist needs to be familiar with them and their effects in order to choose the most appropriate strategy, which is why we give a brief outline here (see Fig. 1.2).
The simplest general measure to reduce motion artifacts is to increase the number of signal averages. The most important specific measures are presaturation techniques, breath-hold imaging, gradient moment nulling (also known as flow compensation), respiratory triggering or gating, phase-reordering methods (e. g., respiratory ordering of phase encoding—ROPE), and suppression of the signal from fat.
Presaturation is done by applying large presaturation bands to the vessels above and below the volume of interest so that spins entering the volume with the blood produce no signal. The blood appears black, and pulsation and inflow artifacts are eliminated. Inflow artifacts mainly interfere with T1w imaging, especially when fast GRE sequences are used after intravenous contrast administration, which is why presaturation pulses are most beneficial in this setting. Use of presaturation pulses may result in longer TRs and thus increase scan time.
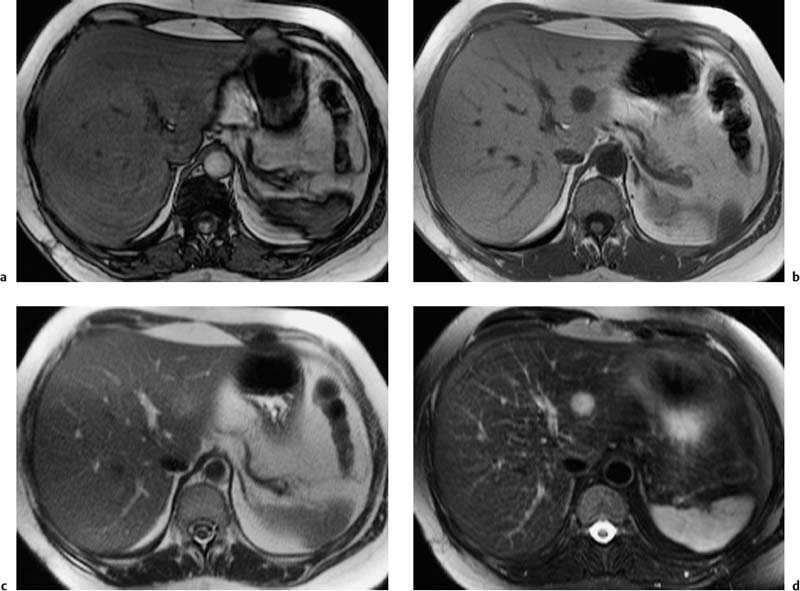
Fig. 1.5a–d OP and IP imaging with a T1 w GRE sequence at 1.5 T (TR, 199 ms; flip, 90 °) in a patient with hepatic steatosis and a focal liver lesion. a OP image (TE, 2.4 ms) fails to demonstrate the liver metastasis due to low SI of fatty liver. b IP image (TE, 4.8 ms) clearly reveals the metastasis. c Liver–tumor contrast is also low on the single-shot T2 w TSE image because TSE sequences with long echo trains and short echo spacing exaggerate the signal from fat-containing structures. d Good visualization of the metastasis on conventional, fat-suppressed T2 w TSE image.
Fast breath-hold sequences completely eliminate respiratory artifacts but do not eliminate artifacts due to transmitted cardiac pulsation, which may obscure the left lobe of the liver, or artifacts due to intestinal peristalsis. The latter can be eliminated by using ultrafast, sub-second imaging techniques (single-shot TSE, TurboFLASH, or TFE).
Gradient moment nulling, or flow compensation, corrects for signal loss and spatial misregistration due to motion, thereby also reducing ghost artifacts.15 However, the shortest possible TE is prolonged, which is why gradient moment nulling is primarily used in conjunction with T2w imaging. Note that blood in intrahepatic vessels may appear bright on T2w images acquired with flow compensation, and vessels depicted in cross-section may mimic small focal lesions.
Different techniques are available to reduce or eliminate the signal from fat. Spectral fat saturation uses a frequency-selective pulse to saturate the spectral peak of fat before imaging. Effective fat saturation relies on good separation of the spectral peaks of water and fat, which is achieved at high field strength (1.0–1.5 T ) and good magnetic field homogeneity. State-of-the-art scanners have automatic programs for individual patient shimming. These programs ensure maximum magnetic field homogeneity for uniform elimination of fat signal over a large volume when a fat saturation sequence is employed. A second method is short tau inversion recovery (STIR), in which the time of inversion (TI), i. e., the time between application of the 180° inversion pulse and the start of the imaging sequence, is chosen such that the longitudinal magnetization of fat is at zero and no signal is obtained from fat. The inversion delay to null the fat signal is 100–170 ms. STIR sequences are far less susceptible to magnetic field inhomogeneities and can be used at all field strengths. STIR increases scan time but this draw-back can be compensated for, to some extent, by combining it with TSE or FSE sequences (so-called turbo inversion recovery sequence, TIR). Spectral presaturation with inversion recovery (SPIR) is an inversion recovery technique that combines elements of fat saturation and STIR. Effective fat suppression is absolutely essential to eliminate motion artifacts when free-breathing T2w imaging is performed using a body phased-array coil (Fig. 1.6a, b).
Respiratory triggering is almost exclusively used for T2w imaging. It requires special equipment and a pulse sequence that allows selective data acquisition at a specific phase of the respiratory cycle, typically the phase of least motion after expiration. With respiratory triggering, the examination will take at least twice as long. Several techniques are available to monitor respiratory motion. Typically, a belt with an extension sensor is placed around the patient’s abdomen, or a cushion with an integrated pressure sensor is positioned between the abdominal wall and the anterior element of a body phased-array coil. Another efficient and easy-to-handle tool is the navigator echo technique for monitoring diaphragmatic motion, which is known from cardiac imaging.16,17 If adequate elimination of motion artifacts and blurring is achieved with respiratory triggering, the basic matrix resolution can be increased, for instance to 320. With additional administration of a spasmolytic agent, images with high detail resolution of both intrahepatic and extrahepatic structures are obtained (Fig. 1.6c, d). Phase-ordering techniques (e. g., ROPE) improve image quality without a penalty in scan time. With this technique, the data that are most critical for creation of the MR image are acquired during the phase of least respiratory motion.
Administration of an antispasmodic agent is usually not necessary to reduce gastrointestinal motion artifacts in liver MRI, especially when fast imaging techniques are used. However, an antispasmodic will improve image quality, particularly in conjunction with respiratory-triggered sequences.
Contrast Media
Contrast-enhanced MRI of the liver can be performed with nonspecific contrast media or one of several tissue-specific agents that have become available more recently. The MR contrast media for liver imaging after intravenous injection belong to different classes with different properties and effects on MR signal intensities (alteration of relaxation times, organ distribution, pharmacokinetics). Radiologists need to be familiar with these to choose the most appropriate imaging protocols and make optimal use of their benefits. Contrast media development is a very dynamic field, with frequent approval of new agents or new indications for existing agents and the withdrawal of agents from the market. Before administering any intravenous contrast medium, radiologists should always check the most up-to-date information regarding approval status in their own country.
Nonspecific Contrast Media
Nonspecific MR contrast media for intravenous injection that have been in clinical use for some time are Magnevist (Gd-DTPA) and Dotarem (Gd-DOTA). More recently, several so-called nonionic, low-osmolar contrast media have become available, including Omniscan (gadodiamide, Gd-DTPA-BMA), Prohance (gadoteridol, Gd-HP-DO3A), and Optimark (gadoversetamide). Gadovist (gadobutrol) has become available recently and is the only Gd-based contrast agent with a concentration of 1.0 mmol/mL Gd (twice that of the other Gd compounds). Like iodine-based X-ray contrast media used for liver CT, nonspecific Gd chelates are rapidly distributed in the extracellular space and are excreted by the kidneys. They act mainly by markedly shortening T1 relaxation times, which is best appreciated on heavily T1-weighted sequences.
Nonspecific Gd-based MR contrast media are typically used for rapid, dynamic image acquisition after intravenous bolus injection (Table 1.1 ). The total amount of contrast medium to be injected is ca. 10–20 mL when the standard dose of 0.1 mmol/kg body weight Gd is used. Such a small amount of contrast medium is advantageous for all applications requiring a bolus technique.
Tissue-Specific Contrast Media
Two types of tissue-specific MR contrast media are used for liver imaging: superparamagnetic iron oxide particles (SPIO particles, magnetites; e.g., Endorem, Sinerem, Resovist), which predominantly accumulate in the liver and spleen, and paramagnetic low-molecular-weight compounds, which specifically target the hepatocytes. The latter include Teslascan (Mn-DPDP), Multihance (Gd-BOPTA), and Primovist (Gd-EOB-DTPA). All of these contrast media are in clinical use, except for Sinerem, which is in the clinical trial phase and for which approval is sought only for intravenous administration in MR lymphography.
Magnetites are very small particles that, after intravenous injection, are selectively taken up by cells of the mononuclear phagocyte system (MPS), in particular Kupffer cells in the liver and macrophages in the spleen. The particles cause marked signal loss in these tissues by shortening their T2 relaxation times,18,19 thereby enhancing contrast between normal liver parenchyma and non-hepatocellular lesions, whose signal intensity remains unchanged because they lack MPS cells.20,21 Only very small amounts of magnetites, typically between 8 and 15 μmol/kg body weight Fe, are needed to achieve the desired effects, which persist for several hours to days and are most conspicuous on moderately T2-weighted pulse sequences, i. e., sequences with a long TR and a not too long TE (< ca. 80 ms). In addition to their T2-shortening effects, SPIO particles also shorten T1 relaxation time while moving freely in blood or interstitial fluid.19 The resulting increase in signal intensity of blood and tissues with a large blood volume is made visible on T1w images acquired with very short TE. This signal-enhancing effect is especially pronounced for ultra-small SPIO particles (USPIO) such as Sinerem (see lymph node imaging, Chapter 16). With their long blood half-life, USPIO particles might be suitable as blood pool agents and cause prolonged signal changes in highly vascularized tumors (not approved for clinical use).22
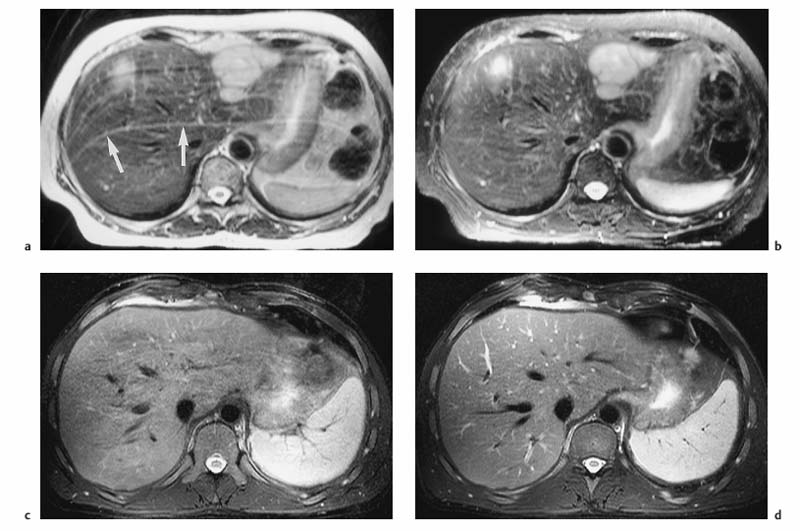
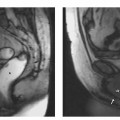
Fig. 1.6a–d Techniques for reducing motion artifacts on images acquired with a free-breathing T2w sequence. a, b Role of fat suppression in combination with a body phased-array coil (1.5 T). T2w images without (a) and with (b) fat suppression. Pronounced motion artifacts over the liver in a (arrows) due to signal accentuation near the coil; these artifacts are markedly reduced by fat suppression. c, d Effect of respiratory triggering (1.5 T). Fat-suppressed T2w TSE images acquired without (c) and with (d) respiratory triggering (navigator technique). Respiratory triggering markedly improves image quality and detail resolution (d vs c).
Hepatocellular MR contrast media are low-molecular-weight compounds that accumulate in liver cells and increase the signal intensity of normal liver parenchyma by shortening T1. The signal increase persists for up to 2 h or longer after intravenous injection. Hepatic lesions that do not take up the contrast medium have unchanged signal intensity and are thus rendered more conspicuous.23–25 However, the effect depends on hepatobiliary elimination, which is not the same for all contrast media of this class. For Multihance, hepatobiliary elimination is low and therefore its signal-enhancing effect in the liver is only moderate, while Teslascan and Primovist, with ca. 50 % hepatic elimination, cause a strong selective signal increase in healthy liver tissue. The recommended doses per kg body weight are 0.01 mmol Gd for Teslascan, 0.1 mmol Gd for Multihance, and 0.025 mmol Gd for Primovist.
Not all tissue-specific MR contrast media can be given by intravenous bolus injection. Resovist is the only approved SPIO contrast medium that can be injected in bolus form; Endorem must be given as a slow infusion. Among the hepatobiliary contrast media, Primovist and Multihance can be administered in intravenous bolus form while Teslascan is infused. The contrast media that can be given as a bolus enable dynamic postcontrast MR studies in addition to the acquisition of static images at different phases following contrast administration.
MRI Protocols
Unenhanced MRI
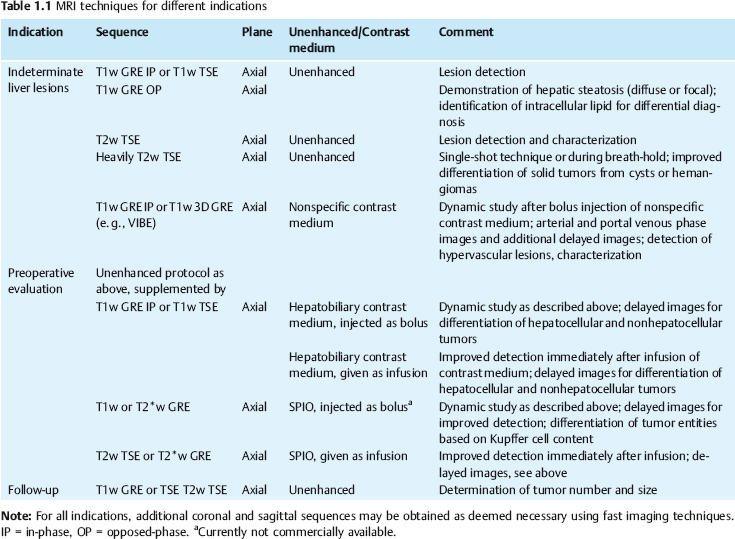
The MR pulse sequences recommended for unenhanced MR assessment of focal liver lesions are listed in Tables 1.1 and 1.2.
Dynamic MRI
A dynamic contrast-enhanced MRI study of the liver can be done with nonspecific contrast media or those hepatobiliary agents that can be given as an intravenous bolus. Multiphasic imaging is performed using a T1w multislice IP GRE sequence or a fat-suppressed 3D GRE sequence. To capture the dual contrast inflow via the hepatic artery and portal vein (Fig. 1.7), the first acquisition begins 15 s after the start of bolus injection of the contrast medium into a peripheral vein (arterial phase) and the second acquisition at 55–60 s (portal venous phase). Delayed images (equilibrium phase) can be acquired at 2.5 min and 10 min. Determination of individual circulation time is not necessary. An MR-compatible power injector is useful for contrast injection but not a prerequisite for the success of a dynamic MR study. The contrast bolus should be followed by a 20-mL saline flush. Arterial and portal venous phase MRI is similar to biphasic spiral CT in terms of timing and image interpretation. When dynamic liver MRI is performed with Resovist, the signal-enhancing effect during the blood pool phase can be exploited by obtaining a T1w series as with use of nonspecific Gd-based contrast medium. Alternatively, a T2*w GRE sequence can be used, which will show a temporary signal loss in highly vascularized tissues.
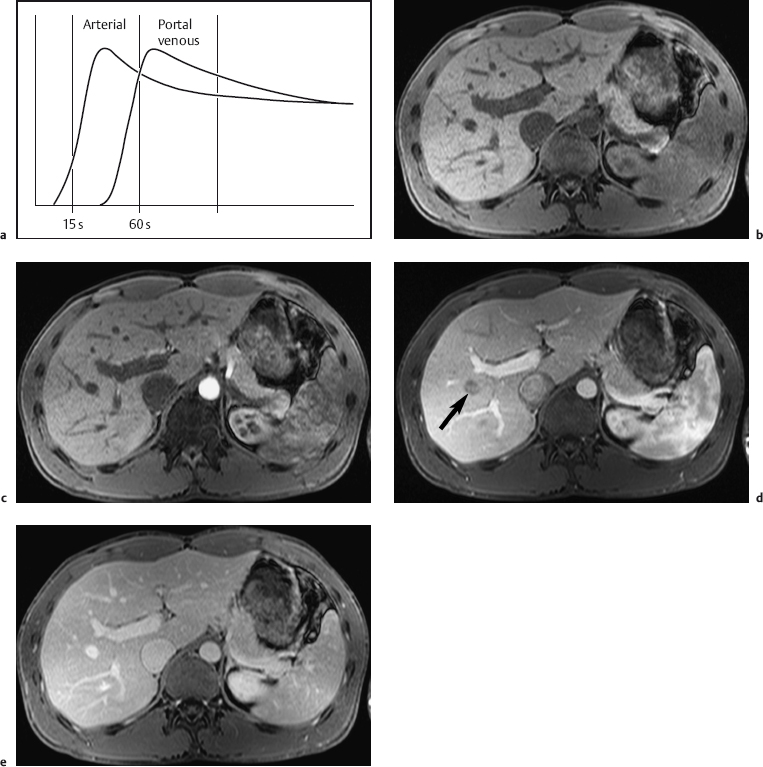
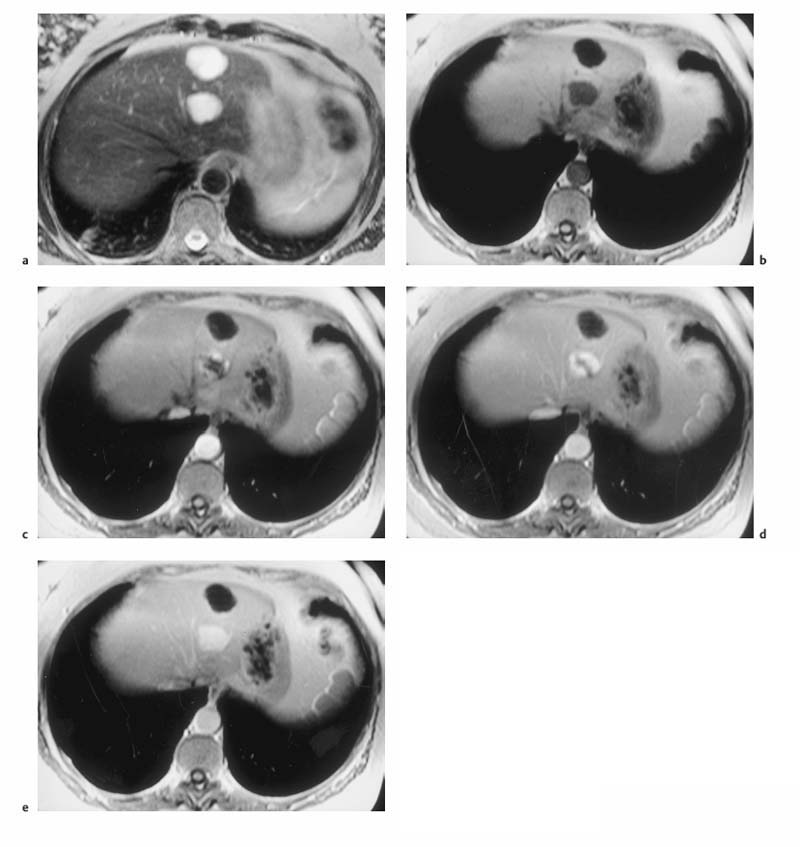
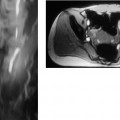
Fig. 1.7a–e a Diagrammatic representation of the temporal course of contrast inflow into the liver via the hepatic artery (arterial phase) and portal vein (portal venous phase). b–e Dynamic MR study performed with a T1w volumetric 3D GRE sequence (VIBE) and nonspecific Gd-based contrast medium: precontrast image (b); arterial phase image shows enhancement only of the arteries (c); portal venous phase image shows enhancement of the portal vein and its branches and beginning enhancement of liver parenchyma, but no contrast in the liver veins (d, arrow); parenchymal phase image shows enhancement of all intrahepatic vessels and liver parenchyma (e) (same patient as in Fig. 1.2).
Static MRI Using Tissue-Specific Contrast Media
The relaxivity-altering effects of specific MR contrast media are best depicted on postcontrast images acquired with heavily T1-weighted sequences in conjunction with hepatobiliary contrast media and with moderately T2w sequences after administration of an SPIO contrast agent.
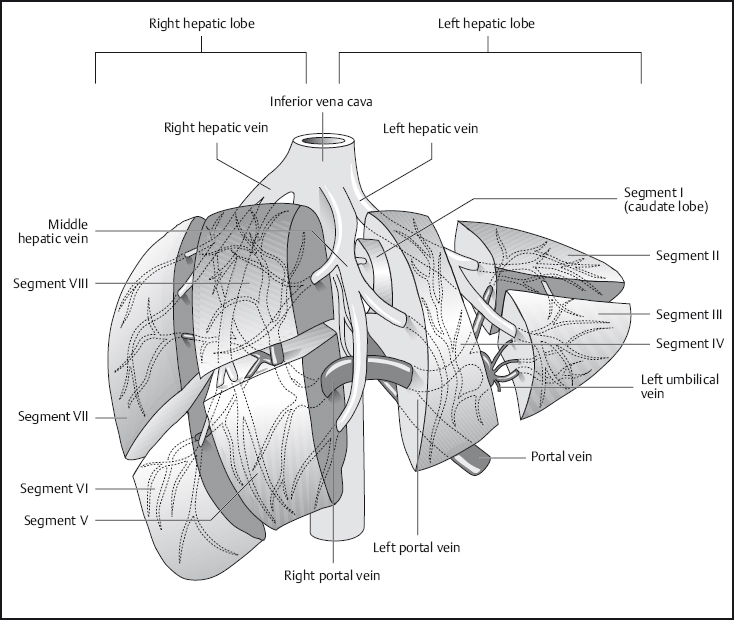
Fig. 1.8 Segmental anatomy of the liver.
If a hepatobiliary contrast medium is used to differentiate hepatocellular tumors (focal nodular hyperplasia, well-differentiated hepatocellular carcinoma), additional delayed images should be obtained no earlier than 2 h after contrast injection.
MRI Appearance of Normal Anatomy
The normal liver is of uniform signal intensity, which is higher than that of the spleen on T1w images and lower on T2w images. Hepatic vessels appear dark on T1w images due to flow-related signal loss (see Fig. 1.2). They are also dark on T2w images unless gradient moment nulling (flow compensation) is used, in which case intrahepatic vessels are bright. The branches of the portal vein and intrahepatic veins serve to identify the liver segments (Fig. 1.8). Differentiation of the liver from other structures in the upper abdomen is usually straightforward.
MRI Appearance of Pathologic Entities
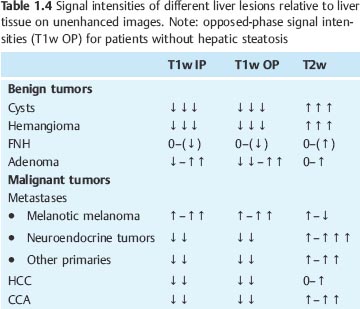
Most benign and malignant liver tumors are hypointense on T1w images and hyperintense on T2w images. Cysts, hemangiomas, and metastases from neuroendocrine tumors are visualized with high contrast, as are intratumoral necrosis and abscesses. The vast majority of other liver metastases and cholangiocarcinoma (CCA) are less conspicuous on both T1w and T2w images. Liver tumors that are isointense or nearly isointense to normal liver parenchyma are focal nodular hyperplasia (FNH) as well as an occasional adenoma or hepatocellular carcinoma (HCC) (Table 1.4). T1w sequences contribute little to lesion characterization, except for cysts, which are clearly identified as sharply demarcated lesions of very low signal intensity on T1w images. In all other cases, characterization of focal liver lesions is primarily based on T2w sequences, which enable good evaluation of tumor margins and internal structures. Use of different T2 weightings, including images generated from late echoes, allows further characterization and improves accuracy in differentiating cysts and hemangiomas from solid liver tumors. Intralesional hemorrhage and fatty components as well as melanotic liver metastases from malignant melanoma exhibit atypical signal behavior with hyperintensity on both T1w and T2w images. Additional information for characterizing focal liver lesions is provided by dynamic contrast-enhanced MRI, which enables the important differentiation of hypervascular and hypovascular lesions and reveals some typical enhancement patterns such as the progressive centripetal enhancement characteristic of liver hemangioma (Table 1.5 ).
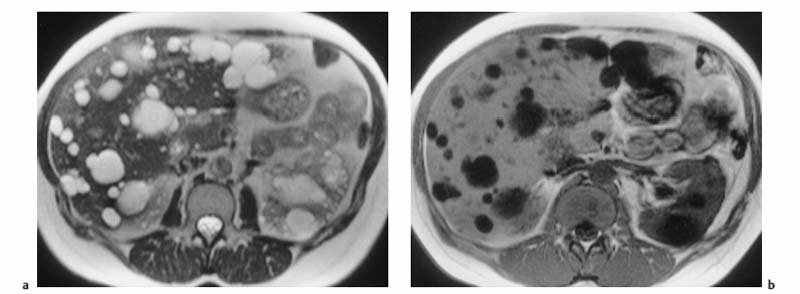
Fig. 1.9a, b Multiple liver cysts in a patient with autosomal dominant polycystic kidney disease (1.5 T). a Single-shot T2w TSE image. b T1w GRE image. Both images were acquired during breath-hold. The liver cysts are depicted as homogeneous lesions of very high SI on the T2w image and very low SI on the T1w image. Also seen are multiple cysts in both kidneys.
| Benign liver tumors |
| FNH |
| Adenoma |
| Malignant liver tumors |
| HCC |
| Metastases |
| • Renal cell carcinoma |
| • Breast cancer (may also be hypovascular) |
| • Neuroendocrine tumors (e. g., carcinoid, insulinoma) |
| • Melanoma |
| • Sarcoma |
Below we describe the MR appearance of the most important benign and malignant focal liver lesions on unenhanced images and dynamic contrast-enhanced imaging with nonspecific Gd-based contrast media. A separate section illustrates the use of tissue-specific MR contrast media for selected tumor entities.
Benign Focal Liver Lesions
Cyst
Because they contain water, cysts have long T1 and T2 relaxation times, resulting in very low signal intensity on T1w images and uniform high signal intensity on T2w images. A liver cyst is usually sharply demarcated from the surrounding tissue but may appear blurred due to partial volume effects if the plane of section is tangential to it (Fig. 1.9). In cases where cysts and hemangiomas cannot be differentiated because of similar T2 signal intensities, a T1w sequence or dynamic imaging will help distinguish the two (Fig. 1.10).
MRI clearly differentiates the cyst fluid from the solid wall and septa in echinoccocal cysts, while the characteristic curvilinear calcifications (eggshell calcifications) are far better revealed with CT.
Hemangioma
Hemangiomas are the most common benign hepatic tumors. They are incidentally detected in ca. 5 % of patients undergoing abdominal imaging for other reasons. Hemangiomas are mesenchymal tumors characterized by densely packed, dilated vessels with an endothelial lining. Regressive changes such as scars and central hyalinization may be present in large hemangiomas. Although they have no malignant potential, hemangiomas may pose a diagnostic challenge because they must be differentiated from liver metastases. This is especially important in patients with multiple hemangiomas (up to 35 % of cases).
Hemangiomas are well-circumscribed masses of uniform signal intensity on T1w and T2w images and may occasionally be lobular. They are moderately hypointense on T1w images and clearly distinct from cysts, which have very low T1 signal intensity, while distinguishing them from other solid liver tumors is more difficult. On T2w images, on the other hand, hemangiomas are of high signal intensity and therefore at times resemble cysts (Fig. 1.10). Hemangiomas have long T2 values (> 80 ms), which are due to slow-flowing blood and correlate with the collective size of their constituent vascular spaces, but not with overall tumor size.26 Central thrombosis or hyalinization is occasionally seen, especially in large hemangiomas (Fig. 1.11). Various quantitative approaches have been proposed to improve the differentiation of hemangiomas and malignant tumors, including calculation of T2 relaxation time or contrast-to-noise ratio (CNR). However, none of the quantitative methods appears to be superior to visual interpretation of T2w images, taking into account the morphologic features just outlined. A combination of moderately and heavily T2-weighted sequences has been recommended to increase diagnostic confidence in diagnosing hemangioma,27,28 for instance a moderately T2w TSE sequence and a single-shot TSE sequence, which has inherently stronger T2 weighting. On heavily T2-weighted images, hemangiomas should be of high signal intensity similar to that of cerebrospinal fluid (CSF) or fluid in the gallbladder or stomach. MRI has an accuracy of > 90 % in characterizing hemangioma.13,27 Nevertheless, there are still cases where accurate characterization poses a challenge, e. g., when confronted with an atypical hemangioma with reduced signal intensity and an inhomogeneous appearance due to degenerative changes, or in patients in whom hemangiomas may be confused with hepatic metastases from neuroendocrine tumors, which also have very long T2 relaxation times.29
Related posts:

Stay updated, free articles. Join our Telegram channel

Full access? Get Clinical Tree


