15 Magnetic Resonance Angiography of the Abdomen
R. Vosshenrich and P. Reimer
Introduction
MRI has been used for evaluation of blood vessels since the 1980s. At that time, vascular MRI was performed without contrast media using techniques such as black blood angiography, time-of-flight (TOF) MRI, or phase-contrast imaging. Acquisition with any of these techniques took several minutes, and the best results were achieved when vessels with directed flow were imaged against a stationary background. A full scan of the abdominal vessels during breath-holding was unthinkable. Even longer scan times resulted when electrocardiographic triggering was used to synchronize image acquisition with the patient’s cardiac cycle. Therefore, imaging of the abdominal vessels using conventional MR techniques could only be done by way of triggered acquisition of single slices with fast pulse sequences and was hampered by variable signal intensities and loss of signal due to dephasing. The long examination times resulting from the small field of view and poor spatial resolution limited the clinical utility of these techniques.
Technical advances and the introduction of intravenous paramagnetic contrast media have since expanded the clinical utility of magnetic resonance angiography (MRA) dramatically. Prince et al. reported the first contrast-enhanced MRA of the abdominal vessels in 1993.1 Today, contrast-enhanced MRA with acquisition of 3D datasets during a single breath-hold is indispensable in the pre-operative evaluation of different vascular regions and follow-up after surgical or interventional treatment.
Indications
With the development of contrast-enhanced techniques, MRA has evolved into a clinically relevant imaging modality for the abdominal vessels. Contrast-enhanced 3D MRA has become the primary imaging modality in patients with different conditions involving the major abdominal arteries and veins and is also increasingly being used to evaluate smaller vessels.
Patients with acute dissecting or perforating aortic aneurysm are initially examined by multislice spiral computed tomography (MSCT) because it is more widely available and faster and also allows better monitoring of vital functions; in these patients, MRA is useful for treatment planning and follow-up. It enables exact evaluation of the main branches of the celiac trunk and superior mesenteric artery, whereas optimal visualization of the inferior mesenteric artery is not achieved in all patients. The combination of contrast-enhanced 3D MRA with MR urography and nephrography has the potential to replace several conventional diagnostic tests in kidney disease and may turn MRI into a “one-stop shop” modality for these patients. Contrast-enhanced 3D MRA is well established for imaging of the portal venous system before liver transplant and in portal hypertension or as part of the preoperative diagnostic work-up of abdominal tumors. In the follow-up of patients with portal hypertension, contrast-enhanced MRA should be combined with a non-enhanced pulse sequence for quantifying blood flow. The abdominal veins can be reliably evaluated with both un-enhanced and contrast-enhanced MRA techniques.
Imaging Technique
The creation of an MR image relies on several properties that are unique to individual tissues, in particular T1 and T2 relaxation times and proton density. Another important phenomenon is proton motion. The susceptibility of MRI to motion causes flow artifacts and may degrade image quality. In MRA, flow-related effects are deliberately exploited to image moving spins. The two basic phenomena that are relevant here are flow-related signal enhancement (inflow effects) and flow-related signal loss (phase shifts). The MR techniques that make use of such flow effects are collectively known as un-enhanced MRA and do so by specifically enhancing one effect while maximally suppressing the others.
Time-of-Flight MRA
Time-of-flight (TOF) or inflow techniques are based on the motion of spins with a longitudinal magnetization component. Characteristically, the magnetization of flowing blood is manipulated at one site and sampled at another. In contrast, stationary spins within the imaging slice are subjected to many high-frequency pulses and thus become highly saturated when using a pulse sequence with a short repetition time (TR) compared with the T1 relaxation time of blood. Saturated spins are relatively insensitive to the excitation pulse and therefore yield little signal. In a vessel with blood flow perpendicular to the excited slice, the excited spins are constantly being replaced by fully relaxed inflowing spins, which give a high signal (bright blood imaging). As a result, contrast between stationary tissue and flowing blood is high.2 To make use of the inflow technique in a clinical setting, phase shifts, which occur simultaneously in the body and contribute to signal loss, have to be minimized. This is accomplished by using flow compensation (gradient moment rephasing, GMR) or a short echo time.3 Shorter TEs reduce the time in which spins can build up phase shifts. A TOF angiogram can be generated from 2D single slices, or from multiple small 3D slabs or one large one.
Phase-Contrast MRA
The second non-contrast-enhanced MRA technique is based on the fact that excited spins, i. e., spins that have undergone transverse magnetization, experience a phase shift when moving along a gradient (phase contrast, PC). To illustrate the phase shift, let us assume that we apply a bipolar gradient pulse. Every time a gradient pulse is applied, this imparts a shift in the Larmor frequency at which spins precess. Following application of the pulse, the magnetization of the spins points in a different direction; in other words, the spins have undergone a change in phase. The amount of the phase shift depends on the gradient strength and the spin position. If after some time, we apply a second pulse of opposite polarity, the initial phase shift is reversed as long as the spins have not changed their position. Under ideal conditions, stationary spins will therefore have exactly the same magnetization as before application of the bipolar gradient.
In contrast, the phase shift imparted to moving spins is not compensated for, precisely because the spins are no longer in the same position when the second pulse is applied. Thus, application of a bipolar gradient results in a net phase accumulation for moving spins. As the phase shift is greater for faster-flowing protons, PC MRA is an inherently quantitative method and can be used to calculate blood flow velocity.4
Contrast-Enhanced MRA
Two major technical innovations have made possible the development of fast contrast-enhanced 3D MRA: high-performance gradient systems and dedicated phased-array surface coils. The resulting high-gradient amplitudes with short rise times enable acquisition of complex 3D datasets with ultrashort TRs and TEs during a single breath-hold. In conjunction with large flip angles, very short TRs also effectively suppress background signal. Use of paramagnetic contrast media, which shorten T1 relaxation time, ensures excellent delineation of vascular structures from surrounding tissue. Finally, ultrashort TEs minimize signal dephasing, thereby enabling more accurate evaluation of stenosis. Phased-array surface coils improve MRA by combining greater anatomic coverage with high signal-to-noise ratio (SNR).
Contrast Media
Contrast-enhanced 3D MRA of the abdominal and pelvic vessels is performed using paramagnetic Gd chelates. Paramagnetic contrast media shorten the T1 relaxation times of the tissues into which they are taken up. Following intravenous bolus administration, a paramagnetic substance reduces T1 to <50 ms during arterial passage (first pass). MR contrast media are characterized by a low rate of adverse effects,5 which is 2–3 times less than that of conventional X-ray contrast agents. Most MR contrast media on the market are approved only for specific applications or organ systems. The most comprehensive approval exists for the low-molecular-weight Gd chelate Magnevist (Bayer Schering Pharma) and also encompasses its use for MRA. Preparations specifically approved for MRA are Gd-DOTA (Dotarem, Guerbet), gadodiamide (Omniscan, General Electric), Gd-BOPTA (MultiHance, Bracco), and the 1 mol/L formulation of gadobutrol (Gadovist, Bayer Schering Pharma). Administration of other contrast media for MRA is considered an off-label use, placing the ultimate responsibility on the radiologist.6
Extracellular MR contrast media are chelates of Gd. The most important member of this class is Gd-DTPA, a metal–chelate complex of the rare earth element Gd and diethylenetriamine penta-acetic acid as chelating agent.7 The commercially available preparation of Gd-DTPA is a meglumine salt in aqueous solution at a concentration of 500 mmol/L. Following intravenous administration, the substance distributes in the intravascular space and then rapidly extravasates into the extracellular space. After an early peak, the plasma concentration drops by 70% during the first 5 min of injection. Only in the brain do Gd-based contrast media have prolonged selective intravascular re-laxivity because the blood–brain barrier prevents extravasation. The substance is excreted renally via glomerular filtration.7
Gd3+ ions have high magnetic moment and interact with protons, thereby considerably altering the local magnetic field. While relaxation rates, 1/T1 and 1/T2, increase in proportion to the Gd-DTPA concentration, signal intensity does not. T1-shortening predominates at lower concentrations, and signal intensity increases. In this way, the T1 relaxation time of blood is temporarily shortened from ca. 1000 ms to 30–100 ms. At high concentrations, T2-shortening predominates, and signal intensity decreases.8
Another group of contrast media is low-molecular-weight Gd chelates with weak protein binding. Although weak, protein binding results in a prolonged and pronounced effect on intravascular signal intensity. These substances are eliminated in urine and bile.9 This group comprises two contrast agents approved for liver MRI: Gd-BOPTA (Multihance, Bracco-Byk Gulden) and Gd-EOB-DTPA (Eovist, Bayer Schering Pharma).
Of note are higher-concentration formulations of Gd chelates. Such formulations can be given as a more compact contrast bolus because only half the volume is needed and they offer advantages for perfusion imaging. The first Gd-based contrast medium marketed in a 1.0 mol/L concentration was gadobutrol (Gadovist, Bayer Schering Pharma).10
Another important class of contrast media is blood pool agents, currently in the clinical trial phase. These have longer intravascular residence times with little or no extravasation compared with the nonspecific Gd-based agents. This group comprises very small superparamagnetic iron oxide particles with increased T1 relaxivity as well as macromolecular and low-molecular-weight Gd-based agents, which are retained in the vasculature after intravenous injection because of strong plasma protein binding. The first preparation specifically approved for MRA was gadofosveset (Vasovist, Bayer Schering Pharma). Experimental and clinical data show that the excellent quality of contrast-enhanced 3D MRI during first pass of nonspecific Gd-based contrast media is very hard to surpass using blood pool contrast agents. Although the ultimate role of blood pool contrast media in MRA is still open, it has been suggested that the prolonged and strong enhancement of blood may cause problems because venous enhancement may interfere with evaluation of arteries.11 This problem may be overcome by the use of high-spatial-resolution steady-state MRA.12
k-Space and Timing of Contrast-Enhanced MRA
In an MRI experiment, the echo measured represents signal from the entire volume excited. To create an MR image, it is necessary to analyze the frequency information in a space-resolved manner. Spatial encoding is accomplished by means of a gradient field, which is weaker than the main magnetic field and is applied during readout to impart a linear increase in field strength along the gradient.13 As a result, the Larmor frequency at which protons precess increases along the axis of the gradient, e. g., the z-axis, in a space-dependent manner. In this way, only protons at a specific location can be excited and contribute to the final echo, which is why this gradient is also known as the slice-select gradient. To localize a point within the selected slice, a second gradient is applied along the y-axis. This gradient remains constant for each echo. In this way, a higher frequency is imparted to all nuclei along a line of the y-axis, and these points all have the same phase after the high-frequency pulse is switched off (phase-encoding gradient). Subsequently, a third gradient field is applied along the x-axis at the time the echo is collected (readout gradient). Thus, all nuclei in the x-axis rotate faster. As a consequence, any one point within a given xy-plane has a unique phase and a frequency that depends on its location. In this way, each point in an excited volume is defined and can be localized in space.
The plane defined by the x- and y-axis is known as the Fourier space or k-space, which is a raw data matrix that is converted into the image matrix using a Fourier transform. In a pulse sequence with linear phase encoding, the high and intermediate frequencies are sampled first, starting at the anterior edge of k-space (0 %). Toward the center of k-space, the low frequencies are sampled; after 50 % has been sampled, frequencies increase again toward the posterior edge of k-space (100%). The higher frequencies determine detail resolution, while the lower frequencies define coarse structures and thus image contrast.
Proper timing of image acquisition is critical for contrast-enhanced 3D MRA. To achieve optimal contrast, the central lines of k-space, which contribute most to image contrast, must be sampled at the time of peak enhancement of the target vessel. If the phase of optimal enhancement is missed, only the higher frequencies (peripheral k-space lines) contribute to image generation. Such an image has high spatial resolution but very poor contrast. In addition, premature acquisition may result in ringing artifacts. If acquisition starts too late after contrast injection, arterial evaluation may be impaired by undesired enhancement of tissues and/or veins. The time between contrast injection and initiation of data acquisition is the scan delay and varies with the patient’s circulation time. Individual determination of the scan delay is crucial to achieving optimal results.14
Individual circulation time is usually determined by intravenous injection of a test bolus of 1 mL of Gd-based contrast medium. Alternatively, automatic triggering techniques can be used.15,16 The use of MR-compatible automatic injectors ensures injection of defined amounts of contrast medium at defined rates for optimal homogeneous enhancement of the target vessel.17 The recommended injection rate is 1-5 mL/s.18 The usual clinical dose of Gd-DTPA is 0.1 mmol/kgbody weight, and the total dose should not exceed 0.3 mmol/kg.19–21
Pulse Sequences
MRA is performed using fast 3D gradient echo (GRE) sequences with short TR (< 5 ms) and TE (< 2 ms) together with relatively large flip angles of 30–60°. The field of view (FOV) is 360–450 mm with a matrix of 512 in the frequency-encoding direction and 126–256 in the phase-encoding direction. The volume slab thickness ranges from 60 to 120 mm, depending on the target anatomy. Images should be acquired with an effective slice thickness of less than 1.5 mm. A short scan time of < 20 s is desirable to enable image data acquisition during a single breath-hold (Table 15.1). Selective fat saturation pulses are helpful to eliminate interfering background signal,22,23 but acquisition will take 3–5 s longer. In general, one dataset is acquired after contrast injection. A biphasic protocol is recommended for MRA of the hepatic arteries and portal vein.14,24 Image subtraction can be used before other postprocessing techniques are applied to the MRA data.
| Repetition time | <5ms |
| Echo time | <2ms |
| Flip angle | 30–60° |
| FOV in readout direction | 320–450 |
| FOV in phase-encoding direction | 65–75% |
| Slice thickness | <1.5 mm |
| Volume slab thickness | 60–120 mm |
| Volume slab orientation | Coronal/oblique coronal |
| Matrix resolution (frequency) | 512 |
| Matrix resolution (phase) | 40–75% |
| Fat suppression | Yes |
| Scan time | <20 s |
| Other | Breath-hold imaging |
Parallel imaging techniques (marketed as ASSET, General Electric; SENSE, Philips; iPAT, Siemens; Speeder, Toshiba) have several advantages over conventional MRI pulse sequences. They can be used to improve spatial resolution in the same scan time or to reduce scan time while retaining resolution. In combination with phased-array multi-coils and special reconstruction algorithms, parallel imaging techniques improve image quality by reducing distortion and blurring.
Postprocessing Techniques
Various reconstruction techniques are available to analyze and display MRA data, the most common ones being multiplanar reconstruction (MPR), maximum intensity projection (MIP), and different surface rendering techniques (e. g., shaded surface display, SSD).
MPR is routinely used for interpreting MRA data because it is fast and straightforward and allows rapid assessment in any plane, which need not be aligned with the three axes of the volume slab. MPR images can be created using the software available on most MR scanners, without the need for a dedicated console. However, the reconstructed images may occasionally mimic pathology, which is why the radiologist should always re-examine the source images for confirmation of a suspected pathology.22,25
MIP is the most widely used postprocessing algorithm for MRA datasets. A MIP image represents the highest signal intensity voxel within each projection ray through a volume of data. These voxels are identified by means of a user-defined signal intensity threshold, below which all voxels are discarded. The retained high-intensity voxels are projected into a 2D plane. MIP algorithms have intrinsic shortcomings. Low-signal-intensity voxels (e. g., vessel edges or small-caliber vessels with slow blood flow) may be eliminated if an overlying structure has higher signal intensity, resulting in underestimation of vascular diameter and overestimation of stenosis. Vessel diameter and the degree of stenosis should therefore always be estimated from the source images.26
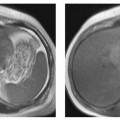
Surface rendering is another technique for displaying vascular structures. For this, the outer or inner surface of the vessel needs to be labeled in the dataset in a binary fashion to be recognizable by the visualization system. Threshold-based techniques are simple algorithms for segmenting vessels from background. A 3D impression is created by illuminating the object displayed with a virtual light source. Again, depending on the threshold selected, the resulting images may mimic or obscure pathology.27 Surface renderings are useful for displaying complex vascular anatomy and separating structures overlying each other,28 but they have little diagnostic value compared with other postprocessing techniques (Fig. 15.1).
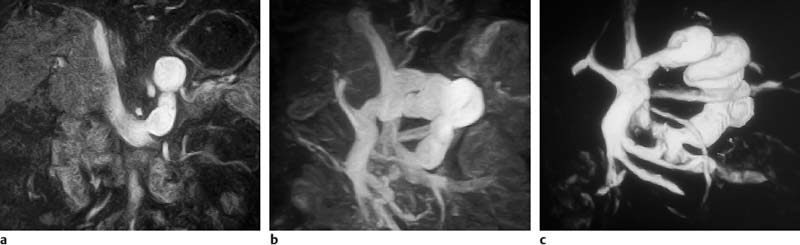
Fig.15.1a–c Contrast-enhanced MRA of a spontaneous splenorenal shunt. Illustration of different postprocessing techniques: MPR (a), MIP (b), surface rendering (c).
Selection of a suitable coil concept is critical for optimal contrast-enhanced 3D abdominal MRA covering the entire vascular tree from the proximal abdominal aorta to the pelvic arteries (ca. 60 cm in the z-direction) while at the same time ensuring adequate evaluation of the small hepatic and renal arteries. Conventional coils with a large FOV (e. g., whole-body coil) have a poor SNR, whereas a small coil such as a head coil has limited anatomic coverage.
Phased-array surface coil systems combine increased anatomic coverage (up to 48 cm along the z-axis) with high SNR.29 A phased array system consists of multiple independent surface coils (receive coils), each with its own amplifier and channel. The individual coil elements are simultaneously switched for echo sampling with each element generating an image with a small FOV. The re-sulting images are then combined to form a composite image (array image). The good SNR of phased-array coils compared with the whole-body coil or conventional surface coils is attributable to the fact that image noise is limited to the small FOV of each individual coil element. Multielement arrays of four or more coils are now available for MRA of abdominal vessels.
Phased-array multicoils should provide maximum flexibility by allowing the radiologist to tailor the number of coil elements used to the individual situation. Moreover, it should be possible to use the abdominal array in combination with other phased-array systems to image the entire vascular tree comprising the abdominal, pelvic, and leg arteries if necessary.30 It is also desirable to combine individual coils of different array systems with each other. Powerful state-of-the-art MR imagers enable the combination of several surface phased-array systems with 32 or more coil elements.
Patient Examination
Contrast-enhanced MRA can be performed in a short time using state-of-the-art imaging technology and a standardized protocol to optimize workflow. An example of an abdominal MRA protocol for clinical use is presented in Table 15.2.
|
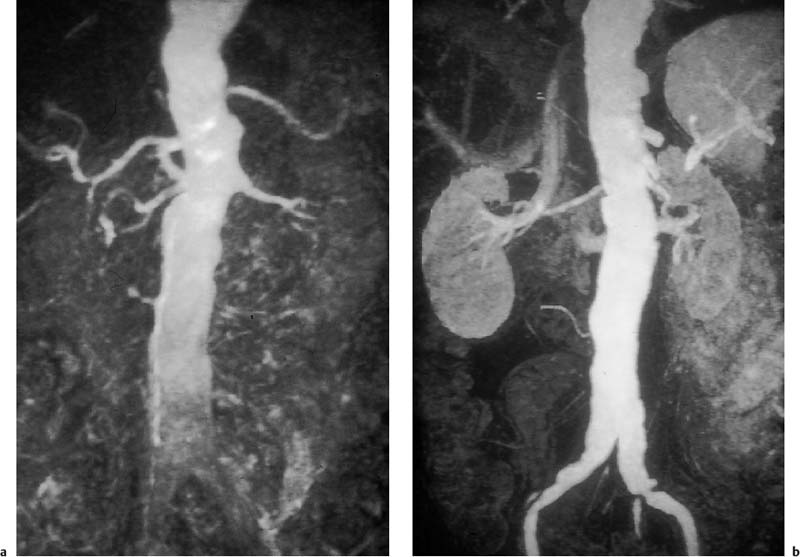
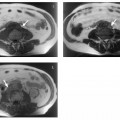
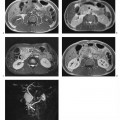
Fig. 15.2a, b Contrast-enhanced MRA of an infrarenal aneurysm of the abdominal aorta. a Inhomogeneous enhancement of the abdominal aorta due to inadequate bolus timing (at the level of the renal arteries). b Homogeneous enhancement using correct bolus timing technique (at the level of the iliac arteries).
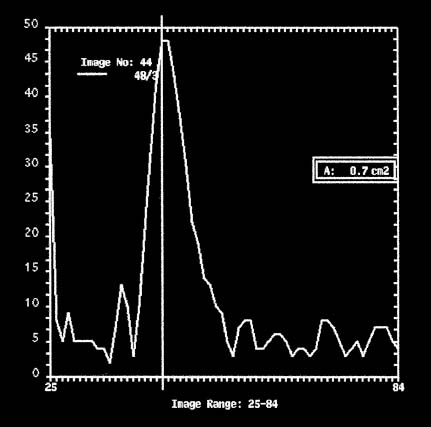
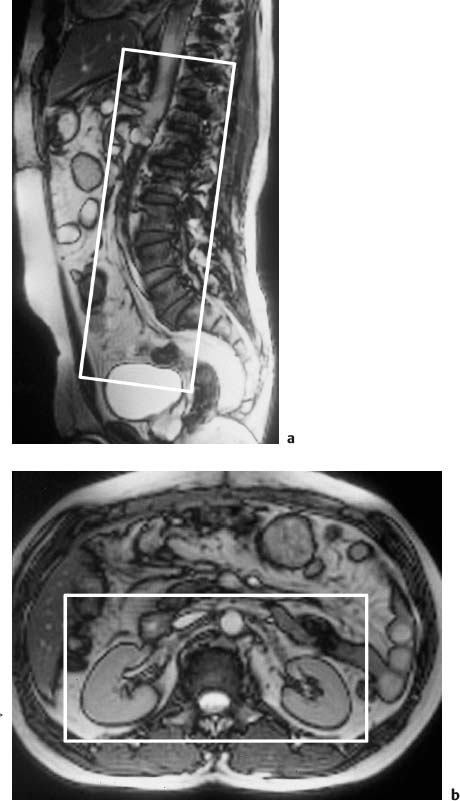
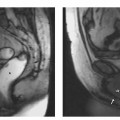
Fig. 15.4a, b Positioning of the volume slab for contrast-enhanced MRA of the renal arteries. a Sagittal image showing the slab prescribed parallel to the abdominal aorta and extending from the celiac trunk to the iliac bifurcation. b Axial view showing the slab dimensions for coverage of the kidneys.
MRI Appearance of Normal Anatomy
The vessels examined in the abdomen and pelvis are the abdominal aorta and its branches, the pelvic arteries and their branches, the portal venous system, and the inferior vena cava and its tributaries.
Abdominal and Pelvic Arteries
The abdominal aorta extends from the aortic hiatus (at about the T12/L1 vertebral level) to the aortic bifurcation (at about the L4/L5 level), where it divides into the right and left common iliac arteries (Fig. 15.5). The aorta courses anterior to the vertebral spine and slightly to the left of the midline. The following branches arise from the abdominal aorta:
• Lateral branches:
- inferior phrenic arteries (paired arteries arising from the anterior surface of the abdominal aorta at the level of the celiac trunk)
- middle suprarenal arteries (paired arteries arising from the lateral wall of the abdominal aorta at the level of the superior mesenteric artery)
- renal arteries (largest lateral branches arising from the lateral wall of the abdominal aorta below the origin of the superior mesenteric artery)
• Posterior branches:
- lumbar arteries (four pairs of lumbar arteries, of which the most inferior one arises from the iliolumbar arteries, rarely from the middle sacral artery)
- middle sacral artery (from the posterior surface of the abdominal aorta above the aortic bifurcation)
• Anterior branches:
- celiac trunk (from the anterior surface of the abdominal aorta, just below the diaphragm; three main branches: splenic, common hepatic, left gastric)
- superior mesenteric artery (from the anterior surface of the abdominal aorta, ca. 1 cm below the origin of the celiac trunk; branches: inferior pan-creaticoduodenal, 10–14 jejunal and ileal branches, middle colic, right colic, and ileocolic)
- inferior mesenteric artery (from the left anterolateral surface of the abdominal aorta, ca. 3 cm above the aortic bifurcation; branches: left colic, sigmoid branches, superior rectal).
- superior mesenteric artery (from the anterior surface of the abdominal aorta, ca. 1 cm below the origin of the celiac trunk; branches: inferior pan-creaticoduodenal, 10–14 jejunal and ileal branches, middle colic, right colic, and ileocolic)
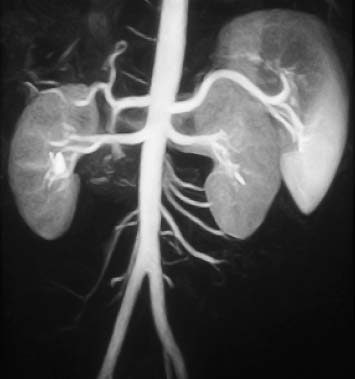
Fig. 15.5 Normal appearance of the abdominal aorta and its anterior, posterior, and lateral branches on contrast-enhanced MRA.
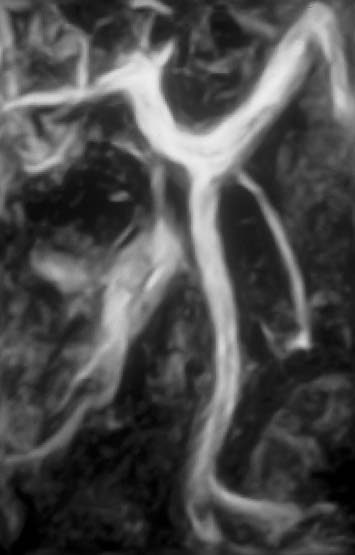
Fig. 15.6 Normal appearance of the splenic vein, superior mesenteric vein, and portal vein on contrast-enhanced MRA of the portal venous system.
The pelvic arteries begin with the common iliac arteries at the L4/L5 vertebral level, which divide into the external and internal iliac arteries at the sacroiliac level. The external iliac artery courses along the medial edge of the psoas muscle and gives off the deep circumflex iliac and inferior epigastric arteries above the inguinal ligament. Below the ligament, the external iliac continues as the common femoral artery, which is only a few centimeters long and divides into the superior and deep femoral arteries. The internal iliac artery gives variable rise to anterior and posterior branches: superior and inferior vesicle branches, middle rectal artery, obturator artery, internal pudendal artery, inferior gluteal artery anteriorly; superior gluteal and iliolumbar arteries, and 2–4 sacral arteries posteriorly.
Portal Venous System
The portal vein arises posterior to the pancreatic head as the confluence of the splenic vein with the superior mesenteric vein and the inferior mesenteric vein (Fig. 15.6). The splenic vein courses along the posterior aspect of the pancreas and receives the short gastric, pancreatic, duodenal, and left gastroepiploic veins. The superior mesenteric vein receives blood from the ileocolic vein, the iliac and jejunal veins, the pancreatic vein, the pancreatico-duodenal veins, and the right gastroepiploic vein. The inferior mesenteric vein receives the left colic vein, sigmoid veins, and the superior rectal vein.
Abdominal and Pelvic Veins
The common femoral vein becomes the external iliac vein above the inguinal ligament. The latter unites with the internal iliac vein to form the common iliac vein at the level of the sacroiliac joint. The common iliac veins join to form the inferior vena cava to the right of the abdominal aorta at the L4/L5 vertebral level. The inferior vena cava receives the paired lumbar veins, the renal veins, the right suprarenal vein, the right gonadal vein, the phrenic veins, and the liver veins. The left gonadal and suprarenal veins usually drain into the left renal vein.
MRI Appearance of Pathologic Entities
Abdominal and Pelvic Arteries
The most common indications for MRA of the abdominal aorta and pelvic arteries are aneurysm, dissection, and stenosis or occlusion.
Aortic Aneurysm
Related posts:

Stay updated, free articles. Join our Telegram channel

Full access? Get Clinical Tree


