MD Maryam Golshan Momeni, MD
Jamshid Tehranzadeh, MD
INTRODUCTION TO BONE TUMORS
Being able to recognize bone lesions, discern their aggressiveness, and formulate a competent differential diagnosis are skills that every good radiologist should have. Primary bone neoplasms are quite rare, and because of this it often rests on the radiologist’s shoulders to give an accurate differential diagnosis and guide the clinician’s next step and further management of the lesion. In this chapter, we will provide explanations of the musculoskeletal tumors and basic steps to help in formulating a diagnosis and providing appropriate follow up. A team approach is important for diagnosis and proper treatment of these relatively rare entities. We first address benign and malignant bone tumors based on their matrix and then we will describe important multiple bone lesions including metastases and multiple myeloma. At the end of the chapter, there is a brief discussion on soft tissue tumors.
 Tips for Formulating a Differential Diagnosis
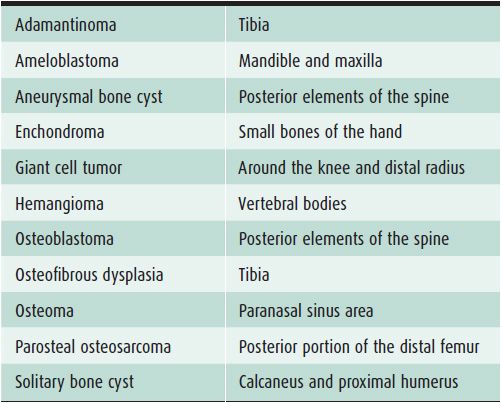
In evaluating bone lesions, it is essential to be able to synthesize a complete, yet succinct differential diagnosis. Thankfully there are many other factors that aid in ruling certain entities in or out of a differential diagnosis besides imaging. Things such as the patient’s age (Tables 7-1 and 7-2), location of the lesion (Tables 7-3 and 7-4), and clinical history are invaluable information. That is why throughout this chapter, there will be emphasis placed on the age groups affected by each lesion, where the lesion commonly occurs, and any other characteristic information that would help narrow a differential diagnosis. At the conclusion of the chapter, there will be tables that break up bone tumors by age groups and list neoplasms with characteristic locations.
Table 7-1. Benign Bone Lesions to Consider Depending on Patient Age
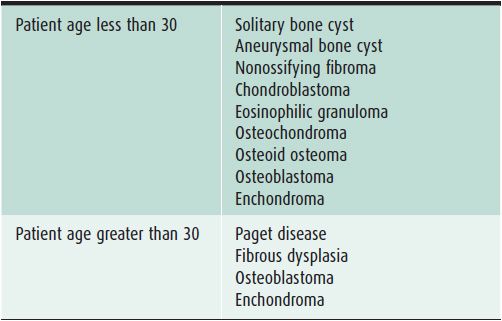
Table 7-2. Malignant Bone Lesions to Consider Depending on Patient Age
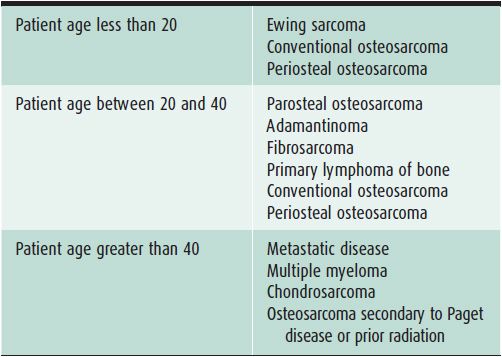
Table 7-3. Benign Epiphyseal Lesions
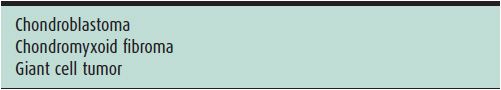
Table 7-4. Bone Lesions with Characteristic Locations
An important step when characterizing a bone neoplasm is discerning the matrix of the lesion, which is dependent on the neoplasm’s cell type. This may not always be straightforward because some lesions may not have very much visible matrix on radiograph. However, it is helpful in most of the cases and should be done whenever possible. The three main categories widely discussed are osseous, cartilaginous, and fibrous matrices. Bone forming, or osseous, tumors such as osteosarcoma have a calcification pattern that is described as fluffy and cloud-like (Figure 7-1).1
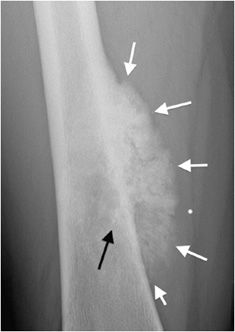
Figure 7-1. Osteosarcoma. Shows osteoid matrix (black arrow) and soft tissue ossifications (white arrows) in a patient with known osteosarcoma.
Lesions with a chondroid matrix (enchondroma, chondrosarcoma, etc.) are described as popcorn-like calcifications or rings and arcs (Figure 7-2).1 Fibrous lesions (e.g., fibrous dysplasia) have a ground-glass appearing matrix (Figure 7-3).
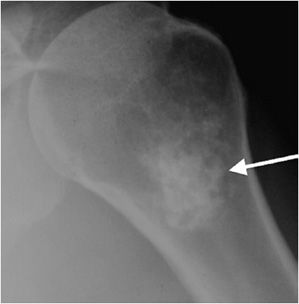
Figure 7-2. Enchondroma. Shows chondroid matrix with fluffy snowflake, arc, and ring appearance (arrow) in a patient with enchondroma in humerus.
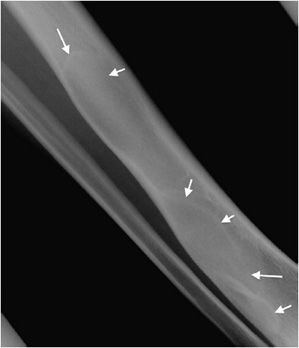
Figure 7-3. Fibrous dysplasia. Classic ground glass lytic lesions with fibrous matrix (arrows) in a patient with fibrous dysplasia of the tibia.
 Features Differentiating Benign Versus Malignant Lesions
Before delving into the specific lesions, it would be prudent to discuss certain findings that are helpful in distinguishing between benign and malignant neoplasms.
The most reliable sign when deciding whether or not a lesion appears aggressive versus benign is the zone of transition. The zone of transition can be thought of as the border between the lesion and surrounding normal bone. A narrow zone of transition implies that there is a sharp demarcation between the lesion and normal bone. Narrow zones of transition are associated with benign lesions and are categorized as either 1a or 1b lesions. The only difference between the two is that a 1a lesion has a sclerotic border, while a 1b lesion does not (Figures 7-4 and 7-5).1 A wide zone of transition means it is difficult to separate where the lesion ends and normal bone begins, and implies a more aggressive process categorized as 1c lesions.1 There is a hazy border due to inflammatory response of surrounding bone, and the lesion appears to blend in with its surroundings (Figure 7-6). These are not steadfast rules, and there are examples of benign lesions that can have wide zones of transition (e.g., Langerhans cell histiocytosis and osteomyelitis).
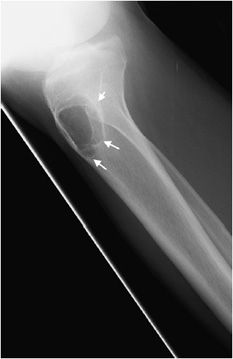
Figure 7-4. Chondromyxoid fibroma of the proximal tibia. Shows well-defined osteolytic lesion in the proximal tibial metaphysis with sclerotic margin (arrows) characteristic of geographic type 1a in this patient with proven chondromyxoid fibroma.
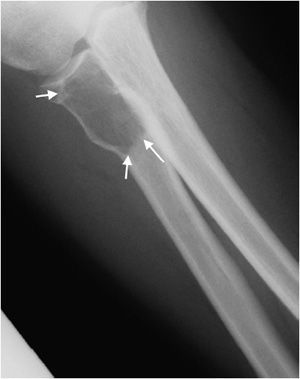
Figure 7-5. Giant cell tumor of proximal radius. Shows a well-defined lucent lesion in epimetaphysis of the proximal radius (arrows) in a 25-year-old female with sharp zone of transition but no evidence of sclerotic margin, characteristic of geographic type 1b lesion. This lesion was a giant cell tumor upon excisional biopsy.
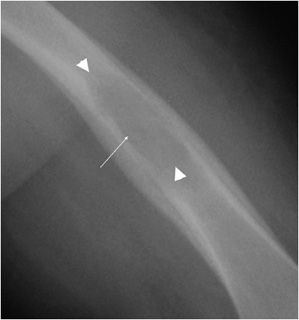
Figure 7-6. Langerhans cell histiocytosis (eosinophilic granuloma). Lucent lesion in the diaphysis of the femur (long arrow) with well-defined but hazy borders (arrow heads) compatible with geographic type 1c lesion in this patient with Langerhans cell histiocytosis.
If a bone lesion appears to be invading the surrounding bone, it is termed an infiltrative lesion. These lesions are generally described as either moth-eaten or permeative, and imply a malignant or aggressive process. A moth-eaten pattern is seen in processes like multiple myeloma and is labeled as a type 2 lesions (Figure 7-7). Permeative processes are type 3, and are usually seen in aggressive lesions such as lymphoma and Ewing sarcoma (Figure 7-8). Lastly, if there has been compromise of the bone cortex, and the neoplasm is invading the soft tissues, the lesion is aggressive or malignant.1
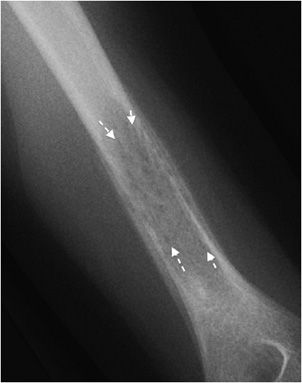
Figure 7-7. Ewing sarcoma. Type 2 lesions with areas of moth-eaten osteolysis (arrows) in a patient with Ewing sarcoma of the humeral shaft.
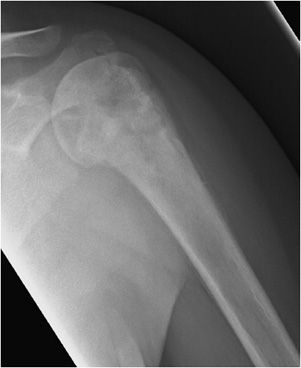
Figure 7-8. Ewing sarcoma. Permeative type 3 lesion in left humerus metaphysis in a 11-year-old patient with Ewing sarcoma.
Another helpful sign is periosteal reaction, of which there are different types depending on how aggressive the lesion is. A benign lesion is slow growing, giving the bone time to form a uniform and walled-off periosteum. This leads to a unilamellated periosteal reaction (Figure 7-9A).1 Another type of periosteal reaction that falls in between the benign and aggressive categories is the multilamellated or “onion skin” type (Figure 7-9B).1 A lamellated periosteal reaction is laid down layer by layer during exacerbation and in between the remissions. Faster growing lesions (usually malignant) allow the bone less time to lay down new periosteum, giving the periosteum a “sunburst” or “hair-on-end” type of appearance (Figure 7-9C). Codman triangle is another type of periosteal reaction that is associated with more aggressive lesions. This occurs when the periosteum is elevated away from the cortex of the bone by the tumor (Figure 7-9D). So the types of periosteal reaction from least aggressive too most aggressive are unilamellated, multilamellated, Codman triangle, and sunburst.
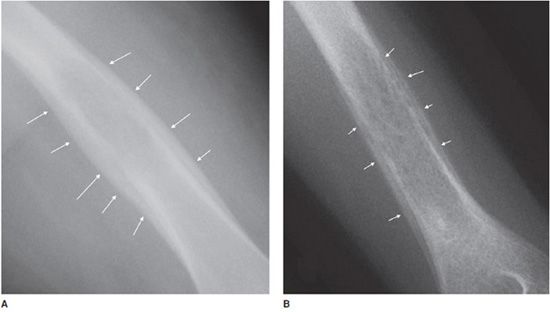
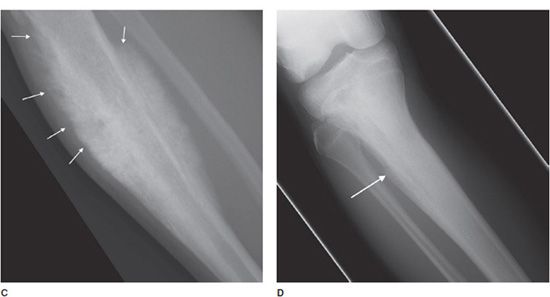
Figure 7-9. Eosinophilic granuloma of the femoral shaft (A). Radiograph of femur shows uniform, solid, thick periosteal reaction (arrows) in a patient with eosinophilic granuloma. Ewing sarcoma of the humeral shaft (B). In different patient, lamellated periosteal reaction known as onion skin (arrows) in a patient with Ewing sarcoma. (C) Osteogenic osteosarcoma. In different patient, perpendicular periosteal reaction known as sunburst (arrows) in a patient with osteogenic osteosarcoma. (D) Ewing sarcoma. In different patient, Codman triangle periosteal reaction (arrow) in a patient with Ewing sarcoma.
![]() Important clues for formulating a diagnosis include patient age, location of the lesion, matrix of the lesion, the zone of transition, presence of periosteal reaction, and whether or not there is soft tissue involvement.
Important clues for formulating a diagnosis include patient age, location of the lesion, matrix of the lesion, the zone of transition, presence of periosteal reaction, and whether or not there is soft tissue involvement.
OSSEOUS NEOPLASMS
 Benign Osseous Neoplasms
Osteoid Osteoma
This is a benign bone-forming tumor that comprises 10-13.5% of all benign skeletal neoplasms.2,3 This lesion is more common in males and below age 30.2,4–6 Osteoid osteoma is most frequently found in the femur, tibia, and spine, but cases of this lesion have been reported in nearly every bone. The classic presentation that is the hallmark of osteoid osteomas is pain, most severe at night, relieved with small doses of salicylates. Although very specific for osteoid osteomas, this triad is only found in about 30–50% of the cases.4 The reason salicylates provide pain relief is that increased levels of pros-taglandin are seen in patients with osteoid osteomas. Other possible symptoms include referred pain, localized atrophy, painful scoliosis,5,6 and sleep disturbance due to the severity of the pain.
Osteoid osteomas consist of a small radiolucent nidus that is surrounded by a region of reactive/sclerotic bone. The nidus is a tightly woven mass of osteoid trabeculae lined by osteoblasts. The nidus is generally less than 1 cm in diameter,4 and by definition has to be less than 1.5 cm (otherwise it is classified as an osteoblastoma).5 The surrounding sclerotic bone can be thought of as an inflammatory reaction to the nidus, and is composed of thickened cortical bone and fibrovascular tissue.2 The nidus may have a small calcification in its center. Osteoid osteomas can be intracortical, subperiosteal, or located within cancellous bone. Cortical osteoid osteomas are the most common and are the lesions that incite the largest amount of sclerotic bone formation. The unique composition of osteoid osteomas is what gives the cortical lesions their characteristic appearance of a circular lucency with a surrounding zone of sclerosis (Figure 7-10). In approximately 75% of the cases, the lesion can be confidently diagnosed on the radiograph. If an osteoid osteoma is suspected, CT is generally obtained because it allows for the best visualization of the nidus and surrounding sclerotic area2 (Figure 7-11). Osteoid osteoma in cancellous bone may not have significant osteosclerosis. Another modality helpful in the diagnosis of osteoid osteomas is the technetium99m (99mTc) methylene diphosphonate (MDP) bone scan. On bone scans, the nidus has high activity (Figure 7-12) and the surrounding sclerotic bone will show decreased activity. Therefore, the nidus appears as a “target” lesion or has a “bull’s-eye” appearance (dark inner nidus with light surrounding sclerotic bone), all better depicted in single photon emission computed tomography (SPECT). The bone scan is extremely valuable in intraoperative tumor localization, as well as nidus detection within the excised surgical specimen.7
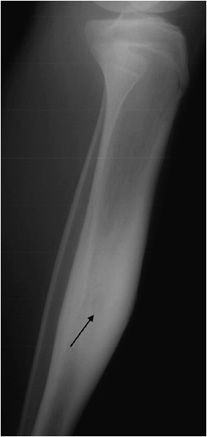
Figure 7-10. Osteoid osteoma. Radiograph of the tibia shows lucent lesion (arrow) with the surrounding and extensive adjacent cortical thickening and sclerosis in a 15-year-old male with osteoid osteoma.
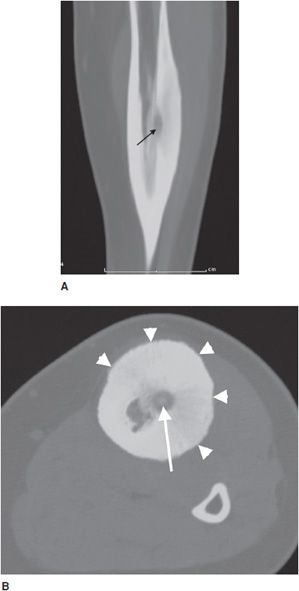
Figure 7-11. Osteoid osteoma. (A) Sagittal CT of the tibia shows the nidus of osteoid osteoma (black arrow) with extensive adjacent cortical thickening and sclerosis. (B) Axial CT of same lesion shows lucent nidus with central mineralization (arrow). Arrowheads are marking cortical thickening in this patient with osteoid osteoma.
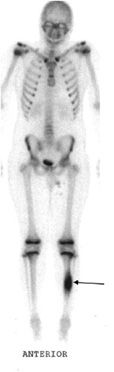
Figure 7-12. Osteoid osteoma. Whole body bone scan shows increased activity (arrow) at the region of osteoid osteoma.
When left alone, osteoid osteomas do show slow regression with eventual resolution after many years. However, due to the severity of symptoms, most patients seek treatment much sooner. The current treatment of choice is radio frequency ablation (RFA) under CT guidance using extremely high temperatures to destroy abnormal tissue. To avoid recurrence and ensure resolution, the entire nidus must be ablated. The procedure is performed on an outpatient basis.2
Differential diagnosis: Osteoblastoma, stress fracture, chronic osteomyelitis.
PEARLS
![]() Most common in patients below the age of 30.
Most common in patients below the age of 30.
![]() Classic presentation of pain, worsening of the pain at night, and relief with salicylates.
Classic presentation of pain, worsening of the pain at night, and relief with salicylates.
![]() Cortical subtype is the most common, and will exhibit the classic appearance of a small lucent nidus surrounded by sclerotic bone.
Cortical subtype is the most common, and will exhibit the classic appearance of a small lucent nidus surrounded by sclerotic bone.
![]() Current treatment is usually with RFA with goal to ablate the entire nidus.
Current treatment is usually with RFA with goal to ablate the entire nidus.
Osteoblastoma
Osteoblastoma is rare, accounting for less than 1% of primary bone tumors. They are more common in men, between the second and third decades of life.4,5 These lesions are similar histologically to osteoid osteomas, with the differences between the two being the size of the lesion (osteoblastomas are classified as larger than 1.5 cm in diameter) and aggressiveness of the neoplasm (osteoblastomas are more aggressive and more likely to undergo malignant transformation).6 Despite their similar histological appearance, they have different symptomatic presentations. As mentioned earlier, osteoid osteomas tend to present with pain that is more severe at night and relieved with salicylates. Osteoblastomas can be asymptomatic, or present with a dull pain that is progressive (due to their aggressive nature).5
Additionally, osteoblastomas are more likely to have associated neurological deficits than osteoid osteomas when there is spinal involvement (25–70% for osteoblastoma compared with 0–30% for osteoid osteoma6). Painful scoliosis may occasionally be associated with this lesion. Osteoblastomas most commonly occur in the spine (40% of cases5,6), sacrum, and diaphysis of long bones. Radiographically, osteoblastomas are commonly lucent (50% lucent, 30% sclerotic, and 20% mixed6), usually occur in the cancellous bone, and are less likely to have the sclerotic reactive bone that is seen with osteoid osteoma. They will have well-defined margins and are often expansile5 (Figure 7-13). The mainstay of treatment of these lesions is curettage with subsequent bone grafting.8,9 The recurrence rate of osteoblastomas is 10–15%, and due to incomplete resection.9
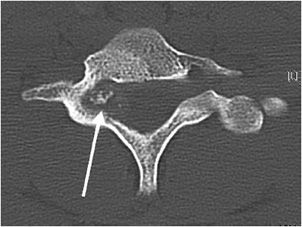
Figure 7-13. Osteoblastoma. Axial CT of the cervical spine shows an expansile lesion in the posterior elements with central calcification. This lesion proved to be an osteoblastoma upon biopsy. (Image used with permission from Dr. H. Yoshioka, MD, University of California, Irvine.)
Differential diagnosis: Aneurysmal bone cyst, osteoid osteoma, giant cell tumor, osteosarcoma.
![]() 90% of osteoblastomas occur between the second and third decades of life.
90% of osteoblastomas occur between the second and third decades of life.
![]() Common locations are the spine (40%), sacrum, and diaphysis of long bones.
Common locations are the spine (40%), sacrum, and diaphysis of long bones.
![]() Most often lytic and expansile with a well-defined border.
Most often lytic and expansile with a well-defined border.
![]() Possible symptoms include dull pain, painful scoliosis, and neurological deficits.
Possible symptoms include dull pain, painful scoliosis, and neurological deficits.
Osteoma
These are rare, benign neoplasms that are characterized by the proliferation of either compact or cancellous bone.10,11 Osteomas can vary in size, but most are less than 2 cm in diameter. They often are an incidental finding and are most commonly located in the paranasal sinus area.10 They are more common in males between 30 and 40 years of age.11 Radiographically, they will appear as sclerotic, round, and well-marginated lesions attached to the underlying bone (Figure 7-14). If a patient has multiple osteomas, there is usually an association with Gardner syndrome (an autosomal-dominant disease characterized by colorectal polyposis, desmoids tumors, multiple osteomas, and supernumerary teeth).
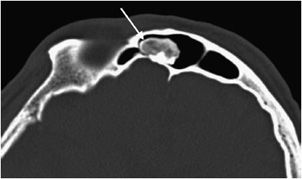
Figure 7-14. Osteoma. Axial CT of the head shows an osteoma (arrow) in the frontal sinus.
Differential diagnosis: Osteoid osteoma, bone island, parosteal osteosarcoma.
PEARLS
![]() Usually smaller than 2 cm.
Usually smaller than 2 cm.
![]() Most commonly located in the paranasal sinus area.
Most commonly located in the paranasal sinus area.
![]() Are sclerotic, round, well marginated, and attached to underlying bone.
Are sclerotic, round, well marginated, and attached to underlying bone.
![]() Multiple osteomas or one located in the sphenoid sinus should raise the suspicion of Gardner syndrome.
Multiple osteomas or one located in the sphenoid sinus should raise the suspicion of Gardner syndrome.
 Malignant Osseous Neoplasms
Osteosarcoma
This is the second most common primary neoplasm of bone following multiple myeloma,12 and accounts for about 20% of all bone sarcomas. It is defined as a malignant tumor in which the tumor cells produce bone, or osteoid.12 Like most other bone tumors, it is more common in males than in females (2:1).13 About 50% of osteosarcomas occur around the knee joint with the distal femur being the most frequent site involved. Conditions that can predispose patients to the development of osteosarcoma include bone infarcts, large doses of radiation, Paget disease, and rarely fibrous dysplasia. There are multiple subtypes of osteosarcoma, and these can be differentiated by a combination of their radiographic characteristics and the patient’s demographics.
Conventional Osteosarcoma
This is the most common form, accounting for roughly 85% of osteosarcomas. It occurs predominantly in teenagers and young adults.12,13 In endemic areas for Paget disease, such as in Great Britain, a secondary peak of osteosarcoma is noted around 50–60 years of age that may be related to degeneration of Paget disease. They most commonly involve the metaphysis of long bones, specifically the distal femur (40–45% of cases13). Conventional osteosarcomas are often osteoblastic (i.e., bone forming), which gives them a predominantly sclerotic appearance on plain radiographs that is commonly described as amorphous and cloudy13 (Figure 7-15A). These tumors are extremely aggressive, making it common to see a “sunburst” or malignant periosteal reaction. In addition to this, their aggressive growth causes them to have poorly defined margins with a wide zone of transition (Figure 7-16). Osteosarcomas will often disrupt the cortex of the bone; therefore CT and MR play an important and complementary role in the evaluation of intramedullary and extraosseous soft tissue extension of the tumors (Figure 7-15B,C).13 Radionuclide bone scans are invariably positive in osteosarcomas and have been proven to be valuable in the early detection of osseous metastases of primary bone tumors (Figure 7-17).
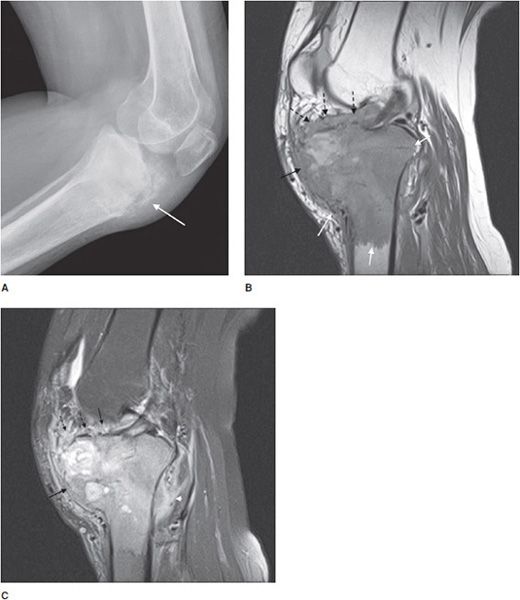
Figure 7-15. Conventional high-grade osteosarcoma. (A) Lateral view of the knee shows an aggressive mixed lytic and sclerotic lesion with soft tissue ossification (arrow) in metaepiphysis of the tibia with spiculated perpendicular periosteal reaction. Sagittal proton density (B) and sagittal postcontrast fat saturated T1-weighted image (C) shows the aggressive mass lesion in the proximal tibia extending to the knee joint (dotted arrows) and pretibial soft tissue (black arrow). Note the soft tissue involvement at the posterior aspect of the knee (arrowhead), better depicted on the postcontrast image (C).
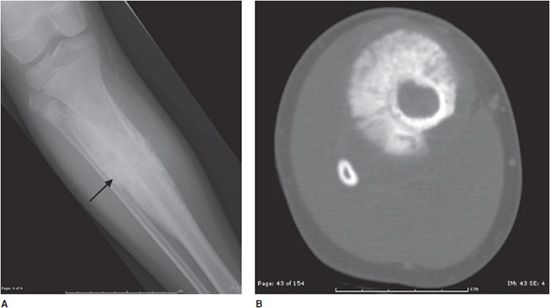
Figure 7-16. Conventional osteosarcoma. (A) Frontal view of the leg in a 11-year-old male shows an aggressive bone-producing tumor (arrow) with perpendicular periosteal reaction in metadiaphysis of the tibia. The lesion has ill-defined zone of transition. (B) Axial CT of tibia shows details of sunburst periosteal reaction in this lesion.
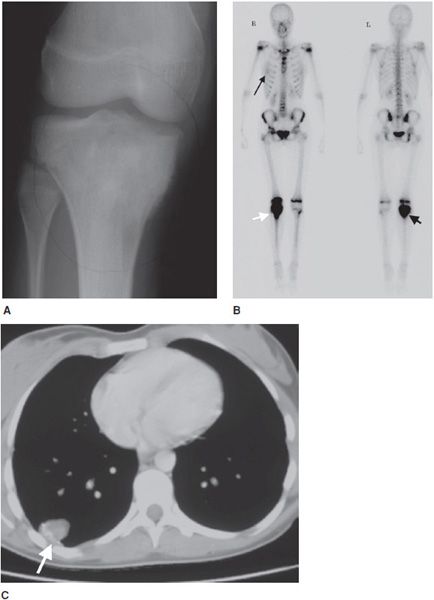
Figure 7-17. Osteosarcoma. (A) A 16-year-old female with osteosarcoma of the proximal tibia seen on plain radiograph of the knee. (B) Whole body bone scan of this patient shows high activity in the right tibia (short arrows). There is faint activity in the right chest (long arrow) that on a subsequent CT of the chest (C) showed a soft tissue mass (arrow) with internal ossification, compatible with metastatic osteosarcoma.
Differential diagnosis: Ewing sarcoma, osteomyelitis, lymphoma, chondrosarcoma.
PEARLS
![]() Most common age groups affected are teenagers and young adults.
Most common age groups affected are teenagers and young adults.
![]() Favorite location is the metaphysis of the femur.
Favorite location is the metaphysis of the femur.
![]() Aggressive lesions that often destroy the cortex, invade soft tissues, and have a wide zone of transition.
Aggressive lesions that often destroy the cortex, invade soft tissues, and have a wide zone of transition.
![]() Usually sclerotic with aggressive periosteal reaction (“sunburst pattern” and Codman triangle are common).
Usually sclerotic with aggressive periosteal reaction (“sunburst pattern” and Codman triangle are common).
Parosteal Osteosarcoma
These lesions account for 5% of osteosarcomas.8 They have the lowest grade of malignancy among the osteosarcomas, and therefore have the best prognosis. Parosteal osteosarcomas affect an older age group than the conventional and periosteal subtypes, generally affecting 25–50-year-old patients.14 They originate from the periosteum of the bone, usually do not break the cortex, and most commonly occur in the metaphysis of long bones.15 They have a typical location of the posterior distal femur,8 with the proximal humerus being the second most common location. On radiographs they will appear dense, lobulated, and look as if they are encircling the bone (Figure 7-18).8
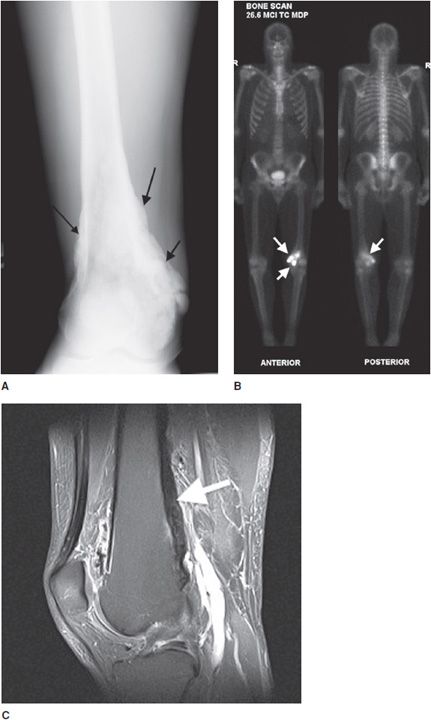
Figure 7-18. Parosteal osteosarcoma. (A) Frontal radiograph of the femur shows dense ossification (arrows) surrounding distal femur in a 25-year-old male. (B) Whole body bone scan confirms increased uptake in right distal femur (arrows). (C) Sagittal fat saturated T1-weighted MRI of the knee after administration of the contrast shows ossification in posterior aspect of the femur (arrow). No definite evidence of marrow involvement noted.
Differential diagnosis: Periosteal osteosarcoma, myositis ossificans, osteochondroma.
![]() Affects an older age group than conventional and periosteal subtypes.
Affects an older age group than conventional and periosteal subtypes.
![]() Best prognosis of all osteosarcoma subtypes.
Best prognosis of all osteosarcoma subtypes.
![]() Usually does not disrupt the cortex, involves the metaphysis, has a juxtacortical appearance.
Usually does not disrupt the cortex, involves the metaphysis, has a juxtacortical appearance.
![]() Most common in the distal femur, followed by the humerus.
Most common in the distal femur, followed by the humerus.
Periosteal Osteosarcoma
These lesions are rare, accounting for roughly 1.5% of all osteosarcomas,8 and 25% of juxtacortical osteosarcomas.14 It is intermediate in degree of malignancy and the prognosis falls between conventional osteosarcoma (worst) and parosteal osteosarcoma (best).14 The age of occurrence usually is in the second decade of life,16 a slightly younger age group than conventional and parosteal forms. The tibia and femur are most commonly affected (85–95% of cases) and this lesion is predominantly diaphyseal (unlike conventional osteosarcoma, which is metaphyseal).14 Patients commonly present with nonspecific findings such as pain and a palpable mass.14 Radiographically, the lesion consists of a soft tissue mass attached to the cortex of the bone that causes cortical thickening14 (Figure 7-19). The tumor grows from the periphery of the cortex into the adjacent soft tissues, generally leaving the cortex intact. Endosteal and medullary bone generally remain unaffected.14 It is common to see periosteal reaction with these types of lesions. If the tumor involves the marrow, the prognosis is worse and approaches that of conventional osteosarcoma.
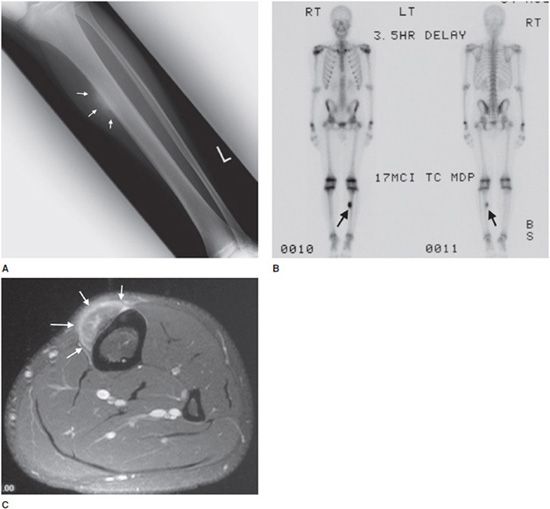
Figure 7-19. Periosteal osteosarcoma. (A) Frontal radiograph of the left tibia shows a juxtacortical lesion with aggressive perpendicular and spiculated periosteal reaction (arrows) in a teenage boy. (B) Whole body scan shows solitary lesion in left tibia with increased uptake (arrows). (C) Axial postcontrast fat saturated T1-weighted MRI shows enhancing juxtacortical mass lesion (arrows) with no evidence of cortical or marrow involvement.
Differential diagnosis: Parosteal osteosarcoma, myositis ossificans, chondrosarcoma.
PEARLS
![]() Affects a younger patient population than conventional and parosteal subtypes.
Affects a younger patient population than conventional and parosteal subtypes.
![]() Predominantly diaphyseal in location.
Predominantly diaphyseal in location.
![]() Medium prognosis (worse than parosteal subtype, but better than conventional subtype).
Medium prognosis (worse than parosteal subtype, but better than conventional subtype).
![]() Can have periosteal reaction, but will not disrupt the cortex or involve the medullary bone.
Can have periosteal reaction, but will not disrupt the cortex or involve the medullary bone.
Telangiectatic Osteosarcoma
This tumor comprises 2.5–12% of all osteosarcomas and has a slightly worse prognosis than the conventional subtype. It affects a broad range of age groups; therefore, the age is not necessarily a determining factor. Lesions are predominantly lytic with a minimal amount of sclerosis, and the most common locations are the distal femur (48% of cases) and proximal humerus. They are aggressive lesions with cortical disruption, endosteal scalloping, and a wide zone of transition (Figure 7-20). The tumor has spaces that are dilated by aneurysms lined with neoplastic cells that produce osteoid. Since this lesion appears cystic, it can mimic an aneurysmal bone cyst or giant cell tumor. A helpful discriminating factor is that the walls in a telangiectatic osteosarcoma are thicker and more nodular than in a benign cystic lesion in cross-sectional imaging. The presence of fluid levels on MRI or CT of an expansile osteosarcoma suggests this diagnosis.17
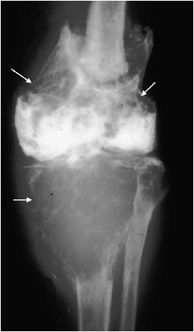
Figure 7-20. Telangiectatic osteosarcoma. Fontal radiograph of the knee shows an expansile lytic lesion in distal femur, proximal tibia, and fibula with thick septations and pathologic fracture of distal femur and tibia (arrows).
Differential diagnosis: aneurysmal bone cyst, giant cell tumor, solitary bone cyst, Ewing sarcoma.
PEARLS
![]() Predominantly lytic.
Predominantly lytic.
![]() Fluid levels on MRI.
Fluid levels on MRI.
![]() Slightly worse prognosis than conventional osteosarcoma.
Slightly worse prognosis than conventional osteosarcoma.
Management of Osteosarcomas
The typical management of aggressive osteosarcomas includes neoadjuvant chemotherapy/radiation, followed by wide local excision and adjuvant chemotherapy.13,14,17 Most patients are fitted for custom prosthetics to replace the portion of removed bone/extremity. The lungs are the most common site of metastases, and are involved 80% of the time when metastatic disease is present.13 When metastases occur, they usually do so in the first 2 years, but can occur at any time.12 Since parosteal osteosarcomas are less aggressive, they are usually treated with surgical resection alone (no neoadjuvant chemotherapy or radiation14).
CARTILAGINOUS NEOPLASMS
 Benign Cartilaginous Neoplasms
Osteochondroma
This is the most common benign bone tumor, accounting for 45% of benign lesions and 10–15% of all bone tumors.18 The lesion has a predilection for males4 and most commonly arises in the first three decades of life. As the name suggests, the lesion contains both bony and cartilaginous tissue. Think of it as a cartilage capped bony outgrowth. The tumor is usually asymptomatic and often found incidentally, meaning that the actual prevalence is likely higher than quoted. However, osteochondromas can be symptomatic if there is mass effect that causes nerve or vascular impingement.18 When large, osteochondromas can impinge on the adjacent soft tissues and cause a bursitis, termed bursa exostotica. One new theory is that osteochondromas may originate from an injury at the growth plate metaphyseal junction. Therefore, the classic location is the metaphysis of long bones (70% of the time). The most common site is the distal femur, followed by the proximal tibia and the humerus. Characteristic findings on radiographs include a bony stalk or outgrowth projecting from the metaphysis that usually points away from the adjacent joint (Figure 7-21). A distinguishing feature is the continuity of bone cortex between the normal bone and the cortex of the osteochondroma. As stated above, most osteochondromas have a thin (less than 1 cm) cartilaginous cap that cannot be seen on radiographs but is visible on CT and MRI (Figures 7-22 and 7-23). An important point to emphasize is that a cartilaginous cap greater than 1-3 cm (depending on the source) may suggest a malignant lesion, chondrosarcoma. Other signs suggestive of malignancy include pain (not very specific) and continued growth after fusion of the nearest epiphyseal plate. Since malignant degeneration in solitary osteochondromas is roughly 1%,19 routine removal of these tumors is not justified unless the lesion causes symptoms from mechanical irritation (Figure 7-24) or is growing disproportionately in size.
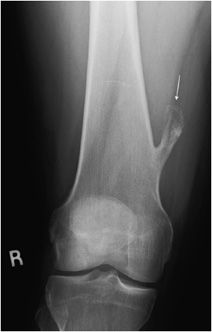
Figure 7-21. Osteochondroma of distal femur. Frontal view of the femur shows a bony stalk located in metaphysis and pointing away from the knee joint (arrow). Note there is continuity of cortex and marrow to this lesion.
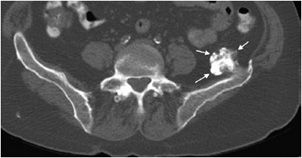
Figure 7-22. Osteochondroma of the ilium. Axial CT image of the pelvis shows an osteochondroma with thin cartilage cap.
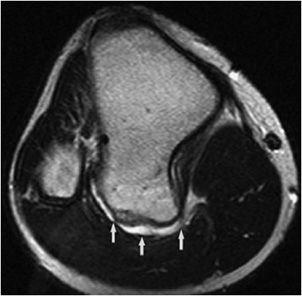
Figure 7-23. Sessile osteochondroma of the tibia. Axial proton density MRI shows osteochondroma in posterior aspect of the tibia with thin bright cartilage cap (arrows).
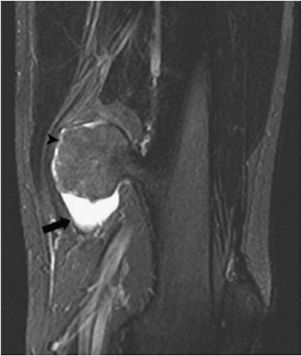
Figure 7-24. Bursitis exostotica. Coronal fluid sensitive MRI of the femur shows osteochondroma with adjacent bursitis characterized by fluid around it (thick arrow). There is a thin cartilage cap around the superior aspect of the lesion (arrowhead). (Reproduced from Blacksin M. Bursitis secondary to osteochondroma. In: Musculoskeletal Imaging Cases, Tehranzadeh J, ed. New York, NY: McGraw-Hill; 2009:570-571.)
Differential diagnosis: Parosteal osteosarcoma, chondrosarcoma, juxtacortical myositis ossificans, bony callus.
PEARLS
![]() More common in patients younger than 30.
More common in patients younger than 30.
![]() Cortex is continuous between the osteochondroma and the host bone.
Cortex is continuous between the osteochondroma and the host bone.
![]() Points away from the nearest joint.
Points away from the nearest joint.
![]() Pain, soft tissue mass, and a thick cartilage cap suggest malignancy.
Pain, soft tissue mass, and a thick cartilage cap suggest malignancy.
Hereditary Multiple Exostosis
Hereditary multiple exostosis (HME) is a medical condition defined by multiple osteochondromas. Although 10–20% of cases are due to spontaneous mutations, it is primarily a hereditary disease with an autosomal-dominant inheritance pattern. The exostoses can occur in numerous sites with the knees being most frequently involved.19 Because of this, knee radiographs are often imaged for initial screening in a patient thought to have HME. The radiographic appearance is similar to that of a single osteochondroma. However, the presence of multiple exostoses can cause bony deformities (diaphyseal aclasia) and growth abnormalities (Figure 7-25). These lesions have a higher risk of developing chondrosarcoma compared with a solitary osteochondroma, 3–5% for HME versus 1% for a solitary osteochondroma.19 Whenever uncertain, cross-sectional imaging can help differentiate a benign exostosis from chondrosarcoma. Signs suggestive of malignancy are the same as those for a single exostosis.
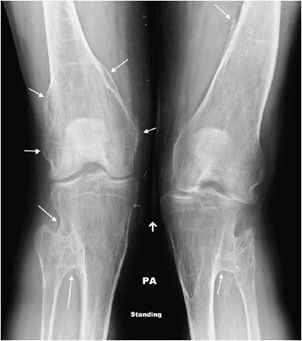
Figure 7-25. Hereditary multiple exostosis. PA radiograph shows multiple osteochondromas around the knee in a 48-year-old female causing fusion of bilateral proximal tibiofibular joints and widening and deformity of femora and both tibial metadiaphysis (diaphysial aclasia).
Enchondroma
This is a benign, intramedullary cartilage-forming tumor that shows no male or female predominance.9,20 It can occur at any age, but is most common in patients from the ages of 10–20 years old. Enchondromas favorite location is the short tubular bones of the hand, with other common locations being the metaphysis of the humerus, tibia, and femur.20 In fact, they are the most common bone tumor of the hand.21 Enchondromas are almost always asymptomatic and found incidentally, but can occasionally present as pathologic fractures when located in the hand. On histology, enchondromas show islands of hyaline cartilage surrounded by lamellar bone.20
Radiographically, enchondromas are small (less than 5 cm), have a cartilage matrix with stippled calcifications, have lobulated well-defined margins, and show no cortical involvement or soft tissue extension9,20 (Figure 7-26). When located in the hand, enchondromas can be entirely lucent and do not need to have the characteristic internal calcifications. If there is a question of aggressiveness, CT and MRI can aid with determining the level of bone disruption and soft tissue involvement (Figure 7-27). Endosteal scalloping can occur in enchondromas of the hand, but should raise the suspicion for a low-grade chondrosarcoma (Figure 7-28).20 Occasionally, enchondromas can have a similar appearance to bone infarcts, and an important differentiating factor to remember is that bone infarcts will have a serpiginous, sclerotic border (Figure 7-29).
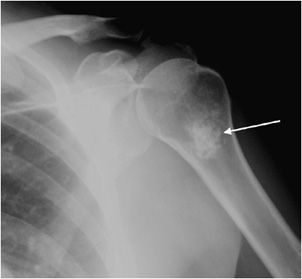
Figure 7-26. Enchondroma. Frontal view of the humerus shows classic chondroid calcification (arrow) in proximal humerus metaphysis compatible with enchondroma.
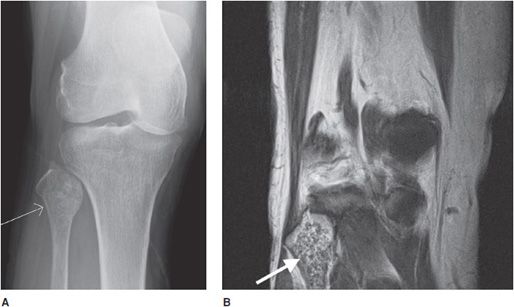
Figure 7-27. Enchondroma. (A) Frontal view of the knee and (B) coronal proton density MRI of the knee show popcorn calcifications in fibular head (arrow) with preserved cortex compatible with enchondroma.
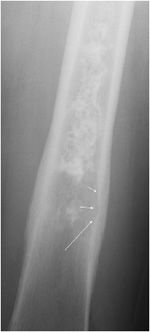
Figure 7-28. Chondrosarcoma of the femur. Frontal radiograph of the femur shows a chondroid lesion in diaphysis with endosteal scalloping (arrows). Subsequent biopsy showed low-grade chondrosarcoma.
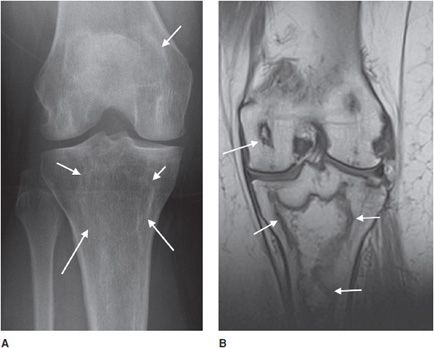
Figure 7-29. Bone infarct. (A) Frontal radiograph of the knee shows serpiginous densities (arrows) in distal femur and proximal tibia. (B) Coronal proton density MRI shows bone infarct in distal femur and proximal tibia (arrows) in same patient with history of systemic lupus erythematosis.
A common diagnostic dilemma is a patient who presents with pain, gets imaging, and a cartilaginous bone lesion is identified. In this case, it is important to discern if pain is from the lesion or another unassociated problem. If the pain resolves with therapy, then the lesion is likely an incidentally found enchondroma and it can be followed without further intervention. If the pain is persistent, then it should be attributed to the lesion, and determining malignant potential is a must. Differentiating between an enchondroma and a low-grade chondrosarcoma is a major quandary that radiologists and orthopedic surgeons face because they can appear very similar both radiographically and histologically. The most helpful discriminating factor is that enchondromas will rarely have associated pain, while low-grade chondrosarcomas will have pain in 80% of cases.20 In addition to this, low-grade chondrosarcomas are usually bigger (greater than 4 cm in size) and more common in the long bones. It is much harder to differentiate between the two entities when the lesion is in the axial skeleton than when in the hand.22
The management of an asymptomatic enchondroma consists of observation every 3–6 months initially, followed by yearly evaluations. Enchondromas are benign and do not metastasize. If the lesion is (or becomes) symptomatic, treatment options include physical therapy, pain medications, and intralesional excision. Recurrence is very rare after excision. Worrisome symptoms include rest pain and night pain. If these occur or there is growth in size of the lesion, a biopsy should be performed.20
Differential diagnosis: Low-grade chondrosarcoma, bone infarcts.
PEARLS
![]() Can occur at any age, but most common in 10–20 years old age group.
Can occur at any age, but most common in 10–20 years old age group.
![]() Has calcified chondroid matrix on radiograph except when occurring in the hand, in which case they can be lucent.
Has calcified chondroid matrix on radiograph except when occurring in the hand, in which case they can be lucent.
![]() Most common bone neoplasm of the hand.
Most common bone neoplasm of the hand.
![]() Pain, endosteal scalloping, and cortical disruption should raise the suspicion of chondrosarcoma and require further workup.
Pain, endosteal scalloping, and cortical disruption should raise the suspicion of chondrosarcoma and require further workup.
![]() Multiple enchondromas are seen in Ollier and Maffucci syndromes.
Multiple enchondromas are seen in Ollier and Maffucci syndromes.
Enchondromatosis
This is defined as a patient with multiple enchondromas. Before discussing the types of enchondromatosis, an important point to emphasize is that malignant transformation occurs in roughly 25–30% of enchondromatosis cases. Enchondromatosis is a disease of childhood, and unfortunately deformities and malignant progression often leads to multiple surgical interventions.9 The most common subtypes of enchondromatosis are Ollier disease and Maffucci syndrome, with the other forms being so rare (metachondromatosis, genochondromatosis, spondyloenchondroplasia, etc.) that they are outside the scope of this chapter.
Ollier disease is the most common subtype (prevalence of 1 in 100,000), has an asymmetric distribution, can involve the entire skeleton, and is not hereditary21 (Figure 7-30). Malignant transformation to chondrosarcoma has been estimated at 5–50%, and more commonly occurs in the long and flat bones than in the hands and feet.9
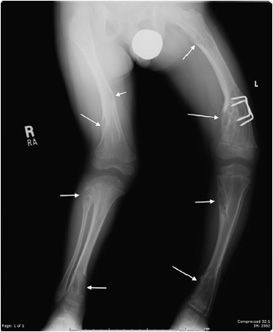
Figure 7-30. Multiple enchondromatosis (Ollier disease). Multiple enchondromas in bilateral lower extremities (arrows) having the “organ pipe” appearance are causing deformity in a patient with Ollier disease.
Maffucci syndrome is defined as multiple enchondromas associated with hemangiomas of the soft tissue, which usually present before puberty. Like Ollier disease, the enchondromas can undergo malignant transformation to chondrosarcoma. Maffucci syndrome has been associated with other tumors such as astrocytomas, pituitary adenomas, and pancreatic adenocarcinomas.9
Chondroblastoma
This rare cartilaginous tumor of the epiphysis, originally called “calcifying giant cell tumor” or Codman tumor, accounts for less than 1% of all bone tumors.19,23 It usually occurs before epiphyseal closure with an 80% occurrence in patients between 5 and 25 years of age (most frequently in the second decade of life). The lesion is more common in males, and dull pain of the joint is a common presenting symptom. The most common sites involved are the femur, proximal humerus, and proximal tibia.23 Radiographically, they are lytic, occasionally expansile, oval or round, and well demarcated with a sclerotic rim (Figure 7-31). Chondroblastomas can have either a central or eccentric location, but eccentric lesions are more common. Periosteal reaction may occur in the host bone, and punctate or irregular calcifications representing calcified cartilaginous areas are found in over 50% of the tumors. Chondroblastoma should always be in the differential diagnosis for a well-defined lytic lesion in the epiphysis or apophysis of a patient under the age of 30. Though benign, chondroblastomas can show aggressive features on MRI such as surrounding bone marrow edema (Figure 7-32) and soft tissue signal abnormalities.23 Malignant transformation is exceedingly rare, but when it does occur the lungs are the most common metastatic sites. Treatment is with curettage and bone grafting. Unfortunately, this usually leads to problems in the adjacent joint and growth disturbances of the affected bone because the epiphysis is involved. Local recurrence has been reported in 5–10% of cases, likely from incomplete excision during curettage.19
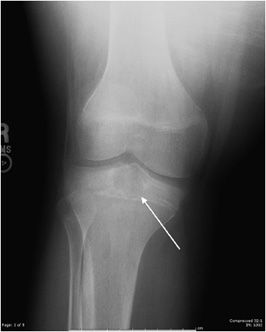
Figure 7-31. Chondroblastoma. Frontal radiograph of the knee shows a distinct lucency in the proximal epiphysis of the tibia with narrow zone of transition (arrow).
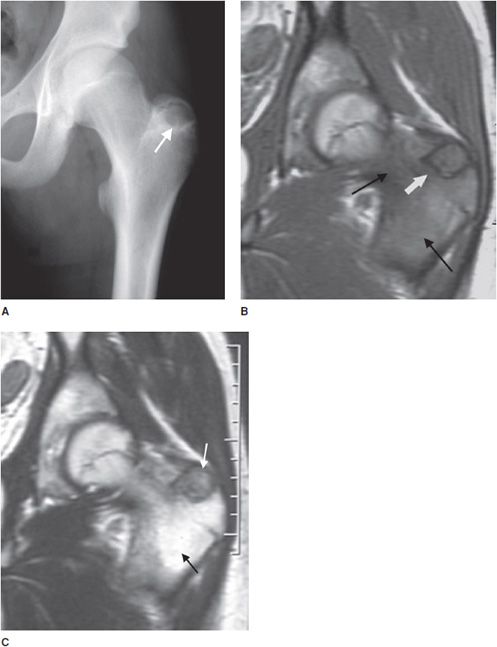
Figure 7-32. Chondroblastoma. (A) Frontal radiograph of the femur shows a lucent lesion in the greater trochanter (arrow) with sclerotic border. Coronal T1-weighted (B) and T2-weighted (C) MRIs of left femur show the same apophyseal lesion (white arrow) in greater trochanter with surrounding edema (black arrow). (Reproduced from Ling S, Reinus W. Chondroblastoma of the greater trochanter. In: Musculoskeletal Imaging Cases, Tehranzadeh J, ed. New York, NY: McGraw-Hill; 2009:398-399.)
Differential diagnosis: Giant cell tumor, eosinophilic granuloma, clear cell chondrosarcoma, osteomyelitis.
Related posts:
Stay updated, free articles. Join our Telegram channel

Full access? Get Clinical Tree


