17 On the Horizon: Tumor Genomics
17.1 Introduction
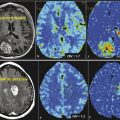
Imaging genomics is an emerging field that links specific imaging characteristics (also termed radiophenotypes or phenotypes) to the underlying genomic composition of tissues or tumors, such as glioblastoma multiforme (GBM) (Fig. 17.1). 1 , 2 Imaging features, specifically those shown on magnetic resonance imaging (MRI), have been shown to correlate with the underlying histopathological composition of tumors. 3 , 4 , 5 , 6 , 7 , 8 Specifically, imaging features have been shown to correlate with DNA/RNA-based and protein-based whole-genome data. 1 , 2 , 9 , 10 , 11 , 12 , 13 , 14 Conventional imaging features such as tumor location and border, signal intensity, and contrast enhancement as well as the advanced techniques of magnetic resonance perfusion (MRP) and diffusion-weighted imaging (DWI) are used in imaging genomics. 1 , 10 , 11 , 15 , 16 , 17 , 18 , 19 , 20 Several significant associations have been established for a variety of cancers, including liver cancer, 21 non–small cell lung cancer, 22 and glial cell tumors. 9 , 10 , 11 , 12 , 16
This chapter reviews the field to date with a focus on brain tumors. The growth in this field is largely due to advances in genomic sequencing technology from which large amounts of genomic data have been acquired after having been derived through surgical biopsies. First, the Human Genome Project, the largest collaborative biological project to date, introduced sequencing efforts to map the human genome. The advent of microarray technology enabled the analysis of thousands of genomics events simultaneously. More recently, the high demand for low-cost sequencing has driven the development of next-generation sequencing technology that enables high-throughput sequencing and processing of thousands to millions of sequences simultaneously. Such technological tools are enabling researchers in the field of imaging genomics to make large strides and advancements in this field.

17.2 Genomics in Glioma
17.2.1 Genomic Markers in Glioblastoma Multiforme
Genetics and genomics have different meanings; whereas genetics is the study of heredity and looks at the functioning and composition of single genes, genomics is the study of genes and looks at their combined network functions and their influence on growth and development. Genomics addresses all genes and their interrelationships, including large gene and signaling networks. Outside stimuli and the surrounding tumor microenvironment can cause changes in gene expression, microRNA (miRNA) levels, promoter methylation, and cellular phenotype, which is a collective phenomenon termed epigenetics. Epigenetic modifications provide cellular diversity and tumor heterogeneity, 23 , 24 , 25 , 26 and markers of these modifications can have diagnostic or prognostic value. O6-methylguanine-DNA methyl transferase (MGMT) promoter methylation and isocitrate dehydrogenase 1 (IDH1) mutation status have shown promise as prognostic and predictive genomic biomarkers. 27 , 28 Confirmed by multiple clinical trials, epigenetic-mediated gene silencing through MGMT promoter methylation is one of the most important prognostic factors for progression-free and overall survival and is an important predictive genomic biomarker for treatment response to alkylating agents such as temozolomide 27 , 29 , 30 ; consequently, the MGMT assay has become one of the most requested molecular assays in clinical neuro-oncology. 31 Similarly, IDH1 mutations, the most common mutation in secondary GBMs (seen in 50–88% of secondary GBMs), can differentiate primary from secondary GBMs and indicate a better prognosis in patients whose tumor harbors this mutation. 31 , 32 The diagnostic and prognostic value of IDH1 mutation status is likely to result in revisions to the current World Health Organization (WHO) classification scheme for GBM. 31
Important underlying cancer-related genetics are miRNAs, small, noncoding RNA molecules that function as negative gene regulators and potent silencers of gene expression via transcriptional and posttranslational modification on target genes. 33 A single miRNA may regulate more than 100 messenger RNAs (mRNAs) and, as such, miRNAs are crucial regulators of cell proliferation and differentiation and significant players in the maintenance of glioma stem cells. 34 The most commonly upregulated and comprehensively studied miRNA in GBM is miRNA-21, a major oncogenic miRNA that targets tumor suppressor pathways in GBM and is involved in glioma invasion, apoptosis, and migration. 35 , 36
17.2.2 Genomic Classification of GBM
Initial studies identified two clinically, defined subtypes and, more recently, molecular-genetic defined subtypes of GBM: primary and secondary. 37 , 38 These subtypes are typically seen in patients of different ages and have distinct genomic profiles with differential gene transcription patterns. 39 , 40 Primary GBMs, also termed de novo, are defined as tumors that present without a prior history or histopathological evidence of a lower-grade astrocytoma. Secondary GBMs are defined as those that arose by malignant transformation of a lower-grade astrocytoma. 37 , 41 Approximately 95% of GBMs are primary GBMs; these are typically seen in older patients (age > 50 years), 37 and are genomically characterized by a higher incidence of epidermal growth factor receptor (EGFR) gene amplifications/mutations and a low incidence of tumor protein 53 (TP53) mutations. 42 Secondary GBM accounts for only 5% of all GBMs; these are found predominantly in younger patients (age < 50 years), 32 , 37 and are genomically characterized by frequent TP53 mutations and infrequently by EGFR amplification/mutations. 42 Recent studies found IDH1 and IDH1 mutation status to be the most accurate predictors of secondary GBM, because patients whose tumors harbored the IDH1 mutation have longer overall survival (31 vs. 15 months) 28 , 32 , 43 and better response to temozolomide. 44
The development of The Cancer Genome Atlas (TCGA) advanced the understanding of the genomic basis of cancer. A national network of research and technology teams, the TCGA began in 2006 to characterize more than 20 tumor types and has generated a comprehensive, large-scale, multidimensional analysis of the cancer genome. The first cancer studied out of this work was GBM. 38 The resultant genomic characterization of GBM provides insight into differential genomic profiles and molecular heterogeneity in a single tumor (intratumoral heterogeneity) and among different individuals with the “same” histologically defined tumor (interindividual heterogeneity). 39 , 40 This heterogeneity is now well recognized and has led to the recognition of the individuality of genomic signatures, which has since affected drug development and drug target discovery strategies.
Leveraging the comprehensive genomic, clinical, and survival data afforded by TCGA, Verhaak et al 40 classified GBMs into four molecular subtypes by using integrated multidimensional genomic data and genomic aberrations to establish patterns of somatic mutations and DNA copy numbers. The classical subtype harbored the genomic aberrations most common to GBM; these tumors demonstrate EGFR and chromosome 7 amplifications and cyclin-dependent kinase inhibitor 2A (CDKN2A) locus and chromosome 10 deletions. The mesenchymal subtype showed a high frequency of neurofibromin 1 (NF1) mutations/deletions and high expression levels of chitinase-3-like protein 1 (CHI3L1) and MET proto-oncogene. The proneural subtype had characteristics similar to secondary GBM, such as occurrence in younger patients, platelet- derived growth factor receptor alpha (PDGFRA), and IDH1 and TP53 mutations. The neural subtype was strongly associated with neural, oligodendrocytic, and astrocytic gene signatures. Likewise, Phillips et al 45 divided high-grade glioma into three subtypes: proneural, proliferative, and mesenchymal; these subtypes demonstrated significant prognostic value independent of the WHO tumor grade and/or the presence of necrosis. Phillips et al also found that PDGFRA amplification correlated with higher-grade glioma. Molecular analysis of low-grade glioma (LGG) is under way, and we anticipate that the data will provide similar molecular subclassification of LGGs.
17.3 Imaging Genomics in Glioblastoma and Other Gliomas
Of the gliomas, GBM has been the one most studied in great detail and its molecular networks and subtypes based on MRI have been reported. 1 Initially conducted studies correlating radiophenotypical features to genomic data of brain tumors involved associations of imaging to single genetic characteristics such as the codeletion of 1p and 19q, 46 TP53 overexpression, 47 EGFR amplification, 9 and MGMT promoter methylation in gliomas. 48 These have been followed by studies that identify hundreds and thousands of genes that correlate to a particular imaging phenotype. 11 , 16 In recent years, a small number of studies that apply advanced MRI techniques of MRP, DWI, and MR spectroscopy (MRS) have been published. 10
17.3.1 Imaging Genomics in GBM
Qualitative Imaging Genomic Correlative Analyses
Most of the early research in imaging genomics correlated genotypes to qualitative conventional MRI tumor characteristics (phenotypes or radiophenotypes), such as contrast enhancement and tumor border integrity. 9 , 49 Diehn et al 9 found that EGFR overexpression was associated with a high ratio of contrast enhancement to necrosis within the same tumor. Aghi et al 49 demonstrated that EGFR-overexpressing (primary) GBMs, compared with TP53-mutated (secondary) GBMs and GBMs without TP53 mutations or EGFR overexpression, had a higher ratio of T2-bright volume to enclosed T1-enhancing volume, possibly due to angiogenesis and edema caused by high levels of vascular endothelial growth factor (VEGF). Aghi et al 49 also found that EGFR-overexpressing GBMs had lower T2 border sharpness coefficients than tumors that did not overexpress EGFR, resulting in fuzzy borders that suggested a high degree of tumor invasion; EGFR amplification has also been found to be correlated with resistance to radiation therapy, 50 and Schlegel et al 51 reported that older patients with GBM whose tumors did not have TP53 mutations had an increase in overall survival compared with patients whose tumors had TP53 mutations. Mut et al 47 looked exclusively at imaging characteristics related to TP53 expression in GBM and found that tumors with low TP53 expression (< 50% as shown by immunohistochemical staining) demonstrated heterogeneous enhancement and ill-defined borders on postcontrast T1-weighted images, whereas those with higher TP53 expression demonstrated well-defined borders and ring enhancement pattern on postcontrast T1-weighted images; the latter also had more favorable prognoses and longer overall survival times. Mut et al 47 found no relationship between TP53 expression and location and number of lesions, size of the enhancing lesion and perilesional edema, mass effect, and tumor necrosis. However, our group recently demonstrated, via transcription factor analysis, that TP53 was associated with high necrosis volumes in male patients with GBM. 52 Relatedly, IDH1 mutation is most commonly seen in GBMs located in the frontal lobe. 53 However, some studies have found no significant correlation between genotype and tumor location. 54 , 55 , 56
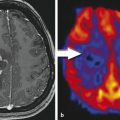
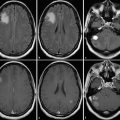
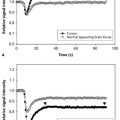
MGMT promoter methylation status has also been shown to correlate with imaging features; Drabycz et al 57 found that ring enhancement was significantly associated with unmethylated MGMT promoter status, 57 and another study found that ill-defined borders were more common in the MGMT promoter methylated tumors. 58 Eoli et al 48 found that unmethylated MGMT promoter status in GBM was associated with 17p and TP53 mutations, and that these tumors are predominantly ring enhancing with necrosis, and were usually located in the temporal lobe. By contrast, GBMs with methylated MGMT promoter status demonstrated more homogeneous enhancement, were found mostly in the frontal lobe, and were associated with prolonged overall survival. Methylated MGMT promoter status and TP53 expression were also correlated with survival differences in the volume-age-KPS (VAK) classification system proposed by Zinn et al, 15 in which tumors were categorized based on the total volume of tumor on preoperative MRI, the patient’s age, and the patient’s Karnofsky performance scale score (Fig. 17.2). Low T1-enhancing tumor volume (< 30,000 mm3 or < 40 mm in diameter) was significantly associated with TP53 activation (Fig. 17.3).
Diehn et al 9 found that the expression of genes implicated in hypoxia and angiogenesis was associated with contrast enhancement; and the expression of genes involved in proliferation and cell cycle was associated with mass effect. Pope et al 11 found the overexpression of interleukin-8 and VEGF to be associated with complete enhancement rather than incomplete enhancement in GBMs. Using GBM samples obtained by image-guided stereotactic biopsies, Van Meter et al 14 revealed differences between the expression of 623 genes between samples obtained from the enhancing core and those obtained from the periphery of tumors. The genes associated with the enhancing tumor core included VEGF, platelet derived growth factor (PDGF), matrix metalloproteinase 1 (MMP-1), and genes involved in signaling pathways displaying characteristics favoring tumor aggression, cell migration, angiogenesis, cell adhesion, tumor proliferation, cell–cell communication, and cell motility. Genes associated with the enhancing periphery of the tumor were involved in central nervous system development and cell expansion such as EGFR and the v-akt murine thymoma viral oncogene homologue 1 (ATK-1) mRNA.


Related posts:
Stay updated, free articles. Join our Telegram channel

Full access? Get Clinical Tree


