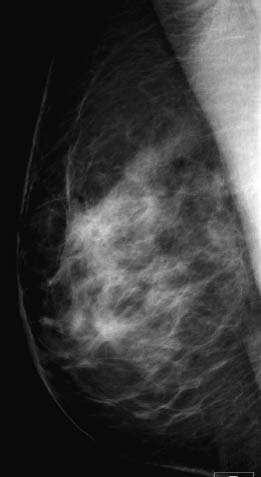
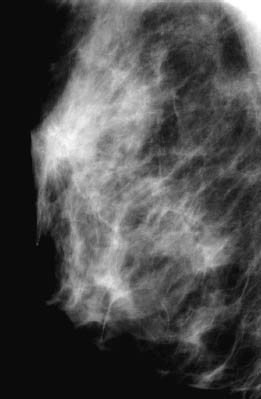
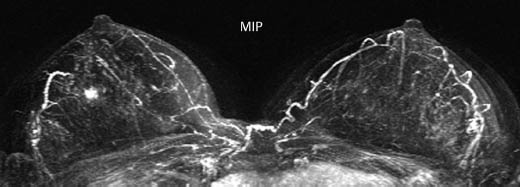
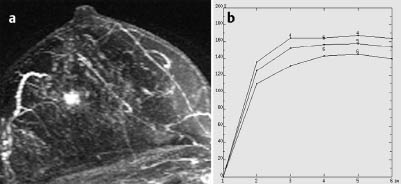
Case 19 Indication: Check-up after vacuum biopsy. History: Vacuum core biopsy 6 months previously. Risk profile: No increased risk. Age: 49 years. Fig. 19.1 Mammography, MLO view, before vacuum biopsy. Fig. 19.2 Magnification view (MLO), before vacuum biopsy. Normal. Fig. 19.3 Ultrasound of the previous biopsy region. Fig. 19.4 Digital mammography, CC view, six months after biopsy. Fig. 19.5 Digital mammography, MLO view, six months after biopsy. Fig. 19.6a -c Contrast-enhanced MR mammography six months after biopsy. Fig. 19.7 Contrast-enhanced MR mammography. Maximum intensity projection. Fig. 19.8a,b Signal-to-time curves. Please characterize ultrasound, mammography and MRI. What is your preliminary diagnosis? What are your next steps? Ultrasound demonstrated an ill-defined hypoechoic lesion 5 mm in diameter between the upper quadrants of the right breast, with an indeterminate distal echo pattern. US BI-RADS right 3. Mammograms showed fibroglandular parenchyma, ACR type 2. In comparison with the pre-biopsy imaging (Fig. 19.1), an ill-defined hyperdensity in the upper outer quadrant of the right breast showed an increase in diameter. No microcalcifications were visualized. BI-RADS right 4. PGMI not defined for one-sided mammography. MRI showed an ill-defined, spiculated, homogeneously enhancing lesion (diameter 1 cm) between the upper quadrants of the right breast, with initial signal increase of 125% and a postinitial plateau. There was a decreased signal in T2-weighted imaging. No findings in the left breast. MRI Artifact Category: 2 MRI Density Type: 2
Clinical Findings
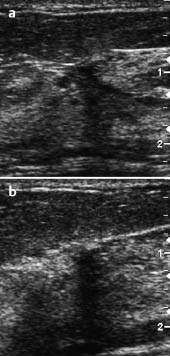

Ultrasound (6 months after VB)
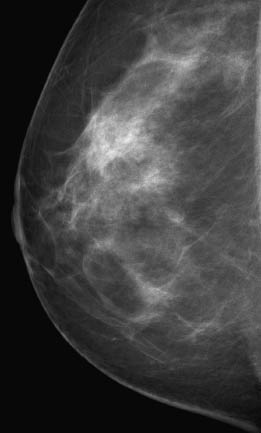
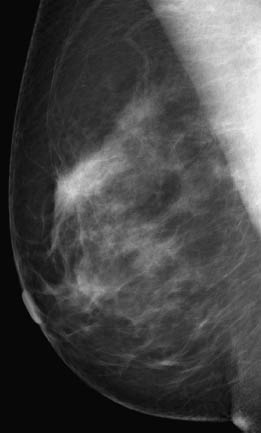
Mammography (6 months after VB, Figs. 19.4 and 19.5)
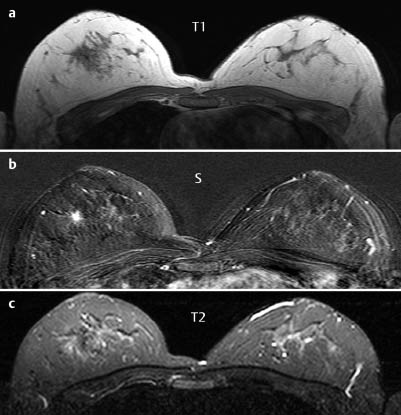
MR Mammography (6 months after VB)
MRM score | Finding | Points |
Shape | spiculated | 1 |
Border | ill-defined | 1 |
CM Distribution | inhomogeneous | 0 |
Initial Signal Intensity Increase | strong | 2 |
Post-initial Signal Intensity Character | plateau | 1 |
MRI score (points) |
| 5 |
MRI BI-RADS |
| 4 |
 Preliminary Diagnosis
Carcinoma; scarring from vacuum biopsy with atypical enhancement; focal mastitis following intervention.
Clinical Findings | right 1 | left 1 |
Ultrasound | right 3 | left 1 |
Mammography | right 4 | left 1 |
MR Mammography | right 4 | left 1 |
BI-RADS Total | right 4 | left 1 |
Procedure
Open biopsy following hook-wire localization.
Preoperative hook-wire localization and specimen radiography.
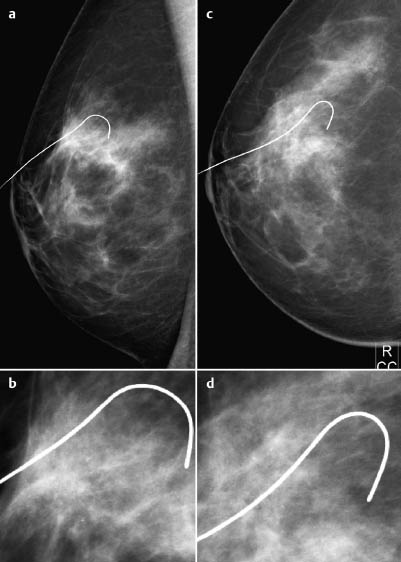
Fig. 19.9a-d Localization in two planes with magnification views.
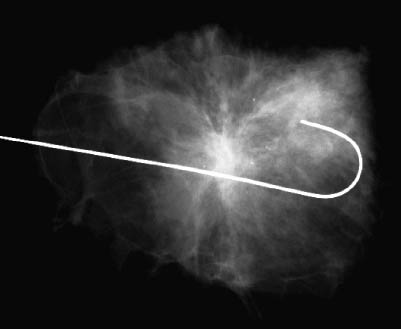
Fig. 19.10 Specimen radiography.
Histology
Scar tissue (from vacuum biopsy) with focal mastitis.

Stay updated, free articles. Join our Telegram channel

Full access? Get Clinical Tree


