19 On the Horizon: Molecular Imaging
19.1 Introduction
The majority of brain tumors are metastatic and half of them are from lung cancers. The most common primary brain tumors are gliomas, meningiomas, pituitary adenomas, and nerve sheath tumors. Gliomas make up more than 50% of all primary brain tumors and are ased on the cellular types, genetic makeup, and aggressiveness; gliomas are divided into different classification and grades. Among them glioblastoma multiforme (GBM) is considered a more aggressive and devastating tumor, which is hypervascular, heterogeneous, highly infiltrative in nature. The current treatments, including surgical resection, radiotherapy, and chemotherapy, do not increase the post treatment survival to an acceptable level. Although the overall incidence of GBM is much lower compared to that of other cancers, such as breast, cervical, and lung, its poor prognosis makes GBM one of the most challenging cancers for the scientific community. Clinicians and basic scientists are seeking the cause of treatment failure and recurrence of GBM. Mechanisms of resistance are being studied at genetic and molecular levels. However, to understand the changes at molecular and genetic levels requires in vivo techniques that can predict the changes that may cause resistance to the applied treatments. The current in vivo imaging modalities that are being extensively used in the clinical setting are not deciphering the problem that may arise at the initial stages of resistance/tolerance to treatment. Current U.S. Food and Drug Administration (FDA)-approved imaging modalities and techniques cannot predict the effect or failure of applied treatments until it is too late. Investigators, including us, are trying to determine the targets to predict the development of resistance and tolerance to applied treatments which can be detected by in vivo imaging. The targets could be molecular markers, receptors, protein–protein interactions, events of neovascularization, epigenetic of neovascularization or drug resistance, accumulation of progenitor and immunogenic cells, cancer stem cells, and so on. FDA-approved or preclinical imaging modalities can be used to understand the mechanisms of resistance and recurrence and of early prediction of treatment failure. To understand the molecular mechanisms in GBM recurrence, molecular imaging techniques are gaining popularity in both clinical and preclinical studies. For successful implementation of molecular imaging techniques, involvement of chemists is essential to make contrast agents for different imaging modalities and to make agents that target receptor/ligands. This chapter discusses the current development and use of different molecular contrast agents as well as the use of cells as imaging probes.
19.2 What Is Molecular Imaging?
The broad definition of molecular imaging should include both in vivo and in vitro imaging techniques to understand the molecular mechanisms or processes of intra- and extracellular functions (e.g., signaling, protein–protein interaction, gene and protein expression, receptor–ligands interaction, cellular metabolism, etc.), mechanisms of tissue damage, oxygen or pH status of any tissues, development of tumor, interaction of tumor with surrounding tissues, mechanisms of neovascularization, and the interaction of endothelial cells with tumor cells and others. Unlike traditional imaging techniques, molecular imaging uses probes or biomarkers to target specific pathways or mechanisms for the area of interests. Many in vitro and in vivo imaging modalities have been developed for molecular imaging. FDA-approved clinically relevant imaging modalities such as magnetic resonance imaging (MRI), single photon emission computed tomography (SPECT), positron-emission tomography (PET), and even optical imaging are being used as imaging modalities for understanding the molecular events in cancer and in other diseases.
19.3 Why Molecular Imaging for Glioma?
Traditionally GBMs (or high-grade gliomas) are treated with surgery, radiotherapy, and adjuvant chemotherapy. At present, neither the surgeon and nor the radiation oncologist relies on the molecular mechanisms or genetic aberration in primary or recurrent GBM. However, in regard to chemotherapy and adjuvant therapy, medical oncologists are focusing more on the possible molecular characteristics of GBM or the presence of any genetic aberration to counter the primary or recurrent GBM by adjusting possible appropriate adjuvant therapy. 1 , 2 , 3 , 4 At present, in the clinical setting, these changes are determined from a biopsy or explanted tumor samples. Newer blood tests to find out relevant micro-RNA or released cytokines/growth factors are far from clinical use. Therefore molecular imaging could allow oncologists to change treatment strategies, when necessary, based on imaging findings in respect to resistance to applied treatments and/or development of newer genetic aberration in the recurrent GBM. All clinically approved imaging modalities, such as MRI, SPECT, and PET, are being used to determine the characteristics of tumor tissues/cells, as well as different molecular mechanisms involved in the primary and recurrent GBM. However, when the question of understanding the basic molecular mechanisms arises, both SPECT and PET have advantages over MRI. There are many clinically approved radiopharmaceuticals available to determine the early recurrence of GBM by nuclear medicine techniques, such as SPECT or PET, by exploiting the enhanced use of amino acids (e.g., tyrosine, methionine) by tumors, use of glucose by tumors, DNA repair and multiplication, protein–protein interaction, expression of different receptors on tumor cells, and its associated vascularity. Different clinical and preclinical imaging modalities and probes can be used to understand the strength of molecular imaging and its future use in patient management.
19.4 MRI for Molecular Imaging of Primary and Recurrent Glioma
MRI is a very versatile imaging modality. Understanding tissue characteristics by using different image sequences itself can be regarded as molecular imaging. For example, creating T1 and T2 relaxation maps can determine the endogenous magnetic properties of tissues, which can be used to differentiate between normal and abnormal structures in the brain. Diffusion-weighted imaging (DWI) can differentiate high-grade from low-grade and treated from nontreated tumor by determining water movement. 5 , 6 , 7 Clinically applicable sequences as well as sequences under development can be used in clinical and preclinical settings to understand the molecular mechanism involved in primary GBM, along with the effects of treatment and the changes in molecules in recurrent glioma with or without the administration of specific molecular probes. A detailed description and usage of various clinically relevant sequences are not the scope of this chapter; Chapters 4, 5, 6, and 7 earlier in the book describe different sequences and techniques. This chapter provides a brief description of the sequences not discussed elsewhere in the book.
19.4.1 MRI in the Clinical Setting
Proton Density
Proton density (spin density)-weighted images are produced by selecting the scan parameters to minimize the effects of T1 and T2 relaxation, resulting in an image dependent primarily on the proton per unit volume of tissue being imaged. Proton density contrast gives a quantitative summary of the number of protons per unit tissue. The higher the number of protons in a given tissue, the greater the transverse component of magnetization, and the brighter the signal on the proton density contrast image. Conversely the lower the number of protons in a given tissue, the lower the transverse magnetization and the darker the signal on the proton density image. Proton density images are useful for distinguishing tumor and edema from adjacent cerebrospinal fluid (CSF), which may appear similar to high-signal areas on heavily T2-weighted images. Proton density MRI has been used to study treatment response in GBM patients following adjuvant antiangiogenic treatment. 8 The amount of signal change was predictive of long-term progression free survival and overall survival in GBM patients after bevacizumab treatment. 8
Electrolytes (Na+)
Sodium MRI (23Na MRI) is increasingly becoming an attractive potential marker for predicting therapeutic response after anticancer treatment. The high rate of mitotic activity in the tumors is preceded by the sustained depolarization of the cell membrane. 9 This leads to an increase in intracellular sodium concentration inside the tumor cell lines, including glial cells. 10 , 11 , 12 Changes in the total sodium concentration are known to be a good indicator of oncological treatment effect, including cell lysis. 13 This increase in total sodium concentration is readily measurable using ultrashort echo time sodium MRI. Unlike many other imaging modalities, the change in sodium concentration is limited by blood–brain barrier (BBB) changes. It has been evaluated to assess treatment response of GBM tumors in patients. 13 This technique seems to provide valuable information on tumor progression and response, especially when combined with a PET scan. 13
Peptides
MR spectroscopic and proteomic studies have shown that human brain tumors have a greater macromolecular protein concentration, compared to the normal brain, and the concentration increases with tumor grade. 14 Amide protein transfer (APT) imaging is a novel MRI technique based on amide proton signals from endogenous cellular proteins and peptides. One of the biggest advantages of APT MRI is that it does not require administration of an exogenous contrast agent. APT imaging has been used in preclinical models to reliably distinguish between brain tumor recurrence and radiation necrosis. 15 It has been used for imaging patients with brain tumors, and APT contrast has shown to be superior when compared to conventional MRI in distinguishing tumor tissue from peritumoral edema. 16 Clinical studies have also revealed the potential use of APT imaging in noninvasive diagnosis of the tumor grade. 17 Another potential clinical utility of APT imaging is the noninvasive identification of heterogeneity in high-grade brain tumors. 18 This could potentially be useful in the planning of a surgical resection and radiation therapy of heterogeneous tumors like GBM.
USPIO-Based Contrast
Magnetic nanoparticles have the potential to be used as contrast agents in MRI because they possess unique magnetic properties, along with the ability to function at the cellular level of biological interactions. Intravenous administration of ferumoxtran, an ultra-small paramagnetic iron oxide particle, has been shown to produce enhancement that is comparable to that of gadolinium in malignant brain tumors. 19 Neuwelt et al compared the ferumoxtran imaging with gadolinium enhancement in a series of seven patients. 20 They observed that the ferumoxtran-enhancing lesions could be well detected even with a low Tesla magnet (0.15 T). Ferumoxtran was also able to detect areas of tumors that did not enhance with gadolinium. The ferumoxtran signal was detectable 2 to 5 days after administration. 20 The mechanism for additional and persistent MR signal change of iron oxide particles is due to the long plasma half -life and intracellular trapping by reactive cells (astrocytes, macrophages), rather than tumor cells in and around the tumor. Thus magnetic nanoparticles seem to be an attractive contrast agent to be used during intraoperative resection and postoperative follow up in patients with malignant brain tumors. Unfortunately ferumoxtran did not receive full FDA approval. However, another iron-oxide based nanoparticle “ferumoxytol” has been approved for clinical use in patients with end stage renal failure. 21 Dr. Neuwelt’s group at the Oregon Health and Science University is recruiting patients to use ferumoxytol to assess the early response in patients with GBM by way of MRI. Studies from this group have shown that cerebral blood volume measurements using dynamic perfusion MRI with ferumoxytol USPIO, is promising for more accurate detection of therapeutic responses to antiangiogenic therapy. 22
19.4.2 Preclinical Setting
Metabolites
MR spectroscopic imaging has already been established for clinical use to determine different metabolites in GBM before and after treatments. Hyperpolarized 13C MR metabolic imaging is gaining momentum to determine metabolic status in tumors. Hyperpolarized 13C MR metabolic imaging can be used to determine different metabolites, including pyruvate, acetate, succinate, fumarate, choline, and fructose in glioma and other tumors. 23 , 24 , 25 , 26 , 27 , 28 A disadvantage of hyperpolarized 13C MR technique is that a special setup (hardware) is needed, and the full benefit of this technique in the clinical setting has yet to be finalized.
Gene Expression
Detection of the expression of an endogenous gene in a glioma has yet to be detected by MRI. However, to understand the kinetics of tumor growth, investigators have transduced glioma cells with genes that can accumulate administered contrast agents or iron. 29 , 30 , 31 Weissleder et al first showed that engineered transferrin receptor-transduced tumor cells can accumulate iron, which makes the implanted cell easy to observe under in vivo MRI. 32 Investigators also used the ferritin gene for uptake of endogenous iron by the transduced cells so that it could be detected by in vivo MRI. A cell with a reporter gene is used to determine tumor invasion and migration kinetics before and after treatment; however, the technique has not produced a practical solution for the study of tumor kinetics. There are many obstacles with this approach: (1) 100% of the cells should be transduced and should remain transduced following multiple divisions, (2) the expression of a reporter gene or genes of interest that are sufficient enough to cause detectable MR signals (e.g., accumulation of iron by ferritin), and (3) a transduced gene should not alter the function of the cells. Investigations with iron-labeled stem cells showed slower migration 33 ; therefore, iron accumulation in glioma cells may alter the migratory and invasive capacity of implanted glioma.
CEST and PARACEST MRI
During the last decade, MRI contrast agents have been developed that can be selectively detected through chemical exchange saturation transfer (CEST). 11 These contrast agents contain protons that undergo chemical exchange with protons of surrounding water molecules, such as protons in amine or amide groups in the covalent structure of the agent, or protons in water molecules that are noncovalently bound to the contrast agent. 34 , 35 The narrow band of radiofrequencies that are applied at the chemical shift of the exchangeable proton of the CEST agent can selectively saturate the MR signal of the proton, causing the MR signal to be eliminated. Subsequent chemical exchange of the saturated proton on the CEST agent with a proton on a water molecule transfers the saturation to the water, which reduces the total detectable MR signal of water. This approach was first demonstrated by Balaban et al using low molecular weight diamagnetic molecules containing exchangeable -OH or -NH groups. 11 They showed that the MR contrast can be turned on/off by applying a saturating irradiation pulse, and since chemical exchange between such groups and bulk water is pH dependent, such systems can potentially be used to image tissue pH. Although some diamagnetic CEST (DIACEST) agents have chemical shifts as large as 6.33 ppm, most DIACEST agents have chemical shifts of 1 to 4 ppm, which limits the design of CEST agents to slowly exchanging amide, amine, imine, guanidinium, indole, pyrimidine, imidazole, and alcoholic chemical groups. 36 Paramagnetic CEST (PARACEST) agents contain lanthanide ions that increase the chemical shifts of amide, amine, and alcoholic groups of up to about ± 50 ppm, which allows PARACEST agents to be designed with chemical groups that have much faster chemical exchange rates. 34 , 37 In addition, PARACEST agents can be designed to noncovalently bind to a water molecule with sufficient strength, so that the water molecule exchanges with surrounding water at a rate that is slow enough to generate a CEST effect. 35 The proximity to the lanthanide ion can cause the bound water to resonate at CEST-detectable chemical shifts as large as 580 ppm, which further expands the chemical design of CEST agents. 38 Therefore, a wide variety of CEST agents can be designed with many types of labile protons at different chemical shifts, which may be selectively detected during the same MRI study.
Endogenous CEST for Glioma Detection
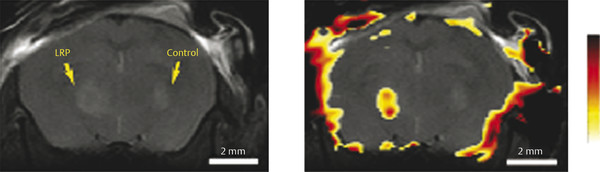
Glioma cells have been labeled with iron oxide of various types to sufficiently alter T2 without overt loss of biological function.39,40,41 However, these contrast effects tend to fade with time because of cell leakage or cell division. Gilad and coworkers reported an alternative approach to overcome these problems by transfecting glioma cells to produce a lysine-rich protein (LRP) that can then be detected by CEST imaging. 42 Amide protons from LRP have a chemical shift of 3.76 ppm. Selective saturation within this chemical shift range initiate to generate a CEST effect. 43 Genetically transfected glioma cells, implanted into a mouse brain, were easily differentiated from control cells by CEST imaging by applying a selective presaturation pulse at the resonant frequency of the LRP amide resonance (Fig. 19.1). The images show CEST contrast only in the region where the engineered cells had been implanted, demonstrating that unique CEST activation systems such as this may be useful for cell tracking. Because the LRP is produced by the genetic machinery of the cell, its concentration should, in principle, be maintained even after many cell divisions. Furthermore, different cells could be encoded to produce different markers for CEST that require different activation frequencies. This would allow two, or more, types of cells to be tracked simultaneously by applying an appropriate frequency-selective presaturation pulse to follow the cells of interest. This example demonstrates one of the main advantages of CEST imaging—CEST contrast can be turned on selectively by simply adding a presaturation pulse to an imaging sequence. The apparent negative image contrast generated by CEST activation is not a drawback in this case because a control CEST image that uses a different activation frequency (typically at an equal frequency offset on the opposite side of the water frequency) must be gathered so that the difference image can be displayed as a positive image, a negative image, or a colorized image. 44 This makes it difficult to selectively activate the CEST agent in tissues where the bulk water signal can be rather broad. Nevertheless, Gilad et al have shown that CEST can be amplified by using exogenous macromolecules with large numbers of exchanging sites or endogenous proteins or peptides. 42 This technique can be translated to clinical use if sufficient knowledge is available to manipulate and use different proteins (that has CEST effect) in the tumors before and after treatments.
PARACEST Agent
PARACEST-based MRI contrast agents have advantages relative to T1- or T2-relaxivity MRI contrast agents. For many years, a major criticism of PARACEST MRI methods has been the apparent inability to apply PARACEST agents to in vivo animal models, which would appear to obviate clinical translation of these methods. Therefore, it is essential to develop in vivo studies using novel PARACEST imaging probes.
To improve in vivo detection sensitivity, PARACEST agents have been conjugated to nanocarriers such as dendrimers, linear polymers, and other high molecular weight macromolecules such as adenovirus particles. 45 , 46 , 47 For example, Eu-DOTA-Gly4 PARACEST agents have been conjugated to a G5PAMAM dendrimer via the 1-ethyl-3-(3-dimethylaminopropyl) carbodiimide hydrochloride/N-hydroxysuccinimidyl (EDC/NHS) coupling method. Matrix-assisted laser desorpted ionization (MALDI) mass spectrometry analysis of the DOTA-Gly-conjugated G5PAMAM dendrimer indicated that a range of 34 to 51 ligands were covalently attached to the surface of a G5-PAMAM dendrimer, with a weighted average of approximately 41 ligands per dendrimer. 48 Eu-G5-DL680 showed a CEST peak at +55 ppm, which demonstrated that the presence of the fluorescent agent (DL680) on Eu-G5-DL680 did not affect the agent’s ability to generate CEST. 49 It has been reported that 1.62 and 1.43 mM Eu-DOTA-Gly and Yb-DOTA-Gly are required to achieve a 3% CEST effect in solution, which may limit in vivo application. 50 The solution study showed that 45 µM G5-Eu is required to generate 3% of the CEST effect. Therefore, coupling 41 PARACEST agents to the dendrimer resulted in a 36-fold improvement in sensitivity (on a per dendrimer basis), which shows that the CEST effect almost exactly scaled with the concentration of the agent on the dendrimer. 48
Detection of Glioma with PARACEST Agent
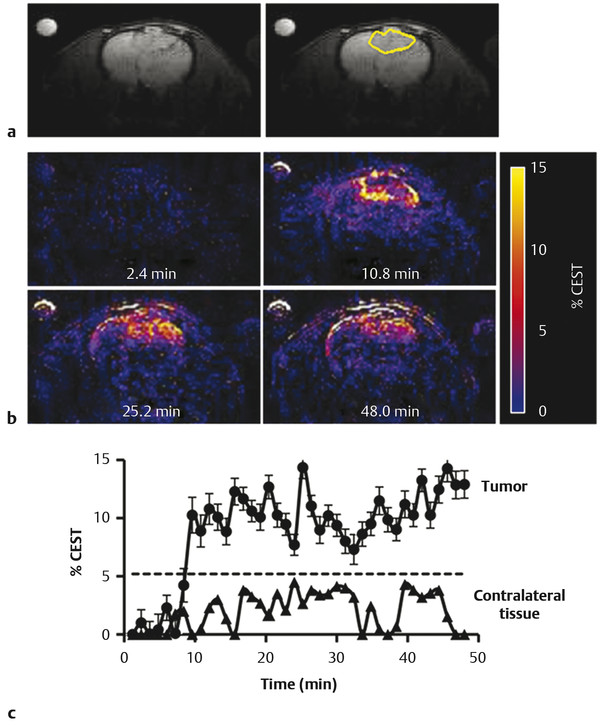
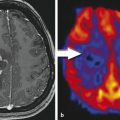
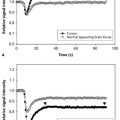
An anatomical magnetic resonance (MR) image showed the location of the U87 glioma (Fig. 19.2a). The CEST MR image contrast before and after the administration of the PARACEST agents was used to determine the dynamic change in % CEST during the study (Fig. 19.2b). Based on image noise, a CEST effect of 5.2% or higher had a 95% probability that the CEST effect was real. The MR images prior to injection showed no significant CEST effect, but this significance threshold was exceeded immediately after injection of the agent. A strong CEST effect was first visualized at the tumor rim at 2.8 minutes after the injection, which can be attributed to the hypervascular rim typically observed in malignant glioma tumors. 51 The CEST effect persisted during the remainder of the MRI study, which was attributed to the enhanced permeability and retention (EPR) effect that is typically observed with nano-sized agents in glioma tumors. 49 For comparison, the contralateral brain tissue did not show a statistically significant CEST effect throughout the MRI scan session. The temporal results shown in Fig. 19.3c demonstrate variability in the baseline measurement prior to the injection, which was attributed to pulse imperfections. This variability was greater after injection of the agent, which was attributed to motion artifacts (despite the use of a stereotactic holder) and pulse imperfections. This “noise” in Fig. 19.2c has been observed in similar in vivo CEST MRI studies. 48 , 50 , 52 , 53 This result indicated that CEST MRI could detect the presence of the dual modality contrast agent in the glioma, which detected the glioma with excellent specificity relative to normal brain tissue. This experimental approach required the acquisition of CEST MR images at only one saturation frequency, which simplified the acquisition method relative to approaches that require multiple saturation frequencies. This approach also accounted for static effects that influence the contrast of an MR image with selective saturation, including endogenous magnetization transfer, direct saturation of water, and B0 and B1 magnetic field inhomogeneities. However, the use of one saturation frequency cannot account for other dynamic changes caused by the agent. For example, macrocyclic Eu(III) chelates have recently been shown to have a significant T2ex (exchange of spin) rate that can cause dynamic darkening of the image. 54 Although Eu(III) chelates have very low T1 relaxivities, the high ratio of Eu(III) chelates per dendrimer may compensate for low T1 relaxivity and may possibly cause a change in image contrast. Yet the statistically significant and dynamic changes in image contrast after injection still ensure that the MRI method detected the agent.
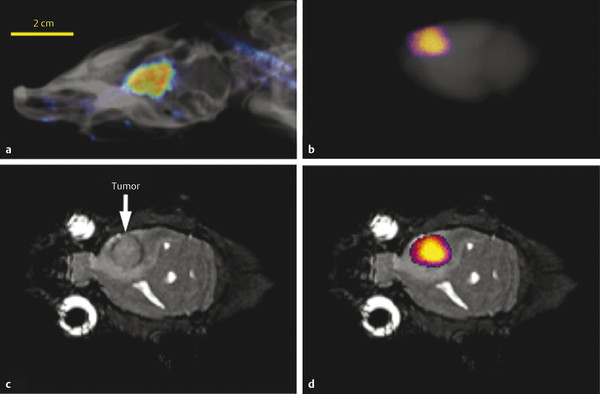
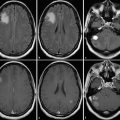
Macroscopic fluorescence imaging validated that the CEST MRI results were generated by accumulation of the dual-modality contrast agent in the glioma. 49 In vivo fluorescence imaging showed accumulation of the contrast agent in the brain (Fig. 19.3a). The comparison of ex vivo fluorescence imaging (Fig. 19.3b) and the anatomical MR image (Fig. 19.3b) further confirmed that the accumulation occurred in the glioma site (Fig. 19.3c). The ex vivo study may have also been accomplished by detecting the fluorescence from Eu(III) in the chelate. However, Eu(III) chelates typically have weak fluorescence, so that the in vivo study would have been difficult to accomplish based on Eu(III) fluorescence. 55 Therefore, we elected to use the Dylight 680 fluorophore (Thermo Fisher Scientific, Inc., Rockford, IL) for the in vivo and ex vivo studies for consistency. 49
19.5 Nuclear Medicine for Molecular Imaging of Primary and Recurrent Glioma
Nuclear medicine techniques have advantages over other in vivo imaging modalities in respect to matured radiochemistry techniques, availability of the wide range of clinically usable radioisotopes, availability of ligand chemistry to target the wide range of useful receptors in tumor cells or cells associated with neovasculatures, and cellular metabolisms. Other advantages of nuclear medicine would be the possibility of treatment using established ligand-receptor reaction by tagging it with Beta-emitters of usable radioisotopes. The list of useful radiopharmaceuticals for targeting primary or recurrent glioma and its associated neovascularization can be found in the Molecular Imaging and Contrast Agent Database (MICAD) developed by the National Institutes of Health (NIH) (http://www-ncbi-nlm-nih-gov.easyaccess1.lib.cuhk.edu.hk/books/NBK22999/). Despite being strongly developed, radiochemistry, available useful radiopharmaceuticals, and nuclear medicine techniques are not being fully used in the detection of primary and recurrent GBM. The reason behind the suboptimal use might be due to the lack of anatomical demarcation on nuclear medicine images alone, the cost of radiopharmaceuticals and associated instruments, and tighter regulation for using radioisotopes.
19.5.1 SPECT Imaging
Single photon emission computed tomography (SPECT) using thallium 201 (201Tl), 99mTc-tetrofosmin, 99mTc-sestamibi, and 123I-iodo-a-methyl tyrosine (IMT) radiotracers has been used to evaluate the proliferation and treatment response of gliomas. 56 Studies have shown a linear correlation between tracer uptake during SPECT and tumor proliferation and aggressiveness. 57 SPECT has also been shown to reliably differentiate between tumor recurrence and radiation necrosis. 58 201Tl was one of the first tracers studied; it has the advantage of a relative absence of tracer uptake in normal brain parenchyma, providing a better contrast between tumor and normal brain tissue. 59 Uptake of 201TI depends on the cell membrane potential and Na+-K+-ATPase activity. It is thought that malignant cells and metabolically active cells will have more cell membrane potential and Na+-K+-ATPase activity compared to dying or nonmetabolically active cells. 60 , 61 , 62 Therefore, 201TI can distinguish the recurrent tumor from radiation necrosis. 63 , 64 Similarly, uptake of Tc-99-terofosmin or Tc-99m-MIBI depends on the mitochondrial potential of cells and involves the Na+-K+-ATPase, Na+/H+ antiport, and Na+-K+-Cl− cotransport system. 60 , 62 Malignant cells as well as myocardial cells are shown to have more mitochondria compared to surrounding normal cells. Tc-99m-MIBI is also helpful in understanding the chemotherapy resistance and presence of p-glycoprotein in malignant cells. 65 , 66 , 67 These three agents (201TI, Tc-99m-MIBI, and Tc-99m-tetrofosmin) predict the cell membrane potential, ion transport system, and molecular mechanisms of drug resistance by malignant cells.
Amino acid analogue 3-[(123)I]iodo-alpha-methyl-L-tyrosine (IMT) has been used in the clinical setting to diagnose recurrent glioma using SPECT studies. 68 , 69 , 70 Mechanisms of uptake of IMT have been determined and compared with those of 3H-methyl-L-methionine (3H-MET) in glioma cells. 71 3H-MET showed involvement of the Na+-dependent L amino acid transport system, whereas IMT uptake was independent of Na+ but involved the “L” amino acid transport system. Neither agent involved the “A” amino acid transport system. The investigators concluded that, due to similarity in the tracer uptake mechanism, IMT SPECT and (11)C-MET positron-emission tomography (PET) could be used for the diagnostic evaluation of glioma with similar clinical relevance.
Unlike the PET scan, functional metabolic imaging with SPECT is less expensive and is widely available. Hence, SPECT imaging is a cost-effective, noninvasive imaging modality that could be used to aid in the diagnosis and evaluation of treatment response of gliomas.
Related posts:
Stay updated, free articles. Join our Telegram channel

Full access? Get Clinical Tree


